Download presentation
Presentation is loading. Please wait.

1
Using CEM Data for Self-Evaluation and Improvement Running Your School on Data 7 th June 2011 Peter.Hendry@cem.dur.ac.uk

2
Running your school on data CEM data includes: School profile bands Baseline test acquired ability data, inc. IPRs Predictive data inc. chances graphs Value-added data Attitudinal data Curriculum assessments (Insight) Software programmes (PARIS) with databases
 Software programmes (PARIS) with databases.")
3
So much data................................! 1.What data is needed? (What data is not needed?) 2. And for Whom is the data ? 3. What does the data mean? (What does the data not mean?) Some key questions:
 2. And for Whom is the data . 3. What does the data mean. (What does the data not mean ) Some key questions:.")
4
1. What data do I need? A key first step! e.g. using MidYIS GCSE predictive data for target setting Point and/or grade predictions? (e.g. 5.8/grade B) Based on whole cohort? Based on the 75 th percentile? Based on prior value-added? The chances graphs?
 Based on whole cohort. Based on the 75 th percentile. Based on prior value-added. The chances graphs .")
5
Prediction 6.3 A/B

6
Prediction 7.4 A*/A

7
Discussion: setting the targets........... From your perspective, assess the merit of each type of predictive data and the associated chances graphs Which type of predictive data would you use to set the targets, and why? Would your students be involved as part of the target setting process? Would parents be informed about the process and outcome? How would you ensure that HoDs were involved to ensure overview the process?

8
2. CEM data: who is it for? For example: SMT/SLT: summary data, attitudinal HoDs: Subject VAD, predictive data Subject teachers: FormTutors: Head of Learning/Year/House: Parents: Pupils: and not forgetting: Governors: Media:

9
3. What does the data mean? e.g. value-added data: The difference between raw and standardised residuals The use of confidence limits to distinguish between average and statistically significant data, and to allow for small entry subjects Can ‘zero’ or even ‘negative value-added’ be acceptable?

10
Raw residual Bar chart (MIDYIS and YELLIS only)
")
11
Standardised Residual Bar Chart 99.7% confidence limit 95% confidence limit ANY VALUE IN THE INNER SHADED AREA IS CONSIDERED TO BE AVERAGE VALUE ADDED

12
Raw residual Bar chart (MIDYIS and YELLIS only)
")
13
Standardised Residual Bar Chart 99.7% confidence limit 95% confidence limit ANY VALUE IN THE INNER SHADED AREA IS CONSIDERED TO BE AVERAGE VALUE ADDED

14
Standardised Residual Bar Chart

15
Case study: Alis value-added data Four sets of VAD are available! From average GCSE baseline: all Alis cohort type of Institution Syllabus From the baseline test all Alis cohort

16
SPC Chart with confidence limits: WHOLE SCHOOL All Alis Cohort: Institution Syllabus

17
Using PARIS software: Baseline Test Whole School From your perspective, which set of VAD would you use for the different user groups? (Governors, HoDs, Media, Parents, SMT/SLT...)
.")
18
A final thought.......... Is it possible to keep adding value at each key stage?

19
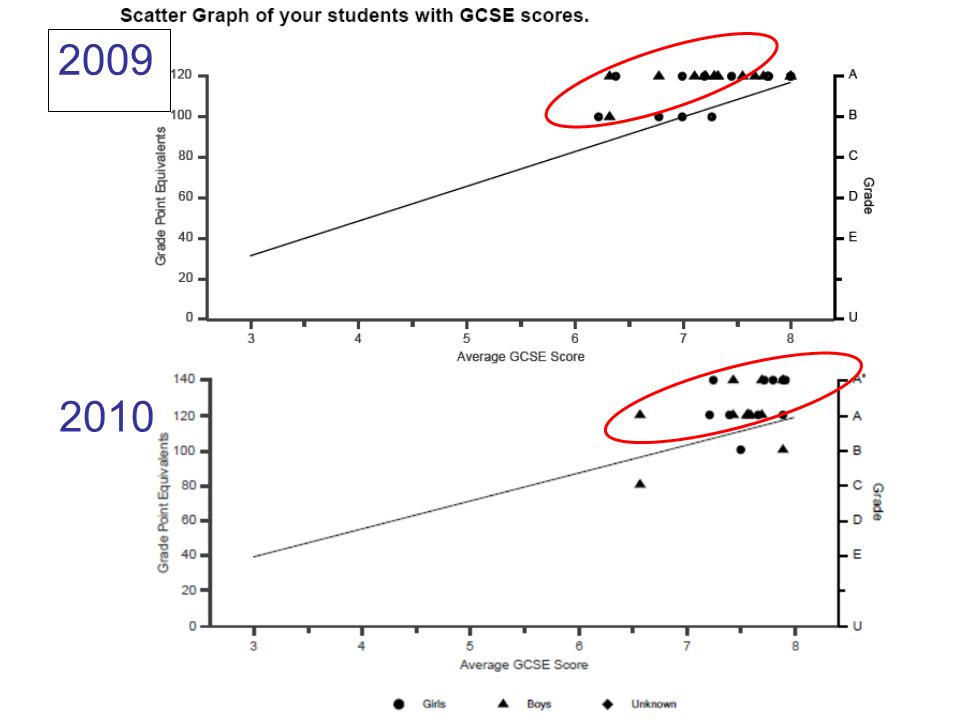
2009 A2 2010 A2

20
2009 2010
21
USE ONE YEARS DATA WITH CAUTION! Better to use three years data as patterns over time are more significant.

22
Teachers to help learners Curriculum and staffing decisions Target setting and monitoring pupil progress Inspection evidence Self-evaluation Monitoring changes over time such as pupil ability intake profiles and VAD Asking the question ‘can we do better?’ i.e. the data is used to aid and to support professional judgement CEM data is used for:

23
with due consideration to: Ethos and tradition of ‘my’ institution Accountability Parental expectations Staff training in use of, and ability to cope with, data (data overload) Management of data: integrating the data into school procedures, storage, retrieval, distribution and access……policy? i.e. doing our best to help every pupil to at least achieve, if not exceed, their potential

Similar presentations

 Identify areas in which each of us can make assessment more effective.>")


 & S2 Curriculum-based.>")


