Download presentation
Presentation is loading. Please wait.

1
Designing Evaluation Plans and Reports for School Climate Transformation Grants Valerie Velez, Hemet Unified School District Steve Goodman, Michigan Integrated Behavior and Learning Support Initiative (MiBLSi) Rob Horner, University of Oregon
 Rob Horner, University of Oregon")
2
Goals Review evaluation expectations for LEA and SEA grantees. Especially around use of the Ed 524B Project Status Chart Propose possible evaluation questions, data sources and reporting options Provide a state example Provide a district example

3
Main Messages Build a functional PROJECT evaluation plan and federal (GPRA) reporting will be a natural outcome. SHS reporting schedule (GPRA) – Late October of each year – Cover Oct 1-Sept 30 of prior year.
 – Late October of each year – Cover Oct 1-Sept 30 of prior year..")
4
GPRA Government Performance and Results Act President Obama signed into law the Government Performance and Results Modernization Act of 2010 on January 4, 2011. The GPRA Modernization Act updated some aspects of the Government Performance and Results Act (GPRA) of 1993, which established strategic planning, performance planning, and performance reporting as ways for federal agencies to communicate progress in achieving their missions.
 of 1993, which established strategic planning, performance planning, and performance reporting as ways for federal agencies to communicate progress in achieving their missions..")
5
Project Evaluation Plan Uses Annual reports to Safe and Health Students – Ed 524 B Performance Report Annual reports to Local Project administrators On-going reports used for guiding project implementation and development.. Fidelity Capacity Impact Evaluation Questions Data Sources Schedule of Data Collection

6
SCTG Evaluation Expectations REQUIRED: GPRA Performance Indicators from the RFP – LEA and SEA SELECTED: Evaluation questions and targets that grantees have written into the application proposals. ADDED: Supplemental evaluation questions added since receiving funding.

7
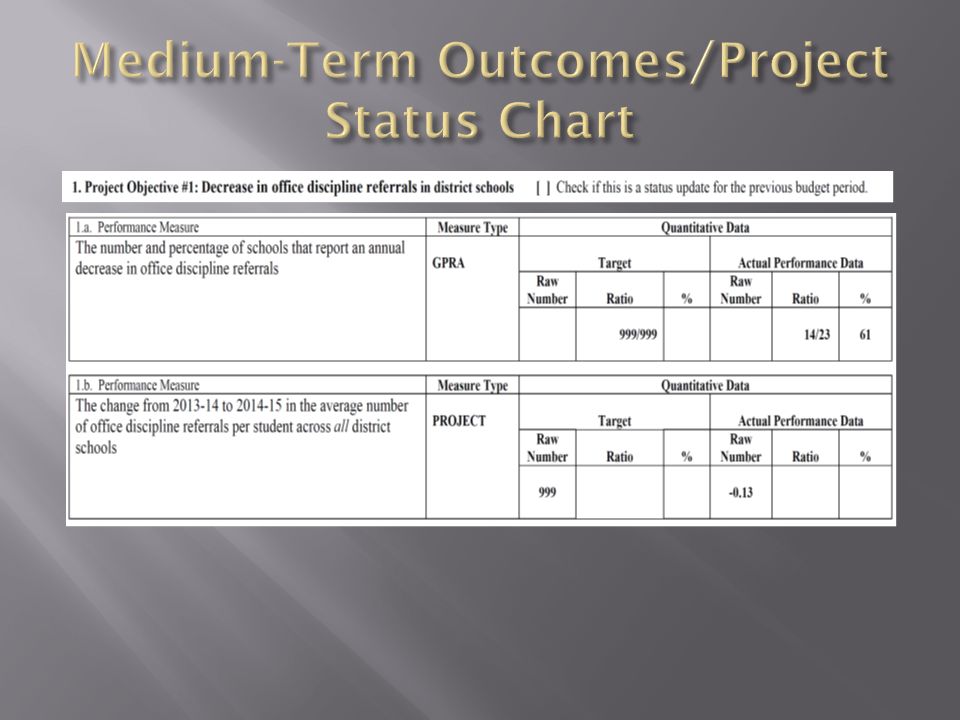
Performance Indicators/GPRA: LEA ED Performance Report Form 524B at http://www.ed.gov/fund/grant/apply/appforms/appforms.html Number and percentage of schools that report an annual decrease in office disciplinary referrals. Number and percentage of schools that report an annual improvement in the attendance rate. Number and percentage of schools that report an annual decrease in suspensions and expulsions, including those related to possession or use of drugs or alcohol. Number and percentage of schools annually that are implementing the multi-tiered behavioral framework with fidelity.

8
District/ School Discipline Data Office Discipline Referrals. – Ensure operational definitions – Clarify standard for “Staff Managed” versus “Office Managed” – Clarify “minor” and “major” See: Irvin, L., Tobin T., Sprague, J., Sugai, G., & Vincent, C., (2004) Validity of Office Discipline Referral Measures as Indices of School-wide Behavioral Interventions. Journal of Positive Behavior Interventions. 6 (3) 131-147. Data Sources – District School Information System (e.g. Synergy, PowerSchool, AERIES, Skyward) – School-based Data Decision Systems: Review 360, Educator’s Handbook, School-wide Information System (SWIS)
 Validity of Office Discipline Referral Measures as Indices of School-wide Behavioral Interventions. Journal of Positive Behavior Interventions. 6 (3) Data Sources – District School Information System (e.g. Synergy, PowerSchool, AERIES, Skyward) – School-based Data Decision Systems: Review 360, Educator’s Handbook, School-wide Information System (SWIS).")
9
Decrease in Major Office Discipline Referrals Consider “Major” office discipline referrals per 100 students per school day as the comparative metric. – Separate by grade level (Elementary, Middle, High) – Separate by cohort (Year One adoption, Year Two adoption) Major ODRs per 100 students per school day Major ODRs per school day per 100 students for School “X “across years 1, 2 and 3 National SWIS Median for Elementary
 – Separate by cohort (Year One adoption, Year Two adoption) Major ODRs per 100 students per school day Major ODRs per school day per 100 students for School X across years 1, 2 and 3 National SWIS Median for Elementary.")
10
SWIS Summary 2014-15(Majors Only) 4581 Schools, 2,440,743 Students, 1,472,544 ODRs Grade Range Number of Schools Mean Enrollment per School Mean ODRs per 100 Students/ School Day Median ODRs per 100 per Students/ School Day 25 th Percentile ODR/100 Students/ School Day 75 th Percentile ODR/100 Students/ School Day K-6 2997449.33 (.49).20.09.40 6-9 849663.49 (.59).33.16.61 9-12 439848.49 (.48).35.17.65 PreK-8 302425.44 (1.04).26.13.50 PreK-12 74308.54 (.76).28.12.55 Available at www.swis.org
 4581 Schools, 2,440,743 Students, 1,472,544 ODRs Grade Range Number of Schools Mean Enrollment per School Mean ODRs per 100 Students/ School Day Median ODRs per 100 per Students/ School Day 25 th Percentile ODR/100 Students/ School Day 75 th Percentile ODR/100 Students/ School Day K (.49) (.59) (.48) PreK (1.04) PreK (.76) Available at")
11
ODR Rates per SCTG School at Time X (compared with SWIS national median) 1 2 3 4 5 1 2 3 4 5 1 2 3 4 5 Major ODRs per 100 students per school day National Median
 Major ODRs per 100 students per school day National Median")
12
ODR Rates at Times 1, 2 and 3 for SCTG Schools by Grade Cluster (compared with SWIS national median) Elementary n = 8 Middle n = 6 High School n = 5 Major ODR per 100 Students per School Day Average High Low
 Elementary n = 8 Middle n = 6 High School n = 5 Major ODR per 100 Students per School Day Average High Low")
13
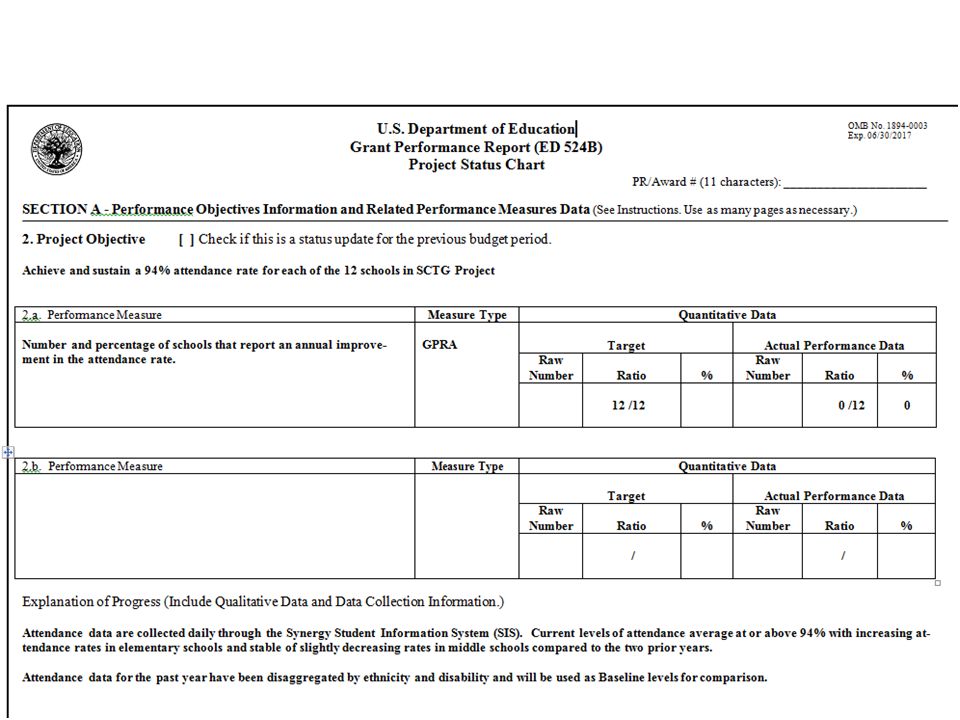
Reduce the racial disproportionality in SCTG schools by 10% annually.e Major office discipline referrals are collected on an on-going schedule and entered into a data system that generates ODR/day for each school. These data are used to monitoring daily, weekly and monthly levels. Data are compared monthly with prior years, and with other schools (both within the district and nationally) using ODR/ school day / 100 students as the comparison metric.
 using ODR/ school day / 100 students as the comparison metric..")
14
Performance Indicators/GPRA: LEA ED Performance Report Form 524B at http://www.ed.gov/fund/grant/apply/appforms/appforms.html Number and percentage of schools that report an annual decrease in office disciplinary referrals. Number and percentage of schools that report an annual improvement in the attendance rate. Number and percentage of schools that report an annual decrease in suspensions and expulsions, including those related to possession or use of drugs or alcohol. Number and percentage of schools annually that are implementing the multi-tiered behavioral framework with fidelity.

15
Improved Attendance Rates Overall Attendance Rates per School Day Define: Proportion of enrolled students with at least.50 day of school? Define: Unexcused versus excused… combined Consider also disaggregating attendance by: Grade Level (Elem, Middle, High) At-risk category – Disability – English Learner – Socio-economic status – Ethnicity
 At-risk category – Disability – English Learner – Socio-economic status – Ethnicity.")
16
Attendance Summary For Time period X to Y Percentage Attending per School Day Unexcused Absences per School Day Excused Absences per School Day Total Absences per School Day Elementary N = X Attending at least.50 day Divided by total enrollment Count of unexcused absences / number of school days Count of excused absences/ number of school days Count of excused plus unexcused absences / number of school days Middle N = Y High School N = z

18
Performance Indicators/GPRA: LEA ED Performance Report Form 524B at http://www.ed.gov/fund/grant/apply/appforms/appforms.html Number and percentage of schools that report an annual decrease in office disciplinary referrals. Number and percentage of schools that report an annual improvement in the attendance rate. Number and percentage of schools that report an annual decrease in suspensions and expulsions, including those related to possession or use of drugs or alcohol. Number and percentage of schools annually that are implementing the multi-tiered behavioral framework with fidelity.

19
Suspension/ Expulsion Three elements to Suspension/Expulsion – Total number of suspensions/ exp of.50 days or more – Number of students suspended/ exp for at least.50 days – Number of days suspended / exp. SchoolSuspensions per 100 students per year Students suspended per 100 students per year Days suspended per 100 students per year. School A School B School C School D Summary Mean

20
Suspension/ Expulsions Disaggregated Suspensions and Expulsions for substance abuse (drugs, alcohol). Consider comparing total Suspension/Expulsion rates with Suspension/ Expulsion rates for substance abuse.

21
ED 534 B Performance Report

22
Performance Indicators/GPRA: LEA ED Performance Report Form 524B at http://www.ed.gov/fund/grant/apply/appforms/appforms.html Number and percentage of schools that report an annual decrease in office disciplinary referrals. Number and percentage of schools that report an annual improvement in the attendance rate. Number and percentage of schools that report an annual decrease in suspensions and expulsions, including those related to possession or use of drugs or alcohol. Number and percentage of schools annually that are implementing the multi-tiered behavioral framework with fidelity.

23
Fidelity of Multi-tiered Behavior Support Framework Implementation Are schools using Tier I practices and systems of behavior support? Are schools using Tier II practices and systems of behavior support? Are schools using Tier III practices and systems of behavior support?

24
Measuring Fidelity of Multi-tiered Behavior Support All three tiers Measure meets Technical Adequacy Standards – Construct validity – Test-retest reliability – Inter-rater agreement – Usability – Factorial validity – Association with other measures Use measure that fits your interventions One option: The Tiered Fidelity Inventory v.2.1

25
Available from OSEP TA-Center www.pbis.org www.pbis.org www.pbisapps.org No Cost Assessors Training PowerPoint and Assessors Training Video at www.pbisapps.org www.pbisapps.org TFI- Technical Adequacy (McIntosh, Massar et al. 2015) Content Validity (Tier 1.95; Tier II.93; Tier III.91) Usability (12 of 14 > 80%) (15 min per Tier) Inter-rater Agreement (.95;.96;.89) Test-retest reliability (.98;.99;.99) Factor Analysis
 Content Validity (Tier 1.95; Tier II.93; Tier III.91) Usability (12 of 14 > 80%) (15 min per Tier) Inter-rater Agreement (.95;.96;.89) Test-retest reliability (.98;.99;.99) Factor Analysis.")
26
Sub-scale report

27
Item Report

28
Report Summary: TFI High, Low, Mean 18 SCTG Schools Tier I Tier II Tier III

29
Prepared by Valerie Velez, M.P.H., SCTI Project Director Hemet Unified School District Dr. Adam Voight, SCTI Grant External Evaluator Assistant Professor of Curriculum and Foundations Associate Director of the Center for Urban Education College of Education and Human Services Cleveland State University

30
The Hemet Unified School District (HUSD), located in Riverside County in Southern California, covers one of the largest geographic areas of any district in California with more than 700 square miles of diverse topography and serves both suburban and rural communities with a current enrollment of just under 22,000 students. HUSD’s student population is: 51% Hispanic, 34% White, 8% African American and 2% Native American. Socioeconomic disadvantage is a pervasive issue for HUSD’s student population; district wide the free-and-reduced-price-meals rate is 83%. English learners make up 12% of the student body and the special education population comprises 15% of HUSD students.

31
District-wide MTBF Implementation: 11 elementary sites Three K-8 schools 4 middle schools 4 comprehensive high schools One continuation school One community day school

32
Year 1 Reporting Long-Term OutcomesResources and Inputs District SCTI team that actively coordinates implementation District funding, visibility, and political support and coordination with LCAP goals External MTBF trainers, PLUS advisors, and evaluation support Release time for school teams to attend training and coordinate MTBF implementation Boys Town Social Skills in Schools and Why Try curricula Restorative Practices Elementary counselors through USDOE grant Middle Grades School Climate Alliance/REL Action Team Planning National Technical Assistance Center on PBIS Medium-Term Outcomes Improved student, staff, and parent perceptions of school climate Improved student attendance Decrease in student suspensions and expulsions (including those related to possession or use of drugs or alcohol) Decrease in student office discipline referrals Reduce disparities in student office discipline referrals, suspensions, and expulsions based on race/ethnicity and disability Short-Term Outcomes Increase in number of schools that are implementing a MTBF with fidelity Installation of district MTBF coaches and school teams Increase in the fidelity of implementation of MTBF in schools Increased use of the student data system by school staff Increase District SCTI team capacity for coordinating MTBF Creation of updated student codes of conduct Creation of a fair and effective discipline plan Activities Training for two district MTBF coaches MTBF training workshop for site and district based MTBF coaches (2 days/yr) MTBF training workshop for site-based MTBF teams (4 days/yr) District MTBF coordinators provide technical assistance to school staff PLUS training workshop for adult advisors for data collection and enhanced student voice Refinement of student data system and training for school staff Implementation of MTBF in after-school programs Initiate process for updating the student codes of conduct to support SCTI Initiate process for developing a fair and effective discipline plan, including student input HUSD SCTI measurable objectives bolded Improved student academic achievement Improved safe school climate See GPRA Performance Report
 Decrease in student office discipline referrals Reduce disparities in student office discipline referrals, suspensions, and expulsions based on race/ethnicity and disability Short-Term Outcomes Increase in number of schools that are implementing a MTBF with fidelity Installation of district MTBF coaches and school teams Increase in the fidelity of implementation of MTBF in schools Increased use of the student data system by school staff Increase District SCTI team capacity for coordinating MTBF Creation of updated student codes of conduct Creation of a fair and effective discipline plan Activities Training for two district MTBF coaches MTBF training workshop for site and district based MTBF coaches (2 days/yr) MTBF training workshop for site-based MTBF teams (4 days/yr) District MTBF coordinators provide technical assistance to school staff PLUS training workshop for adult advisors for data collection and enhanced student voice Refinement of student data system and training for school staff Implementation of MTBF in after-school programs Initiate process for updating the student codes of conduct to support SCTI Initiate process for developing a fair and effective discipline plan, including student input HUSD SCTI measurable objectives bolded Improved student academic achievement Improved safe school climate See GPRA Performance Report")
33
1. Builds capacity for implementing a sustained, school-wide multi-tiered behavioral framework: PBIS Status and Needs Assessment of all district schools, May-June 2014 Benchmarks of Quality (BoQ) completed with site-based PBIS teams at all district schools, August 2014 PBIS Leadership Conference and Project Directors’ Meeting, October 2014 Finalized project evaluation logic model in collaboration with evaluator, December 2014 PBIS Counselor on Special assignment hired February 2015 Dr. Rob Horner made site visit to HUSD February, 2015 and held meetings with District PBIS Implementation Team, Cabinet Barbara Kelly, California PBIS Technical Assistance Center made presentation at Assistant Principals’ Academy, February 2015 2015-2016 PBIS site teams training action planned designed and approved, May 2015 PBIS training dates for 2015-2016 calendared, May 2015 SWIS Orientation session for Cohort 1 principals, June 2015 SWIS facilitator training registration complete for Project Director and Counselor on Special Assignment for November 2015 In-Person Professional Development Webinars
 completed with site-based PBIS teams at all district schools, August 2014 PBIS Leadership Conference and Project Directors’ Meeting, October 2014 Finalized project evaluation logic model in collaboration with evaluator, December 2014 PBIS Counselor on Special assignment hired February 2015 Dr. Rob Horner made site visit to HUSD February, 2015 and held meetings with District PBIS Implementation Team, Cabinet Barbara Kelly, California PBIS Technical Assistance Center made presentation at Assistant Principals’ Academy, February 2015 PBIS site teams training action planned designed and approved, May 2015 PBIS training dates for calendared, May 2015 SWIS Orientation session for Cohort 1 principals, June 2015 SWIS facilitator training registration complete for Project Director and Counselor on Special Assignment for November 2015 In-Person Professional Development Webinars.")
34
2. Enhances capacity by providing training and technical assistance to schools: Dr. Rob Horner made site visit to HUSD February, 2015 and held meetings with all principals and department directors and Cohort 1 principals 2015-2016 PBIS site teams training action planned designed and approved, May 2015 Tiered Fidelity Instrument (TFI) Walk-Throughs held at all Cohort 1 schools (11) March-April 2015 Fully facilitated TFI assessments held with all Cohort 1 schools, May 2015 3. Demonstrates a partnership with a technical assistance provider, such as the PBIS Technical Assistance Center: Barbara Kelly formally engaged as contracted TA consultant through June 2016, California PBIS Center
 Walk-Throughs held at all Cohort 1 schools (11) March-April 2015 Fully facilitated TFI assessments held with all Cohort 1 schools, May Demonstrates a partnership with a technical assistance provider, such as the PBIS Technical Assistance Center: Barbara Kelly formally engaged as contracted TA consultant through June 2016, California PBIS Center.")
35
Baseline data were not set prior to Year 1 Cross- school average score on the TFI for Tier 1 Percent of the cross- school average score out of the total possible score This is a GPRA

36
Rancho Viejo Middle Hemet, California School Year: 2014-15 Date Completed: 5/20/2015 Tier I: Universal SWPBIS Features Teams5/20/15 1. Team Composition: Tier I team includes a Tier I systems coordinator, a school administrator, a family member, and individuals able to provide (a) applied behavioral expertise, (b) coaching expertise, (c) knowledge of student academic and behavior patterns, (d) knowledge about the operations of the school across grade levels and programs, and for high schools, (e) student representation. 1 2. Team Operating Procedures: Tier I team meets at least monthly and has (a) regular meeting format/agenda, (b) minutes, (c) defined meeting roles, and (d) a current action plan. 1 Feature Total:2 of 4
 applied behavioral expertise, (b) coaching expertise, (c) knowledge of student academic and behavior patterns, (d) knowledge about the operations of the school across grade levels and programs, and for high schools, (e) student representation Team Operating Procedures: Tier I team meets at least monthly and has (a) regular meeting format/agenda, (b) minutes, (c) defined meeting roles, and (d) a current action plan. 1 Feature Total:2 of 4.")
37
Evaluation 5/20/15 12. Discipline Data: Tier I team has instantaneous access to graphed reports summarizing discipline data organized by the frequency of problem behavior events by behavior, location, time of day, and by individual student. 1 13. Data-Based Decision Making: Tier I team reviews and uses discipline data and academic outcome data (e.g., Curriculum-Based Measures, state tests) at least monthly for decision-making. 0 14. Fidelity Data: Tier I team reviews and uses SWPBIS fidelity (e.g., SET, BoQ, TIC, SAS, Tiered Fidelity Inventory) data at least annually. 2 15. Annual Evaluation: Tier I team documents fidelity and effectiveness (including on academic outcomes) of Tier I practices at least annually (including year-by-year comparisons) that are shared with stakeholders (staff, families, community, district) in a usable format. 0 Feature Total:3 of 8
 at least monthly for decision-making Fidelity Data: Tier I team reviews and uses SWPBIS fidelity (e.g., SET, BoQ, TIC, SAS, Tiered Fidelity Inventory) data at least annually Annual Evaluation: Tier I team documents fidelity and effectiveness (including on academic outcomes) of Tier I practices at least annually (including year-by-year comparisons) that are shared with stakeholders (staff, families, community, district) in a usable format. 0 Feature Total:3 of 8.")
39
Baseline data were not set prior to Year 1 Ratio of all 5 th grade students in the district who scored “high” Percent of all 5 th grade students in the district who scored “high” This is a “Project” outcome, not a GPRA

41
All schools using common systems Focus initially on fidelity Building data collection capacity to assess student discipline patterns Establishing training for Data Use… not just data collection. Schools aware that data being reviewed regularly at district office. Coaching and professional development integral to building internal capacity for sustainability at the site and district levels Integration of district/state/federal initiatives i.e. Local Control Accountability Plan with regard to school climate and student and parent engagement External evaluator’s Evaluation Progress Report, updated at least annually.

42
Valerie Velez, M.P.H. Hemet Unified School District (951) 765-5100, ext. 3210 vvelez@hemetusd.org
 , ext")
43
43 http://miblsi.cenmi.org Steve Goodman sgoodman@miblsimtss.org

44
Develop, enhance, or expand statewide systems of support for and technical assistance to school districts and schools implementing an evidence-based, multi-tiered behavioral framework for improving behavioral outcomes and learning conditions for all students. The work focuses on Positive Behavioral Interventions & Supports (PBIS) with possible connections to other school climate initiatives. What are we trying to do?
 with possible connections to other school climate initiatives. What are we trying to do .")
45
Improve local capacity of 90 LEAs to support implementation of PBIS through coordination, training, coaching, behavioral expertise, and evaluation. Improve implementation process by facilitation through stages with 80% of LEAs operating at the initial PBIS implementation stage after one year. Improve school climate by schools implementing PBIS with fidelity, reducing discipline problems, and demonstrating improved student perception of school climate. Increase cross agency collaboration (e.g., education, mental health, justice system) to enhance overall impact of multi-tiered behavioral framework. Project Goals
 to enhance overall impact of multi-tiered behavioral framework. Project Goals.")
46
Performance Indicators/GPRA: SEA The number of training and technical assistance events provided by the SEA School Climate Transformation Grant Program to assist LEAs in implementing a multi-tiered behavioral framework. The number and percentage of LEAs provided training or technical assistance by the SEA School Climate Transformation Grant Program that report an improvement in knowledge and understanding of the implementation of a multi-tiered behavioral framework. The number and percentage of schools in LEAs provided training or technical assistance by the SEA School Climate Transformation Grant Program that implement a multi-tiered behavioral framework.

47
Performance Indicators The number of training and technical assistance events provided by the SEA School Climate Transformation Grant Program to assist LEAs in implementing a multi-tiered behavioral framework.

49
Grant Performance Report: Michigan Example

50
Number of Schools Implementing MTBF Number of Schools Implementing 2014 - 2015 Elementary70 Middle17 High21 Other10 TOTAL118

51
Training Record Example DateTraining TopicDurationDistrictSchools Number of Participants 1/27/15 School Wide PBIS Day 1- Elementary 1 dayCharlton Public Schools Carlton Early Elementary Charlton Upper Elementary 22 2/10/15 School Wide PBIS Day 1- Secondary 1 dayAlton Community Schools Westview High School Robertson High School 14 2/12/15 School Wide PBIS Day 1- Elementary 1 dayWilliamsburg Consolidated Schools Pinewood Elementary Hickory Elementary Maple Hill Elementary Sand Lake Elementary 31 TOTALS3 days3 Districts8 Schools 6 Elementary 2 Secondary 67 Participants

52
Cumulative Implementing Schools Chart Example ElementaryMiddleHigh

53
Performance Indicators The number and percentage of LEAs provided training or technical assistance by the SEA School Climate Transformation Grant Program that report an improvement in knowledge and understanding of the implementation of a multi- tiered behavioral framework.

54
Grant Performance Report: Michigan Example

55
Instructions: Read the definitions for each skill dimension. Reflect on your current knowledge and practice (as of right now) and your knowledge and practice at the beginning of this training. Read each behavioral statement below the definition and circle the number for each item that best describes your behavior. Please be honest with yourself. 1 = Not Competent/Need More PD 2 = Developing Competence 3 = Competence 4 = Mastery Retrospective Self Assessment Example Before Training Question After Training 12341234 X 1.I can articulate the purpose of implementation team as it relates to the implementation of Positive Behavioral Interventions & Supports (PBIS). X X 2.I can summarize our building’s data related to office discipline referrals X X 3. I can create a behavior expectation matrix that define the expectation and examples of each expectation within an identified setting. X X 4. I can describe the purpose of teaching behavior expectations. X
 and your knowledge and practice at the beginning of this training. Read each behavioral statement below the definition and circle the number for each item that best describes your behavior. Please be honest with yourself. 1 = Not Competent/Need More PD 2 = Developing Competence 3 = Competence 4 = Mastery Retrospective Self Assessment Example Before Training Question After Training X 1.I can articulate the purpose of implementation team as it relates to the implementation of Positive Behavioral Interventions & Supports (PBIS). X X 2.I can summarize our building’s data related to office discipline referrals X X 3. I can create a behavior expectation matrix that define the expectation and examples of each expectation within an identified setting. X X 4. I can describe the purpose of teaching behavior expectations. X.")
56
Knowledge and Understanding Annual Survey Example Increased Knowledge Deeper Understanding Better Implementation

57
Participant Knowledge and Understanding Survey Knowledge and Understanding Example Question Strongly Agree Agree Slightly Agree Disagree Strongly Disagree 1.As a result of participating in this project, I have an increased my knowledge of key features of a Multi-Tiered Behavioral Framework X 2.As a result in participating in this project, I have a deeper my understanding of how to effectively implement a Multi-Tiered Behavioral Framework X 3. As a result in participating in this project, I feel that our schools can better implement a Multi-Tiered Behavioral Framework. X

58
Performance Indicators The number and percentage of schools in LEAs provided training or technical assistance by the SEA School Climate Transformation Grant Program that implement a multi-tiered behavioral framework.

59
Performance Indicators The number and percentage of schools in LEAs provided training or technical assistance by the SEA School Climate Transformation Grant Program that implement a multi-tiered behavioral framework.

60
Grant Performance Report: Michigan Example

61
Implementation Fidelity Summary Example Winter 2014Winter 2015

62
Selected Measures State Capacity District Capacity School Climate (to be addressed in future)
")
63
Possible Measures of SEA/LEA Capacity www.sisep.org State Capacity Assessment (SCA) – Assessment of extent to which state department has capacity to implement evidence-based practices at scales of social significance? – No Cost, from OSEP’s SISEP TA-Center www.sisep.org; www.scalingup.orgwww.sisep.org www.scalingup.org – Scores: Total, Sub-scale, Item – Used for initial assessment, action planning, progress monitoring District Capacity Assessment (DCA) – Assessment of extent to which a school district (or region) has capacity to implement evidence-based practices as scales of social significance? – No Cost, from OSEP’s SISEP TA-Center – Scores: Total, Sub-scale, Item – Used for initial assessment, action planning, progress monitoring Implementers Training Video
 – Assessment of extent to which a school district (or region) has capacity to implement evidence-based practices as scales of social significance. – No Cost, from OSEP’s SISEP TA-Center – Scores: Total, Sub-scale, Item – Used for initial assessment, action planning, progress monitoring Implementers Training Video.")
64
Resources Grantees are held accountable for what they submitted. But some consistency across projects may help all evaluation efforts Resources that may be helpful: – Evaluation Blueprint (www.pbis.org)www.pbis.org – PBIS Evaluation Annual Reports (www.pbis.org)www.pbis.org – State and District Capacity Assessments www.sisep.org – Multi-tiered Fidelity Assessment (Tier I, Tier II, Tier III) www.pbisapps.org – Multi-tiered student discipline data systems SWIS, CICO-SWIS, ISIS-SWIS www.swis.org, www.pbisapps.org www.swis.orgwww.pbisapps.org
 – Multi-tiered student discipline data systems SWIS, CICO-SWIS, ISIS-SWIS")
66
Questions/ Comments Questions: Comments for future webinars:

Similar presentations

 E-12>")


 Metro RIP (Regional Implementation Project) November 6, 2013 Shoreview Community Center T. J. Larson, MAT Barack.>")


