Download presentation
Presentation is loading. Please wait.

1
Designing Evaluation Plans and Reports for School Climate Transformation Grants Webinar February 26, 2015 Rob Horner, Steve Goodman, Jessica Swain-Bradway Technical Support from Ivan Polk OSEP TA-Center on PBIS

2
Goals Review evaluation expectations for LEA and SEA grantees.
Propose measurement and display options for collecting and reporting evaluation data for LEAs and SEAs who have received School Climate Transformation Grants. Requested by grantees submitting SCTG worksheets. Foundation for hiring evaluators and building evaluation plans. Provide opportunity for comment/questions.

3
Organization LEA evaluation planning POLL SEA evaluation planning
Indicators and report formats POLL SEA evaluation planning Additional evaluation measures and resources Questions, Comments, and Suggestions for Future Webinars

4
Disclaimer The content of this webinar is designed to be informative not obligatory. As members of the PBIS TA-Center we offer guidance based on our experience from working with states, districts and schools implementing multi-tiered behavior support frameworks. We do NOT speak for Safe and Healthy Students or OSEP. Presenters:

5
Target Audiences SCTG Principal Investigators
SCTG Project Coordinators SCTG Project Evaluators internal and external

6
SCTG Evaluation Expectations
REQUIRED: Performance Indicators from the RFP LEA and SEA SELECTED: Evaluation questions and targets that grantees have written into the application proposals. ADDED: Supplemental evaluation questions added since receiving funding.

7
Performance Indicators/GPRA: LEA ED Performance Report Form 524B at Number and percentage of schools that report an annual decrease in office disciplinary referrals. Number and percentage of schools that report an annual improvement in the attendance rate. Number and percentage of schools that report an annual decrease in suspensions and expulsions, including those related to possession or use of drugs or alcohol. Number and percentage of schools annually that are implementing the multi-tiered behavioral framework with fidelity.

8
Many Strategies Proposed
Mental Health First Aid Restorative Justice/ Practice Safe and Civil Schools Positive Behavioral Interventions and Supports (PBIS) Project Achieve Ripple Effects Check and Connect Good Behavior Game Too Good for Drugs Character Counts Bully Prevention
 Project Achieve. Ripple Effects. Check and Connect. Good Behavior Game. Too Good for Drugs. Character Counts. Bully Prevention.")
9
Fidelity of Multi-tiered Behavior Support Framework Implementation
Are schools using Tier I practices and systems of behavior support? Are schools using Tier II practices and systems of behavior support? Are schools using Tier III practices and systems of behavior support?

10
Measuring Fidelity of Multi-tiered Behavior Support
All three tiers Measure meets Technical Adequacy Standards Construct validity Test-retest reliability Inter-rater agreement Usability Factorial validity Association with other measures Use measure that fits your interventions One option: The Tiered Fidelity Inventory v.2.1

11
TFI- Technical Adequacy (McIntosh, Massar et al. 2015)
Available from OSEP TA-Center No Cost Assessors Training PowerPoint and Assessors Training Video at TFI- Technical Adequacy (McIntosh, Massar et al. 2015) Content Validity (Tier 1 .95; Tier II .93; Tier III .91) Usability (12 of 14 > 80%) (15 min per Tier) Inter-rater Agreement (.95; .96; .89) Test-retest reliability (.98; .99; .99) Factor Analysis
 Content Validity (Tier 1 .95; Tier II .93; Tier III .91) Usability (12 of 14 > 80%) (15 min per Tier) Inter-rater Agreement (.95; .96; .89) Test-retest reliability (.98; .99; .99) Factor Analysis.")
12
Main Idea: the essence of the feature.
Feature Name Subscale Feature Data Sources Scoring Criteria 0 = Not implemented 1 = Partially implemented 2 = Fully implemented Feature Name: Detailed description of the feature. Possible data sources 0 = descriptors of the feature not being implemented 1 = descriptors of the feature being partially implemented 2 = descriptors of the feature being fully implemented Main Idea: the essence of the feature.

13
1.1 Team Composition Subscale: Teams Feature Data Sources
Scoring Criteria 0 = Not implemented 1 = Partially implemented 2 = Fully implemented 1.1 Team Composition: Team Composition: Tier I team includes a Tier I systems coordinator, a school administrator, a family member, and individuals able to provide (a) applied behavioral expertise, (b) coaching expertise, (c) knowledge of student academic and behavior patterns, (d) knowledge about the operations of the school across grade levels and programs, and for high schools, (e) student representation. School organizational chart Tier I team meeting minutes 0 = Tier I team does not exist or does not include coordinator, school administrator, or individuals with applied behavioral expertise 1 = Tier I team exists, but does not include all identified roles or attendance of these members is below 80% 2 = Tier I team exists with coordinator, administrator, and all identified roles represented, AND attendance of all roles is at or above 80% Main Idea: Teams need people with multiple skills and perspectives to implement PBIS well.
 applied behavioral expertise, (b) coaching expertise, (c) knowledge of student academic and behavior patterns, (d) knowledge about the operations of the school across grade levels and programs, and for high schools, (e) student representation. School organizational chart. Tier I team meeting minutes. 0 = Tier I team does not exist or does not include coordinator, school administrator, or individuals with applied behavioral expertise. 1 = Tier I team exists, but does not include all identified roles or attendance of these members is below 80% 2 = Tier I team exists with coordinator, administrator, and all identified roles represented, AND attendance of all roles is at or above 80% Main Idea: Teams need people with multiple skills and perspectives to implement PBIS well.")
14
Total score (TFI)
")
15
Sub-scale report

16
Sub-subscale report Tier I Teams Implementation Evaluation Tier II
Interventions Evaluation Tier III Teams Resources Assessment Support plan Monitoring and adaptation

17
Item Report

18
Action Planning 1. Team to propose teaching template and Fall teaching schedule at Feb 16 Faculty meeting. Alan Feb 16

19
Report Summary: TFI High, Low, Mean 18 SCTG Schools
Tier I Tier II Tier III

20
Performance Indicators/GPRA: LEA ED Performance Report Form 524B at Number and percentage of schools that report an annual decrease in office disciplinary referrals. Number and percentage of schools that report an annual improvement in the attendance rate. Number and percentage of schools that report an annual decrease in suspensions and expulsions, including those related to possession or use of drugs or alcohol. Number and percentage of schools annually that are implementing the multi-tiered behavioral framework with fidelity.

21
District/ School Discipline Data
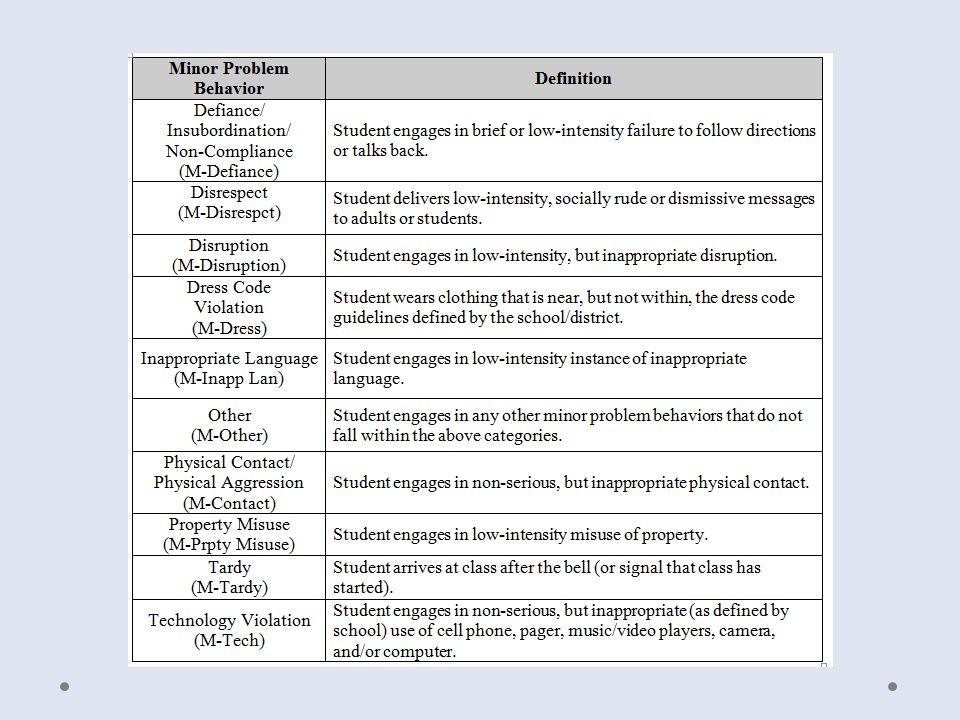
Office Discipline Referrals. Ensure operational definitions Clarify standard for “Staff Managed” versus “Office Managed” Clarify “minor” and “major” See: Irvin, L., Tobin T., Sprague, J., Sugai, G., & Vincent, C., (2004) Validity of Office Discipline Referral Measures as Indices of School-wide Behavioral Interventions. Journal of Positive Behavior Interventions. 6 (3) Operationally defined; Staff receive training; Separation of minor from major; Designation of behaviors referred to the office versus managed in class. Data Sources District School Information System (e.g. Synergy, PowerSchool, AERIES, Skyward) School-based Data Decision Systems: Review 360, Educator’s Handbook, School-wide Information System (SWIS)
 Validity of Office Discipline Referral Measures as Indices of School-wide Behavioral Interventions. Journal of Positive Behavior Interventions. 6 (3) Operationally defined; Staff receive training; Separation of minor from major; Designation of behaviors referred to the office versus managed in class. Data Sources. District School Information System (e.g. Synergy, PowerSchool, AERIES, Skyward) School-based Data Decision Systems: Review 360, Educator’s Handbook, School-wide Information System (SWIS)")
22
Available in “Resources” at www.pbisapps.org

24
Decrease in Major Office Discipline Referrals
Consider “Major” office discipline referrals per 100 students as the comparative metric. Separate by grade level (Elementary, Middle, High) Separate by cohort (Year One adoption, Year Two adoption) Major ODRs per 100 students for School “X “across years 1, 2 and 3 Major ODRs per 100 students National SWIS Median for Elementary
 Separate by cohort (Year One adoption, Year Two adoption) Major ODRs per 100 students for School X across years 1, 2 and 3. Major ODRs per 100 students. National SWIS Median for Elementary.")
25
Available each Aug 15 at www.pbisapps.org
SWIS summary (Majors Only) 4858 schools; 2,476,989 students; 3,054,592 ODRs Grade Range Number of Schools Mean Enrollment per school Mean ODRs per 100 stud/ school day Median ODRs per 100 per stud/ school day 25th Percentile ODR/100/ school day 75th Percentile K-6 3021 450 .31 (.40) .20 .10 .38 6-9 894 613 .48 (.67) .33 .17 .58 9-12 452 817 .57 (1.04) .36 .69 PreK-8 273 418 .39 (.41) .27 .13 .51 PreK-12 76 341 .73 (1.41) .16
 4858 schools; 2,476,989 students; 3,054,592 ODRs. Grade Range. Number of Schools. Mean Enrollment per school. Mean. ODRs per 100 stud/ school day. Median ODRs per 100 per stud/ school day. 25th Percentile. ODR/100/ school day. 75th Percentile. K (.40) (.67) (1.04) PreK (.41) PreK (1.41) .16.")
26
ODR Rates per SCTG School at Time X (compared with SWIS national median)
ODRs per 100 students per school day

27
ODR Rates at Times 1, 2 and 3 for SCTG Schools by Grade Cluster (compared with SWIS national median)
ODR per 100 Students per School Day Elementary n = Middle n = High School n = 5

28
Improved Attendance Rates
Overall Attendance Rates per School Day Define: Proportion of enrolled students with at least .50 day of school? Define: Unexcused versus excused… combined Consider also disaggregating attendance by: Grade Level (Elem, Middle, High) At-risk category Disability English Learner Socio-economic status Ethnicity
 At-risk category. Disability. English Learner. Socio-economic status. Ethnicity.")
29
Attendance Summary For Time period X to Y
Percentage Attending per School Day Unexcused Absences per School Day Excused Absences per School Day Total Absences per School Day Elementary N = X Attending at least .50 day Divided by total attendance per school day Mean Count / Proportion per school day Middle N = Y High School N = z

30
Suspension/ Expulsion
Three elements to Suspension/Expulsion Total number of suspensions/ exp of .50 days or more Number of students suspended/ exp for at least .50 days Number of days suspended / exp. School Suspensions per 100 students per year Students suspended per 100 students per year Days suspended per 100 students per year. School A School B School C School D Summary Mean

31
Suspension/ Expulsions Disaggregated
Suspensions and Expulsions for substance abuse (drugs, alcohol). Consider comparing total Suspension/Expulsion rates with Suspension/ Expulsion rates for substance abuse.
. Consider comparing total Suspension/Expulsion rates with Suspension/ Expulsion rates for substance abuse.")
32
Example: PBIS School Safety Survey
Do High Schools Implementing PBIS Have Lower Rates of Illegal Drug and Alcohol Use? Bastable, E., Kittelman, A., McIntosh, K., & Hoselton, R. – 2015 Example: PBIS School Safety Survey Schools Using PBIS at Criterion Schools NOT using PBIS at Criterion N = n = 18 Staff Rating of “risk” for substance abuse: 0 = none, 1 = minimal, 2 = moderate, 3 = extensive t(41) = ; p = .023; d = .61
 = -2.35; p = .023; d = .61.")
33
Performance Indicators/GPRA: LEA ED Performance Report Form 524B at Number and percentage of schools that report an annual decrease in office disciplinary referrals. Number and percentage of schools that report an annual improvement in the attendance rate. Number and percentage of schools that report an annual decrease in suspensions and expulsions, including those related to possession or use of drugs or alcohol. Number and percentage of schools annually that are implementing the multi-tiered behavioral framework with fidelity.

34
Poll: Rate your confidence in selecting and reporting LEA Evaluation Measures
1= low confidence 5 = high confidence 1. Decrease in Office Discipline Referrals 2. Increase in attendance rate 3. Decrease in suspension and expulsion 4. Decrease in suspension and expulsion for substance abuse (drug, alcohol) 5. Implementation with Fidelity Rob, an example of how I would pull them back to the PIs using DfDM frame. I would assign one person watching the chat box and reporting out what is written.
 5. Implementation with Fidelity. Rob, an example of how I would pull them back to the PIs using DfDM frame. I would assign one person watching the chat box and reporting out what is written.")
35
Performance Indicators/GPRA: SEA
The number of training and technical assistance events provided by the SEA School Climate Transformation Grant Program to assist LEAs in implementing a multi-tiered behavioral framework. The number and percentage of LEAs provided training or technical assistance by the SEA School Climate Transformation Grant Program that report an improvement in knowledge and understanding of the implementation of a multi-tiered behavioral framework. The number and percentage of schools in LEAs provided training or technical assistance by the SEA School Climate Transformation Grant Program that implement a multi-tiered behavioral framework. Rob, Added these here again so people have a reminder of the PIs to complete the activity. Depending on the GTW options, we might be able to set the questions up in a separate pod instead of on the main pwrpt. Then people can see both at the same time.

36
Performance Indicators
1. The number and percentage of schools in LEAs provided training or technical assistance by the SEA School Climate Transformation Grant Program that implement a multi-tiered behavioral framework. Metric Possible Measure Number of schools implementing MTBF within LEAs receiving TA support. Demographic Logs The fidelity of MTBF implementation in schools receiving support (Tier I, Tier II, Tier III) Tiered Fidelity Inventory
 Tiered Fidelity Inventory.")
37
Number of Schools Implementing MTBF Example
Number of Schools in Participating District(s) Number of Schools Implementing Percent of Schools Implementing Elementary 24 10 14 42% 58% Middle 12 6 9 50% 75% High 8 3 4 38%
 Number of Schools Implementing. Percent of Schools Implementing Elementary % 58% Middle % 75% High %")
38
Cumulative Implementing Schools Chart Example
Elementary Middle High

39
Implementation Fidelity Summary Example
Winter 2014 Winter 2015

40
Performance Indicators
2. The number of training and technical assistance events provided by the SEA School Climate Transformation Grant Program to assist LEAs in implementing a multi-tiered behavioral framework. Metric Possible Measure Number and length of training, and TA events Training and TA Logs Perceived value and quality of training and TA events Training and TA Evaluations

41
Training Record Example
Date Training Topic Duration District Schools Number of Participants 1/27/15 School Wide PBIS Day 1- Elementary 1 day Charlton Public Schools Carlton Early Elementary Charlton Upper Elementary 22 2/10/15 School Wide PBIS Day 1- Secondary Alton Community Schools Westview High School Robertson High School 14 2/12/15 Williamsburg Consolidated Schools Pinewood Elementary Hickory Elementary Maple Hill Elementary Sand Lake Elementary 31 TOTALS 3 days 3 Districts 8 Schools 6 Elementary 2 Secondary 67 Participants

42
Training Perception Example
Training Evaluation Form Workshop Title: School Wide PBIS Day 1 Date: 1/27/15 Question Strongly Agree Agree Slightly Agree Disagree Strongly Disagree Today's learning was a valuable use of my time. X 2. I am leaving with tools and strategies to successfully complete the next steps (assignment, communication, activities) that were identified in today's session. 3. The trainer(s) presented the content in such a way that promoted active engagement, opportunities for processing, and time for participants to work together. 4. The pacing and amount of material presented were appropriate for the time allocated.
 that were identified in today s session. 3. The trainer(s) presented the content in such a way that promoted active engagement, opportunities for processing, and time for participants to work together. 4. The pacing and amount of material presented were appropriate for the time allocated.")
43
Training Perception Example

44
Retrospective Self Assessment Example
Instructions: Read the definitions for each skill dimension. Reflect on your current knowledge and practice (as of right now) and your knowledge and practice at the beginning of this training. Read each behavioral statement below the definition and circle the number for each item that best describes your behavior. Please be honest with yourself. 1 = Not Competent/Need More PD = Developing Competence = Competence = Mastery Before Training Question After Training 1 2 3 4 X I can articulate the purpose of implementation team as it relates to the implementation of Positive Behavioral Interventions & Supports (PBIS). 2. I can summarize our building’s data related to office discipline referrals 3. I can create a behavior expectation matrix that define the expectation and examples of each expectation within an identified setting. 4. I can describe the purpose of teaching behavior expectations.
 and your knowledge and practice at the beginning of this training. Read each behavioral statement below the definition and circle the number for each item that best describes your behavior. Please be honest with yourself. 1 = Not Competent/Need More PD 2 = Developing Competence 3 = Competence 4 = Mastery. Before Training. Question. After Training X. I can articulate the purpose of implementation team as it relates to the implementation of Positive Behavioral Interventions & Supports (PBIS). 2. I can summarize our building’s data related to office discipline referrals. 3. I can create a behavior expectation matrix that define the expectation and examples of each expectation within an identified setting. 4. I can describe the purpose of teaching behavior expectations.")
45
Performance Indicators
3. The number and percentage of LEAs provided training or technical assistance by the SEA School Climate Transformation Grant Program that report an improvement in knowledge and understanding of the implementation of a multi-tiered behavioral framework. Metric Possible Measure Number of LEAs (Leadership Teams) receiving TA Training and TA Logs Perceived value and quality of training and TA events Training evaluations
 receiving TA. Training and TA Logs. Perceived value and quality of training and TA events. Training evaluations.")
46
Knowledge and Understanding Example
Participant Knowledge and Understanding Survey Question Strongly Agree Agree Slightly Agree Disagree Strongly Disagree As a result of participating in this project, I have an increased my knowledge of key features of a Multi-Tiered Behavioral Framework X 2. As a result in participating in this project, I have a deeper my understanding of how to effectively implement a Multi-Tiered Behavioral Framework 3. As a result in participating in this project, I feel that our schools can better implement a Multi-Tiered Behavioral Framework.

47
Knowledge and Understanding Annual Survey Example
Increased Knowledge Deeper Understanding Better Implementation

48
Poll: Rate your confidence in selecting and reporting SEA Evaluation Measures
1= low confidence 5 = high confidence 1. Count of LEAs, Schools and Training events 2. Knowledge development at LEA and school team levels 3. Implementation of Multi-tiered behavior support framework with Fidelity Rob, an example of how I would pull them back to the PIs using DfDM frame. I would assign one person watching the chat box and reporting out what is written.

49
Selected Measures State Capacity District Capacity
School Climate (to be addressed in future)
")
50
Possible Measures of SEA/LEA Capacity www.sisep.org
State Capacity Assessment (SCA) Assessment of extent to which state department has capacity to implement evidence-based practices at scales of social significance? No Cost, from OSEP’s SISEP TA-Center Scores: Total, Sub-scale, Item Used for initial assessment, action planning, progress monitoring District Capacity Assessment (DCA) Assessment of extent to which a school district (or region) has capacity to implement evidence-based practices as scales of social significance? No Cost, from OSEP’s SISEP TA-Center Implementers Training Video
 Assessment of extent to which state department has capacity to implement evidence-based practices at scales of social significance No Cost, from OSEP’s SISEP TA-Center Scores: Total, Sub-scale, Item. Used for initial assessment, action planning, progress monitoring. District Capacity Assessment (DCA) Assessment of extent to which a school district (or region) has capacity to implement evidence-based practices as scales of social significance No Cost, from OSEP’s SISEP TA-Center. Implementers Training Video.")
51
Resources Grantees are held accountable for what they submitted.
But some consistency across projects may help all evaluation efforts Resources that may be helpful: Evaluation Blueprint ( PBIS Evaluation Annual Reports ( State and District Capacity Assessments Multi-tiered Fidelity Assessment (Tier I, Tier II, Tier III) Multi-tiered student discipline data systems SWIS, CICO-SWIS, ISIS-SWIS
 Multi-tiered student discipline data systems. SWIS, CICO-SWIS, ISIS-SWIS.")
53
Questions/ Comments Questions: Comments for future webinars:

Similar presentations

 E-12>")


 Metro RIP (Regional Implementation Project) November 6, 2013 Shoreview Community Center T. J. Larson, MAT Barack.>")


>")


 acknowledges.>")

