Download presentation
Presentation is loading. Please wait.

1
EBM --- Journal Reading Presenter :傅斯誠 Date : 2005/10/26

2
Users’ Guides to the Medical Literature Ⅲ. How to Use an Article About a Diagnostic test B. What Are the Results and Will They Help Me in Caring for My Patients ? Roman Jaeschke, MD. MSc; Gordon Guyatt, MD. MSc; David L. Sackett, MD. MSc; for the Evidence-Based Medicine Working Group JAMA; March 2, 1994; 271, 9

3
Clinical Scenario V/Q Lung Scan Prospective Investigation of Pulmonary Diagnosis (PIOPED) Two patients
 Two patients")
4
Clinical Scenario V/Q Lung Scan Prospective Investigation of Pulmonary Diagnosis (PIOPED) Two patients: 78 y/o woman 10 days post-OP
 Two patients: 78 y/o woman 10 days post-OP")
5
Clinical Scenario V/Q Lung Scan Prospective Investigation of Pulmonary Diagnosis (PIOPED) Two patients: 78 y/o woman 10 days post-OP 28 y/o man Chest pain and SOB after 10h road trip
 Two patients: 78 y/o woman 10 days post-OP 28 y/o man Chest pain and SOB after 10h road trip")
6
What are the Results? 1. 有提供 Likelihood ratio 嗎 ? 有辦法計算出 Likelihood ratio 嗎 ?

7
What are the Results? 1. 有提供 Likelihood ratio 嗎 ? 有辦法計算出 Likelihood ratio 嗎 ? 什麼是 Likelihood Ratio?

8
What are the Results? Pretest Test Posttest “Pretest Probability” “Pretest Probability” baseline “Test” History Physical Examination Image studies “Likelihood ratio” Property of the test >> “Likelihood ratio”

9
What are the Results? Pretest Probability Probability of patient with target disorder But… Properties of Hx and PE inavailable Some test properties depend on experience Varying estimates of pretest probability

10
What are the Results? More studies 做最好與最壞的打算 Does this alter decision making? Ask for comments Try to determine pretest probability

11
What are the Results? Likelihood Ratio Accuracy of determining target disorder Test (+) with disease / Test (+) without disease
 with disease / Test (+) without disease.")
12
Table 2 Calculating Likelihood Ratio

13
Table 2 Calculating Likelihood Ratio

14
Table 2 Calculating Likelihood Ratio

15
Table 2 Calculating Likelihood Ratio

16
Table 2 Calculating Likelihood Ratio

17
What are the Results? Likelihood Ratios LR=1 No change in probability LR>1 Increase probability >10 Good! LR<1 Decrease probability >0.1 Good!

18
What are the Results? How do we use Likelihood ratios? Fagan Nomogram!

19
Fagan Nomogram

21
98%

22
Table 3

26
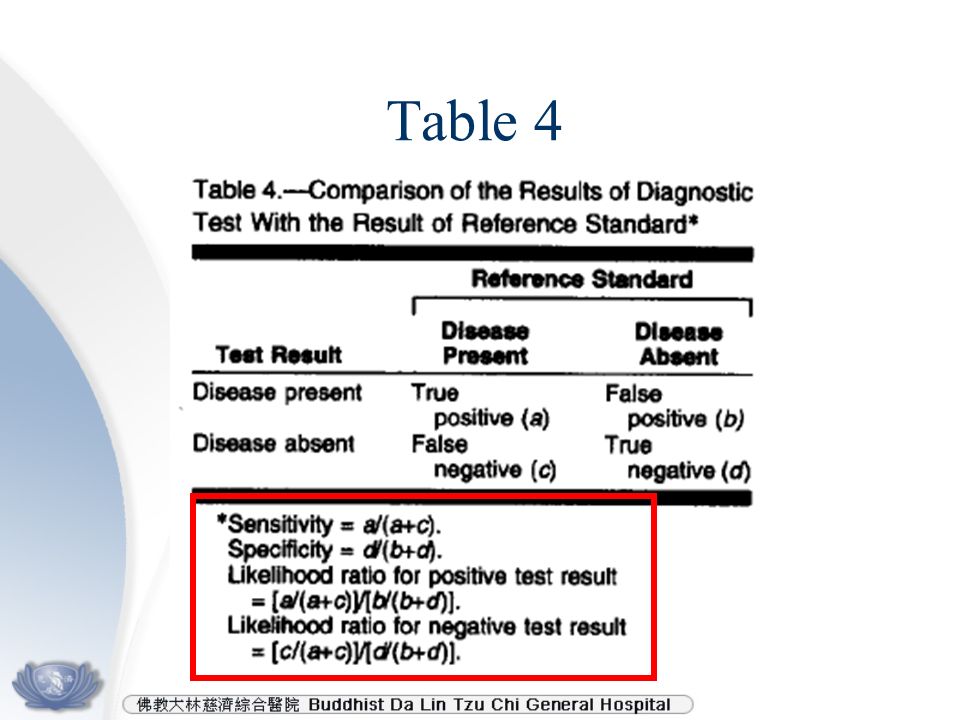
What are the Results? Sensitivity and Specificity Sensitivity = 有病 / Test positive Specificity = 沒病 / Test negative

27
Table 4

30
Table 5

32
Table 6

34
Will the Results Help Me Care for My Patient? 1. Will this test yield same results for me?

35
Will the Results Help Me Care for My Patient? 1. Will this test yield same results for me? Causes for poor reproducibility Test itself Interpretation varies Expertise required

36
Will the Results Help Me Care for My Patient? 1. Will this test yield same results for me? Causes for poor reproducibility Test itself Interpretation varies Expertise required For V/Q scan in PIOPED “Disagreements over intermediate and low- probability scans were 25~30%”

37
Will the Results Help Me Care for My Patient? 2. Are the Results Applicable to My Patient? A. Likelihood Ratio significant

38
Will the Results Help Me Care for My Patient? 2. Are the Results Applicable to My Patient? A. Likelihood Ratio significant B. Study Criteria Inclusion criteria Exclusion criteria

39
Will the Results Help Me Care for My Patient? 2. Are the Results Applicable to My Patient? A. Likelihood Ratio significant B. Study Criteria Inclusion criteria Exclusion criteria “Are there compelling reasons why the results should not be applied to your patients.”

40
Will the Results Change My Management? Begin Treatment Treatment Threshold More Tests Test Threshold No More Tests

41
Will the Results Change My Management? Threshold = ? % Post-test probability

42
Will the Results Change My Management? Threshold = ? % Post-test probability Depends on disease Dangerous disease lower test threshold Example: 80% Treatment threshold 20% Test Threshold

43
Will the Results Change My Management? Threshold = ? % Post-test probability Depends on disease Dangerous disease lower test threshold Example: 80% Treatment threshold 20% Test Threshold Tests with very high or low LR favored! “Proportion moved over the thresholds”

44
Will Patients Be Better Off as a Result of the Test? Not all tests end up helping… Danger of target disorder Test risk acceptable Effective treatment exists

45
Ready to Go? True value of a test Test properties When to apply

46
READY TO GO! True value of a test... Valid? Test properties … LR? Sen/Spe? When to apply … Criteria? Help / Harm?

47
READY TO GO! True value of a test... Valid? Test properties … LR? Sen/Spe? When to apply … Criteria? Help / Harm? Comments?

Similar presentations


 Endocrine and Metabolism.>")