Download presentation
Presentation is loading. Please wait.

2
Jeffrey P Schaefer MSc MD FRCPC April 24, 2009 2 nd Annual Resident Evidence-Based Medicine Workshop Diagnosis

3
Objectives Diagnostics –General Issues –Gold Standard –Test Characteristics –Critical Appraisal

5
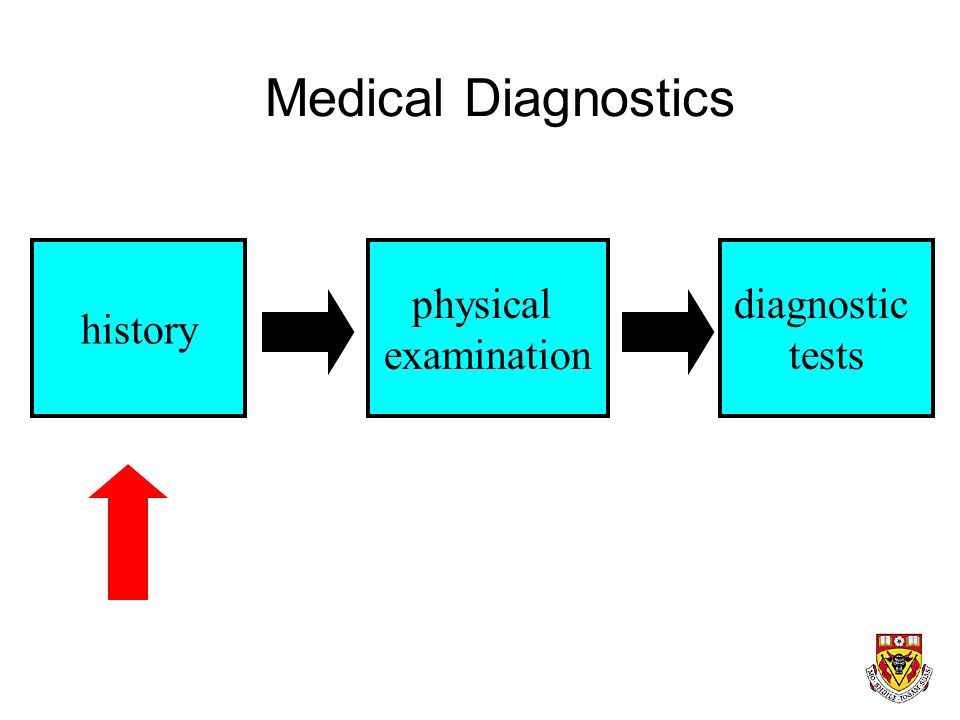
Medical Diagnostics history diagnostic tests physical examination

6
Medical Diagnostics general process history diagnostic tests physical examination

7
Medical Diagnostics general process history diagnostic tests physical examination

8
Diagnostic Testing Advantages –can assess parameters beyond the 5 senses –can be more ‘objective’ than clinical data Disadvantages –test results can be incorrect –test results may lead you in the wrong direction –tests cost money –tests may confer risk –some diseases have no diagnostic test

9
Issues in Diagnostic Testing Risk –urine sample versus brain biopsy versus autopsy Cost –glucoscan strip ~ $1.00 versus MRI $1,000.00 Availability –hemogram versus Positive Emission Tomogram Patient Acceptability –urine sample versus 3 day fecal fat collection

11
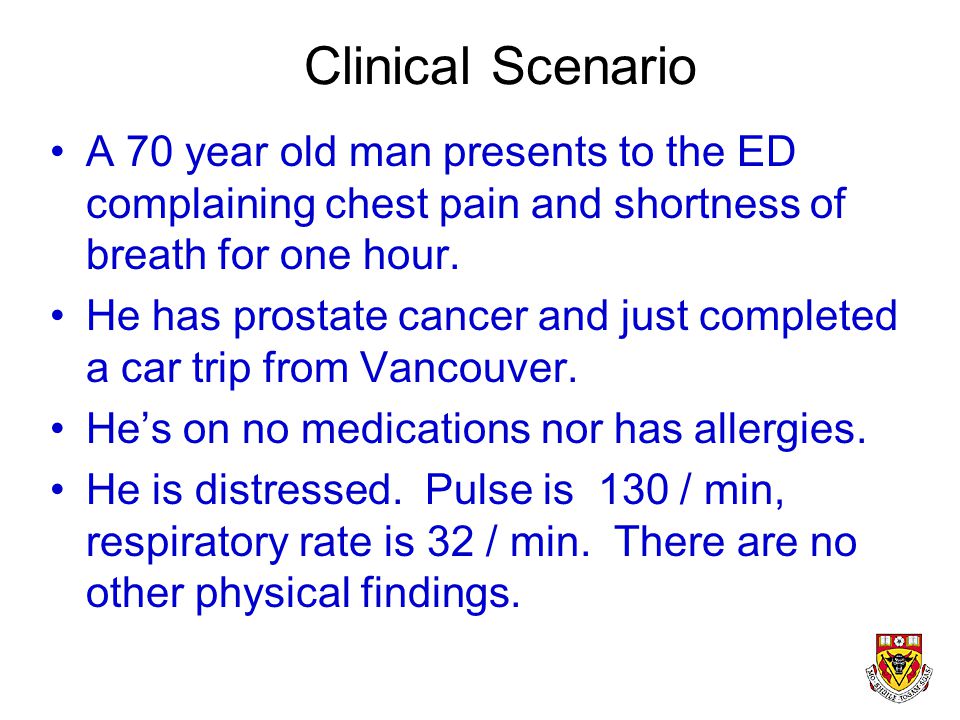
Clinical Scenario A 70 year old man presents to the ED complaining chest pain and shortness of breath for one hour. He has prostate cancer and just completed a car trip from Vancouver. He’s on no medications nor has allergies. He is distressed. Pulse is 130 / min, respiratory rate is 32 / min. There are no other physical findings.

12
What’s the clinical question? What’s the DIAGNOSIS?

13
What are some causes for this man’s presentation? We need an approach...

14
Sidebar: Approach to Diagnosis JP Schaefer’s classification scheme…. –7 approaches

15
1. Epidemiological Approach What’s common in this clinical setting? –Right Lower Quadrant Pain: 18 year old male –Right Lower Quadrant Pain: 80 year old appendicitis cecal carcinoma

16
2. Physiological Approach What pathophysiology is causing the condition? Hypoxemia –shunt –v/q mismatch –alveolar hypoventilation –decreased pAO2 –increased diffusion gradient –(low mixed venous oxygen pressure)
.")
17
3. Anatomical Approach Where is the problem? Chest Pain –skin: shingles –muscle: strain / injury / nail gun –rib / spine: fracture / tumor –lung / pleura: pneumonia, embolism –heart / pericardium: angina / pericarditis –esophagus: spasm / tumor

18
4. Pathological Approach What pathology is involved? Left sided weakness –brain tumor (slow) –stroke (fast) –multiple sclerosis (recurrent)
 –stroke (fast) –multiple sclerosis (recurrent).")
19
5. Pattern Recognition What’s this? –have you seen this before? (Herpes simplex labialis secondary to HSV Type 1 in an immunocompromised patient)
.")
20
6. Interventional Efficacy Headache –muscle tension –migraine –meningioma –warning bleed of SAH

21
7. No approach Common problem –used to be my method!

22
Back to the case... DDx chest pain and shortness of breath… –epidemiology –anatomy –physiology –pathology –pattern recognition –interventional efficacy

24
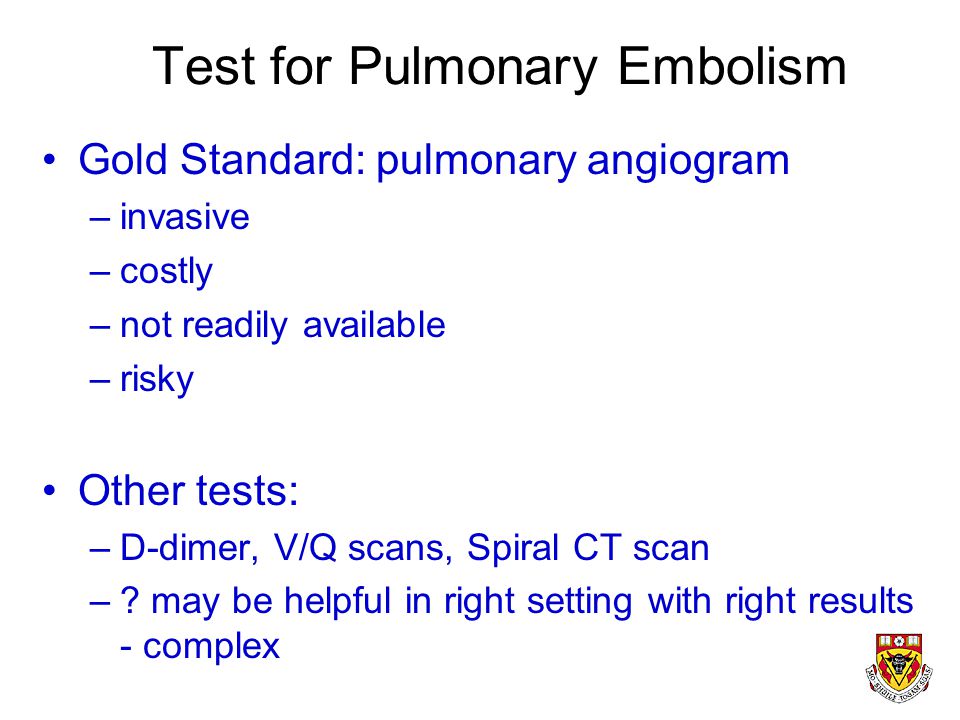
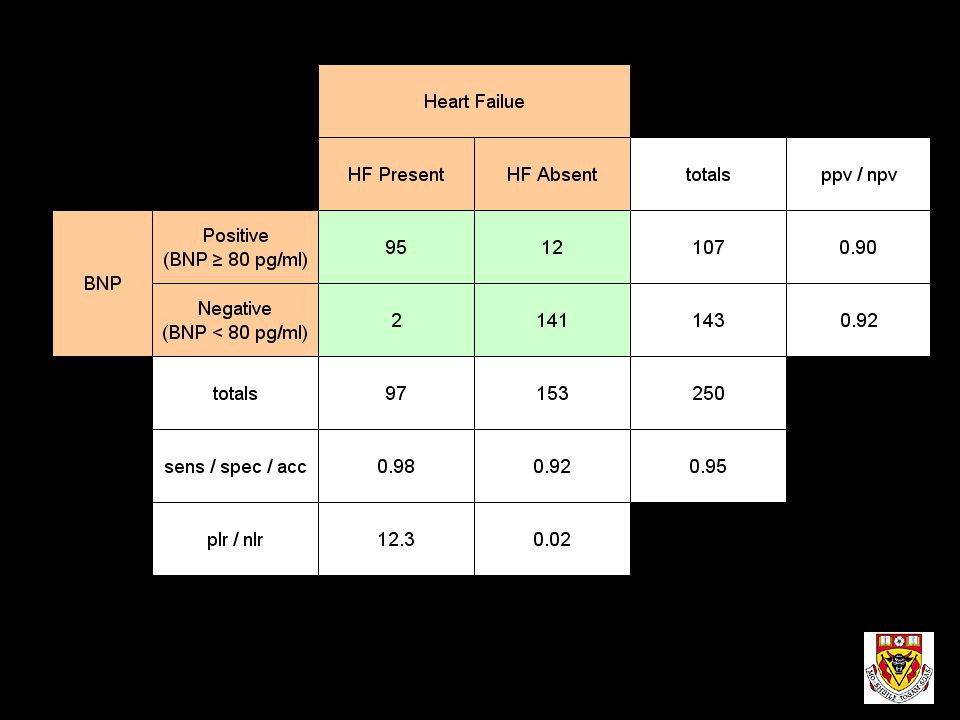
Test for Pulmonary Embolism Gold Standard: pulmonary angiogram –invasive –costly –not readily available –risky Other tests: –D-dimer, V/Q scans, Spiral CT scan –? may be helpful in right setting with right results - complex

25
PE - diagnosis Pulmonary angiogram - gold standard

26
PE - diagnosis (spiral CT scan)
")
27
PE - diagnosis (V/Q scan) high probability V/Q scan (2 defects)
 high probability V/Q scan (2 defects)")
28
Pulmonary Thromboembolism

29
How well does the test perform? Welcome to the world of TEST CHARACTERISTICS

30
Take a deep breath...

31
Test Characteristics Sensitivity Specificity Positive predictive value Negative predictive value Accuracy Positive Likelihood ratio Negative Likelihood ratio

33
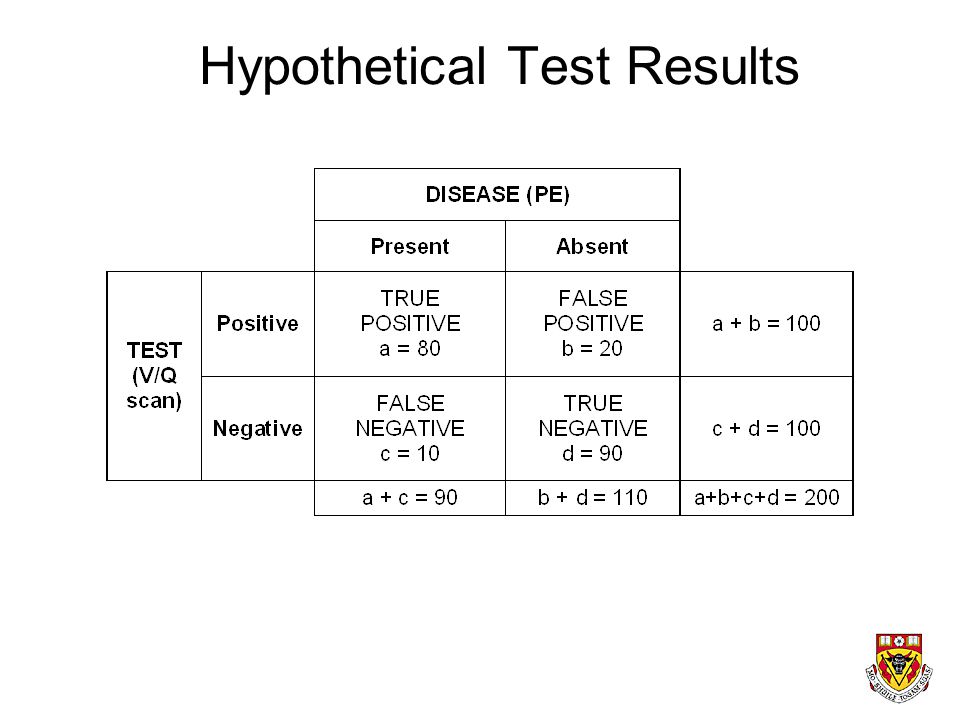
Hypothetical Test Results

34
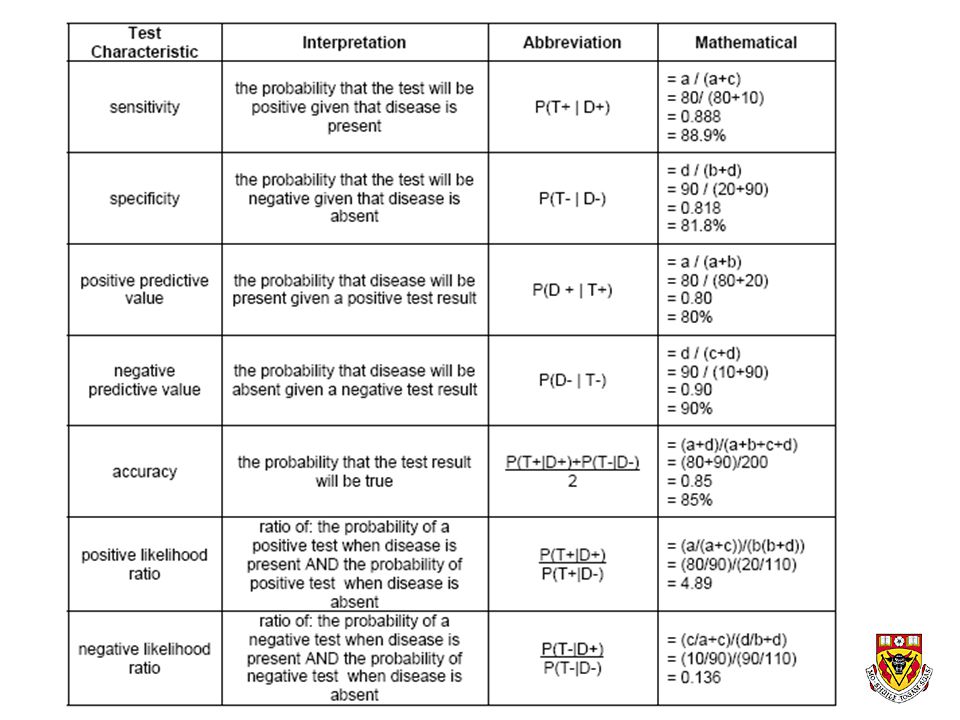
Sensitivity Probability that test is positive given that disease is present. P (T+ | D+)
")
35
Sensitivity 80 / (80 + 10) = 88.9%
 = 88.9%")
36
Specificity Probability that test is negative given that disease is absent. P (T- | D-)
")
37
Specificity 90 / (90 + 20) = 81.8%
 = 81.8%")
38
Sensitivity - Specificity Trade-Off Most test results are not positive or negative. There is often a selected value –over which a test is said to be positive –under which a test is said to be negative. As a result…. –increasing sensitivity results in loss of specificity –increasing specificity results in loss of sensitivity

39
Sensitivity / Specificity Trade-off Sensitivity Decreases Specificity Increases

41
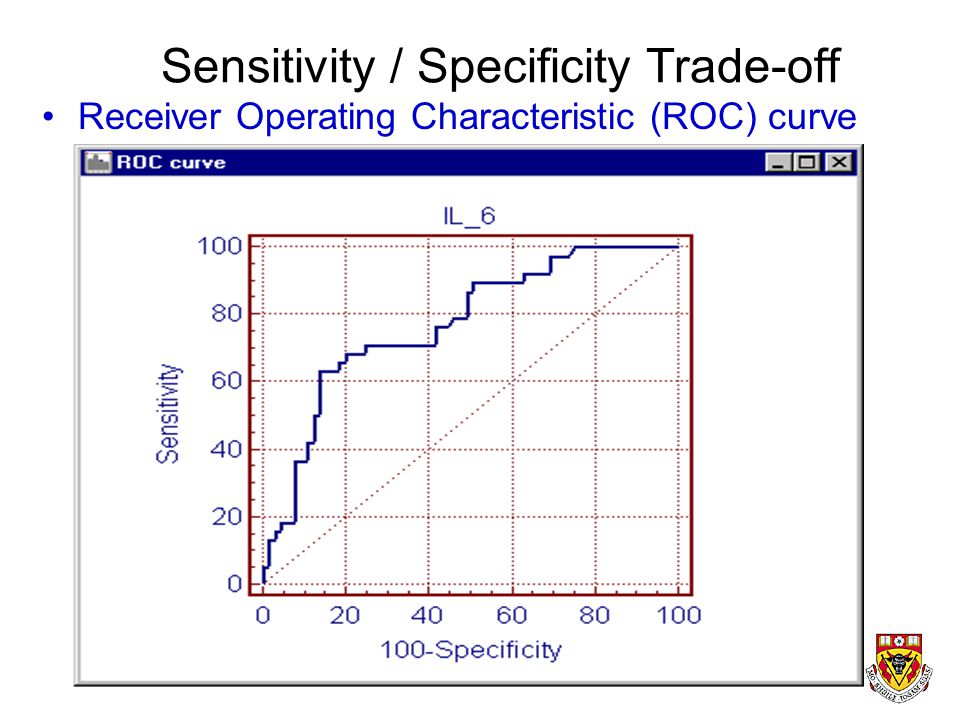
Sensitivity / Specificity Trade-off Receiver Operating Characteristic (ROC) curve
 curve")
42
Test Characteristic Issues Highly Sensitive Tests: –tend to be less invasive, less risky, less costly –best for screening programs –best for ruling out disease: “SNOUT”

43
Test Characteristic Issues Highly Specific Tests: –tend to be more invasive, more risky, more costly –best for confirming (ruling in) disease: “SPIN”
 disease: SPIN")
44
Positive Predictive Value Probability that disease is present given that the test was positive. P (D+ | T+)
.")
45
Positive Predictive Value 80 / (80 + 20) = 80.0%
 = 80.0%")
46
Negative Predictive Value Probability that disease is absent given that the test was negative. P (D- | T-)
.")
47
Negative Predictive Value 90 / (90 + 10) = 90.0%
 = 90.0%")
48
Test Characteristic Issues Positive and Negative Predictive Values suffer from depending on disease prevalence This is a major drawback.* (* excellent exam question)
")
49
Change Disease Prevalence from 90 to 110 per 200 prevalence = 110 / 200 = 0.55 = 55% (was 45%) sensitivity = 97.7 / 110 = 88.8% (unchanged) specificity = 73.6 / 90 = 81.7% (unchanged) positive predictive value = 86.5% (was 80%) negative predictive value = 85.8% (was 90%)
 sensitivity = 97.7 / 110 = 88.8% (unchanged) specificity = 73.6 / 90 = 81.7% (unchanged) positive predictive value = 86.5% (was 80%) negative predictive value = 85.8% (was 90%)")
50
Accuracy Probability that the test is true. (not a useful concept as you’ll see later)
")
51
Accuracy (80+90) / (80+ 20 + 10 + 90) = 85.0%
 / ( ) = 85.0%")
52
Test Characteristic Issues Accuracy: –not useful characteristic –high sensitivity / low specificity test may have same accuracy as low sensitivity / high specifity test

53
(positive) Likelihood Ratio Ratio of: probability of positive test when disease is present -------------------------------------------------------------------- probability of positive test when disease is absent
 Likelihood Ratio Ratio of: probability of positive test when disease is present probability of positive test when disease is absent")
54
Positive Likelihood Ratio (80 / 90) / (20 / 110) = 4.89
 / (20 / 110) = 4.89")
55
Utility of (Positive) Likelihood Ratios expresses how many times more likely a test result is to be found in diseased, compared to nondiseased, people. can estimate the post-test probability of disease if prevalence is known.

56
Pre-test Probability of Disease Consider: a female presents for a screening breast mammogram for breast cancer. What’s her pre-test probability of disease? Prevalence of Disease

57
Positive Test Result Say that her mammogram show her to have a 1 cm spiculated calcification Say that this finding is associated with a likelihood ratio of 20 (a very suspicious lesion).
.")
58
Highly suspicious lesion

59
What is the post-test probability of disease? Answer: Pretest odds x Likelihood Ratio = Posttest odds (the use of odds ratios makes the math convoluted)
.")
60
What is the post-test probability of disease? Pretest odds x Likelihood Ratio = Posttest odds Assume: prevalence = 10 / 1000 = 1% = P(0.01) Odds = probability of event / (1 - probability of event) Pre-test Odds = (10/1000) / (1 - (10/1000)) = 0.0101
 Odds = probability of event / (1 - probability of event) Pre-test Odds = (10/1000) / (1 - (10/1000)) =")
61
What is the post-test probability of disease? Pretest odds x Likelihood Ratio = Posttest odds 0.0101 x 20 = 0.2020 Probability = Odds / (1 + Odds) Posttest Probability = 0.2020 / (1 + 0.2020) Posttest Probability = 0.167 = 16.7%
 Posttest Probability = / ( ) Posttest Probability = = 16.7%.")
62
Utility of (Positive) Likelihood Ratio Pre-test Probability = 1% Post-test Probability = 16.7% Prudent Course: move from screening test to confirmatory test!
 Likelihood Ratio Pre-test Probability = 1% Post-test Probability = 16.7% Prudent Course: move from screening test to confirmatory test!")
65
Critical Appraisal Articles about Diagnosis Are the results in the study valid? What are the results? Will the results help care for my patients?

66
Validity 1.Was there an independent, blind comparison with a reference standard? 2.Did the patient sample include an appropriate spectrum of patients to whom the diagnostic test will be applied in clinical practice? 3.Did the results of the test being evaluated influence the decision to perform the reference standard? 4.Were the methods for performing the test described in sufficient detail to permit replication?

67
Results Are likelihood ratios for the test results presented or data necessary for their calculation provided?

71
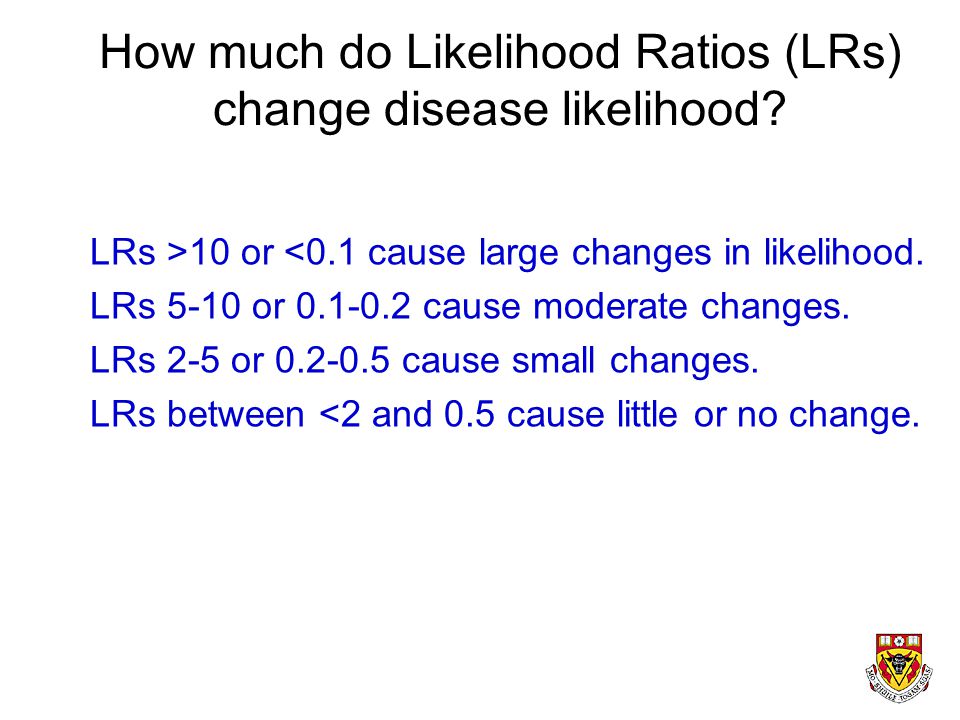
How much do Likelihood Ratios (LRs) change disease likelihood? LRs >10 or <0.1 cause large changes in likelihood. LRs 5-10 or 0.1-0.2 cause moderate changes. LRs 2-5 or 0.2-0.5 cause small changes. LRs between <2 and 0.5 cause little or no change.

72
Applicability Will the reproducibility of the test result and its interpretation be satisfactory in my setting? Are the results applicable to my patient? Will the results change my management? Will patients be better off as a result of the test?

73
Volume 292 January 2, 1975 Number 1 Immunoblastic lymphadenopathy. A hyperimmune entity resembling Hodgkin's disease Immunoblastic lymphadenopathy with mixed cryoglobulinemia. A detailed case study Vinyl-chloride-induced liver disease. From idiopathic portal hypertension (Banti's syndrome) to Angiosarcomas Hodgkin's Disease, tonsillectomy and family size Reduction of ischemic injury by nitroglycerin during acute myocardial infarction (no abstract available) Frederick Stohlman, Jr., M.D
 to Angiosarcomas Hodgkin s Disease, tonsillectomy and family size Reduction of ischemic injury by nitroglycerin during acute myocardial infarction (no abstract available) Frederick Stohlman, Jr., M.D.")
74
TREATMENT EFFECT

Similar presentations

 Director of Evidence-Based Practice, Quality Management Assistant Professor,>")


 Director of Evidence-Based Practice, Quality Management.>")


