Download presentation
Presentation is loading. Please wait.

1
EBMRC How to Use an Article About a Diagnostic Test Akbar Soltani. MD, Endocrinologist Tehran University of Medical Sciences (TUMS) Endocrine and Metabolism Research Center (EMRC) Evidence-Based Medicine Research Center (EBMRC) Shariati Hospital www.soltaniebm.com www.ebm.ir www.avincennact.ir
 Endocrine and Metabolism Research Center (EMRC) Evidence-Based Medicine Research Center (EBMRC) Shariati Hospital")
2
EBMRC OBJECTIVES Objectives of testing Diagnostic research Critical appraisal Summary

3
EBMRC 2/3 legal claims against GPs in UK 40,000-80,000 US hospital deaths from misdiagnosis per year Adverse events, negligence cases, serious disability more likely to be related to misdiagnosis than drug errors Diagnosis uses <5% of hospital costs, but influences 60% of decision making

4
EBMRC Evaluation of diagnostic procedures Unlike with drugs, there are generally no formal requirements for adoption of diagnostic tests in routine care. The methodology of diagnostic research is poorly defined so it is not surprising that methodological flaws are common in diagnostic studies. Furthermore, research funds rarely cover diagnostic research starting from symptoms or tests.

5
EBMRC Objectives of testing Increasing certainty of the presence or absence of disease This requires sufficient discriminative power. 2×2 table relating test outcome to a reference standard.

6
EBMRC Objectives of testing Supporting clinical management Determining localization, and shape of arterial lesions is necessary for treatment decisions

7
EBMRC Objectives of testing Assessing prognosis As the starting point for clinical follow up and informing patients. Monitoring clinical course When a disease is untreated, or during or after treatment. Measuring fitness For example, for sporting activity or for employment.

8
EBMRC OBJECTIVES Objectives of testing Diagnostic research Critical appraisal Summary

9
EBMRC Diagnostic accuracy Options: Cross sectional studies (the most valid study)
")
10
EBMRC Impact of diagnostic test on prognosis or management Options: Best evaluated in a randomised controlled trial Cohort study Case-control study Before and after study

11
EBMRC Determining the most (cost) effective diagnostic strategy Options: Clinical decision analysis Cost effectiveness analysis
 effective diagnostic strategy Options: Clinical decision analysis Cost effectiveness analysis")
12
EBMRC OBJECTIVES Objectives of testing Diagnostic research Critical appraisal Summary

13
EBMRC Evidence Based Approach How to Use an Article About a Diagnostic Test

14
EBMRC Appraising diagnostic tests: 3 easy steps 1. Are the results valid? 2. What are the results? 3. How Can the Results be Applied to Patient Care?

15
EBMRC Some definitions True positive A False positive B False negative C True negative D Disease PresentAbsent Positive Negative Test Result Sensitivity = A / (A+C) Specificity = D / (B+D)
 Specificity = D / (B+D)")
16
EBMRC Number of animals Measurement Diagnostic tests use an arbitrary cut-off to separate two populations (normal vs. abnormal) Population A Population B
 Population A Population B.")
17
EBMRC Number of animals Measurement Diagnostic tests use an arbitrary cut-off to separate two populations (normal vs. abnormal) Population A Population B
 Population A Population B.")
18
EBMRC Number of animals Measurement Diagnostic tests use an arbitrary cut-off to separate two populations (normal vs. abnormal) Population A Population B
 Population A Population B.")
19
EBMRC Number of animals Measurement Diagnostic tests use an arbitrary cut-off to separate two populations (normal vs. abnormal) Population A Population B
 Population A Population B.")
20
EBMRC Diagnostic tests use an arbitrary cut-off to separate two populations (normal vs. abnormal) Number Measurement Where cut-off is placed determines sensitivity and specificity
 Number Measurement Where cut-off is placed determines sensitivity and specificity.")
21
EBMRC Diagnostic tests use an arbitrary cut-off to separate two populations (normal vs. abnormal) Number Measurement Where cut-off is placed determines sensitivity and specificity Normal Abnormal Few False Negatives High Sensitivity - result + result
 Number Measurement Where cut-off is placed determines sensitivity and specificity Normal Abnormal Few False Negatives High Sensitivity - result + result.")
22
EBMRC Diagnostic tests use an arbitrary cut-off to separate two populations (normal vs. abnormal) Number Measurement Where cut-off is placed determines sensitivity and specificity Normal Abnormal Few False Positives High Specificity - result + result
 Number Measurement Where cut-off is placed determines sensitivity and specificity Normal Abnormal Few False Positives High Specificity - result + result.")
23
EBMRC Diagnostic tests use an arbitrary cut-off to separate two populations (normal vs. abnormal) Number Measurement Where cut-off is placed determines sensitivity and specificity Normal Abnormal Trade off between False – and False + - result + result
 Number Measurement Where cut-off is placed determines sensitivity and specificity Normal Abnormal Trade off between False – and False + - result + result.")
24
EBMRC Diagnostic tests use an arbitrary cut-off to separate two populations (normal vs. abnormal) Number Measurement Test with High Sensitivity Normal Abnormal A negative result allows you to rule-out whatever you are testing - result + result SnNout
 Number Measurement Test with High Sensitivity Normal Abnormal A negative result allows you to rule-out whatever you are testing - result + result SnNout.")
25
EBMRC Diagnostic tests use an arbitrary cut-off to separate two populations (normal vs. abnormal) Number Measurement Test with High Specificity Normal Abnormal A positive result allows you to rule-in whatever you are testing - result + result SpPin
 Number Measurement Test with High Specificity Normal Abnormal A positive result allows you to rule-in whatever you are testing - result + result SpPin.")
26
EBMRC Diagnostic Tests Sensitivity and specificity are inversely related Sensitivity and specificity are properties of the diagnostic test and tell us if the test is valid Test sensitivity and specificity have little effect on the confidence a veterinarian has in an individual result.

27
EBMRC Because … Number Measurement My illustration is not consistent with true disease dynamics in a population (the real world)
")
28
EBMRC Number Measurement Because … My illustration is not consistent with true disease dynamics in a population (the real world)
")
29
EBMRC Tip….. Sensitivity is useful to me – ‘The new rapid chlamydia test was positive in 47 out of 56 women with chlamydia (sensitivity =83.9%)’ Specificity seems a bit confusing! – ‘The new rapid chlamydia test was negative in 600 of the 607 women who did not have chlamydia (specificity = 98.8%)’ So…the false positive rate is sometimes easier – False positive rate = 1 – specificity – So a specificity of 98.8% means that the new rapid test is wrong (or falsely positive) in 1.2% of women
’ Specificity seems a bit confusing. – ‘The new rapid chlamydia test was negative in 600 of the 607 women who did not have chlamydia (specificity = 98.8%)’ So…the false positive rate is sometimes easier – False positive rate = 1 – specificity – So a specificity of 98.8% means that the new rapid test is wrong (or falsely positive) in 1.2% of women.")
30
EBMRC Some definitions True positive A False positive B False negative C True negative D Disease PresentAbsent Positive Negative Test Result PPV = A / (A+B) NPV = D / (C+D) Sen*prevalence Sen*prev+(1-Spec) *(1-prev) Spec*(1-prev) (1-Sen)*prev+ Spec*(1-prev)
 NPV = D / (C+D) Sen*prevalence Sen*prev+(1-Spec) *(1-prev) Spec*(1-prev) (1-Sen)*prev+ Spec*(1-prev)")
31
EBMRC Series of patients Index test Reference (“gold”) standard Compare the results of the index test with the reference standard, blinded Basic structure of diagnostic studies
 standard Compare the results of the index test with the reference standard, blinded Basic structure of diagnostic studies")
32
EBMRC Appraising diagnostic tests: 3 easy steps 1. Are the results valid? 2. What are the results? 3. How Can the Results be Applied to Patient Care?

33
EBMRC What were the key selection (inclusion & exclusion) criteria? Were they replicable? List important selection criteria; e.g. age group, gender, risk profile, medical history. There should be sufficient information in the paper to allow the reader to theoretically select a similar population

34
EBMRC Selection bias Selection bias is likely if inclusion in a study is related to test results. As subjects with abnormal Exercise Test are more often referred for angiography. Higher sensitivity and lower specificity

35
EBMRC Did selection lead to an appropriate spectrum of participants (like those assessed in practice) Participants with the range of common presentations of the target disorder and with commonly confused diagnosis
 Participants with the range of common presentations of the target disorder and with commonly confused diagnosis")
36
EBMRC Phase I questions Do test results in patients with the target disorder differ from those in normal people? Samples from normal controls and from patients who had various combinations of hypertension, ventricular hypertrophy, and left ventricular dysfunction. (

37
EBMRC Do test results in patients with the target disorder differ from those in normal people? They found large differences in median concentrations of ANP precursors between the two groups, and no overlap between the ranges

38
EBMRC Phase I questions Such studies add to our biological insights into mechanisms of disease, and they may serve later research into treatment as well as diagnosis

39
EBMRC

40
Phase I questions Spectrum bias Workup bias Low sample size Rare disease

41
EBMRC Phase II questions Are patients with certain test results more likely to have the target disorder than patients with other test results? For example, a second group of investigator measured ANP in normal controls and in three groups of patients with coronary artery disease and varying degrees of left ventricular dysfunction cut-off point ?

42
EBMRC Biostatistics Review Example: Suppose the Prevalence of a particular disease in a population is 10%. (of 1000 people, 100 have the disease) Sensitivity: 90/100 = 90% Specificity: 810/900 = 90% Dz (+)Dz (-) Test(+) 90 Test(-) 10810 100900
 Sensitivity: 90/100 = 90% Specificity: 810/900 = 90% Dz (+)Dz (-) Test(+) 90 Test(-)")
43
EBMRC

44
Phase II questions Authors concluded that “ANP concentrations are good indicators of the severity and prognosis of congestive heart failure!

45
EBMRC Phase III questions Does the test result distinguish patients with and without the target disorder among patients in whom it is clinically reasonable to suspect that the disease is present? Must be prospective Less clinical contrast Larger sample size

46
EBMRC Phase III questions The investigators concluded that ANP would be unlikely to improve the diagnosis of symptomatic LVF in the community.

47
EBMRC

48
Phase 4 :Clinical impact Do patients who undergo this diagnostic test fare better (in their ultimate outcome) than similar patients who are not tested? Also, tests may have no practical benefit: Brain scans showing details of untreatable brain conditions )
.")
49
EBMRC 1. Was an appropriate spectrum of patients included? Spectrum bias You want to find out how good chest X rays are for diagnosing pneumonia in the Emergency Department Best = all patients presenting with difficulty breathing get a chest X-ray Spectrum bias = only those patients in whom you really suspect pneumonia get a chest X ray

50
EBMRC Spectrum bias Studies from referral centers Patients with negative results are less likely to referred

51
EBMRC 2) Did the results of the test being evaluated influence the decision to perform the reference standard? 2. Were all patients subjected to the gold standard? Verification (work-up) bias What was the gold standard of diagnosis? The validity of the study requires that there is an accepted, valid and replicable reference standard of diagnosis.
 bias What was the gold standard of diagnosis. The validity of the study requires that there is an accepted, valid and replicable reference standard of diagnosis..")
52
EBMRC gold standard 1.Laboratory tests (Infectious & endocrine diseases) 2.Imaging (DVT, PTE ) 3.Biopsy (Cancer, vasculitis) 4.Autopsy (neurologic diseases) 5.long-term follow-up (SLE, MS)
 2.Imaging (DVT, PTE ) 3.Biopsy (Cancer, vasculitis) 4.Autopsy (neurologic diseases) 5.long-term follow-up (SLE, MS)")
53
EBMRC 2) Did the results of the test being evaluated influence the decision to perform the reference standard? 2. Were all patients subjected to the gold standard? Verification (work-up) bias You want to find out how good is exercise ECG (“treadmill test”) for identifying patients with angina The gold standard is angiography Best = all patients get angiography Verification (work-up bias) = only patients who have a positive exercise ECG get angiography
 bias You want to find out how good is exercise ECG ( treadmill test ) for identifying patients with angina The gold standard is angiography Best = all patients get angiography Verification (work-up bias) = only patients who have a positive exercise ECG get angiography.")
54
EBMRC You want to find out how good is exercise ECG (“treadmill test”) for identifying patients with angina All patients get the gold standard (angiography) Observer bias = the Cardiologist who does the angiography knows what the exercise ECG showed (not blinded) Another example: The pulmonary nodule on CT, and comparison to CXR 3. Was there an independent, blind or objective comparison with the gold standard? Observer bias

55
EBMRC 4) Were the methods for performing the test described in sufficient detail to permit replication? This description should cover all issues that are important in the preparation of the patient (diet, drugs to be avoided, precautions after the test), the performance of the test (technique, possibility of pain), and the analysis and interpretation of its results.
, the performance of the test (technique, possibility of pain), and the analysis and interpretation of its results..")
56
EBMRC Series of patients Index test Reference (“gold”) standard Compare the results of the index test with the reference standard, blinded Basic structure of diagnostic studies
 standard Compare the results of the index test with the reference standard, blinded Basic structure of diagnostic studies")
57
EBMRC Read this abstract Scan in UTI abstract

58
EBMRC Scan in UTI abstract Index test Series of patients Gold standard Accuracy

59
EBMRC Series of patients Index test Reference (“gold”) standard Compare the results of the index test with the reference standard Women presenting with history of recurrent UTIs Self diagnosis based on symptoms Positive urine culture 172 episodes: Positive urine culture in 144 (84%)
 standard Compare the results of the index test with the reference standard Women presenting with history of recurrent UTIs Self diagnosis based on symptoms Positive urine culture 172 episodes: Positive urine culture in 144 (84%)")
60
EBMRC Levels of evidence 1.An independent, masked comparison with reference standard among an appropriate population of consecutive patients. 2.An independent, masked comparison with reference standard among nonconsecutive patients or confined to a narrow population of study patients. 3.An independent, masked comparison with an appropriate population of patients, but reference standard not applied to all study patients 4.Reference standard not applied independently or masked 5. Expert opinion with no explicit critical appraisal, based on physiology, bench research, or first principles. a.s

61
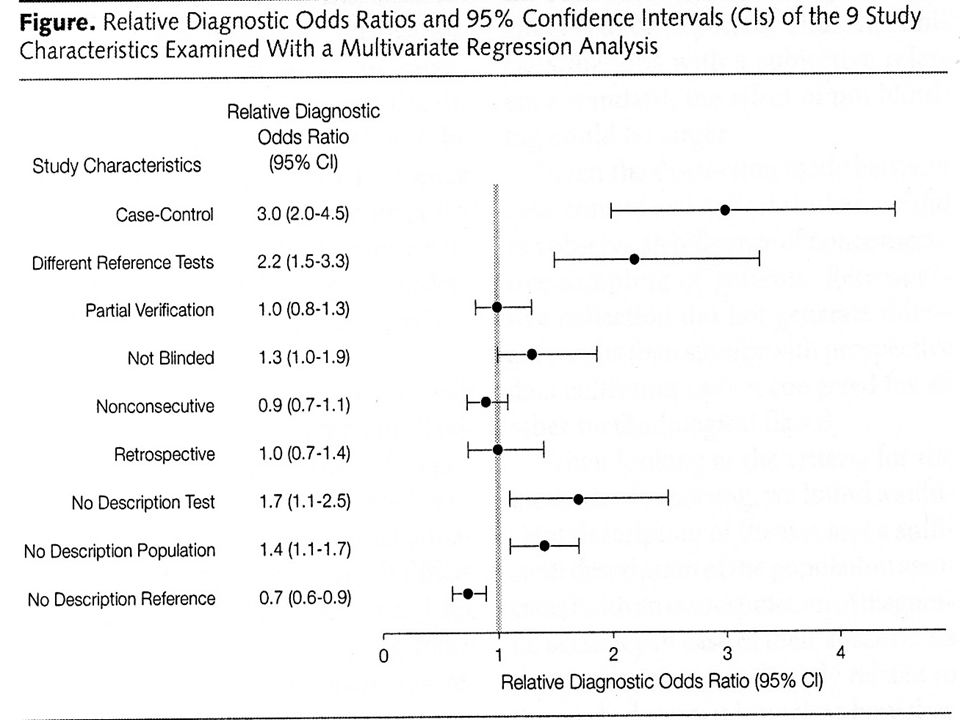
EBMRC Do reports meet the standards? Between 1978 and 1993 the authors found 112 articles, predominantly in radiological tests and immunoassays. Few of the standards were met consistently - ranging from 46% avoiding workup bias down to 9% reporting accuracy in subgroups.

62
EBMRC

65
Appraising diagnostic tests: 3 easy steps 1. Are the results valid? 2. What are the results? 3. How Can the Results be Applied to Patient Care?

66
EBMRC What are the Results? Biostatistics Review Sensitivity : Of all the people with a particular disease, the proportion who will test positive for it (PID) Specificity : Of all the people without the disease, the proportion who will test negative for it (NIH) A gold standard diagnosis is already known, (presumably without error). The above terms are describing the properties of a particular TEST.
 Specificity : Of all the people without the disease, the proportion who will test negative for it (NIH) A gold standard diagnosis is already known, (presumably without error). The above terms are describing the properties of a particular TEST..")
67
EBMRC What are the Results? Biostatistics Review Example: Suppose the Prevalence of a particular disease in a population is 10%. (of 1000 people, 100 have the disease) Sensitivity: 90/100 = 90% Specificity: 810/900 = 90% Dz (+)Dz (-) Test(+) 90 Test(-) 10810 100900
 Sensitivity: 90/100 = 90% Specificity: 810/900 = 90% Dz (+)Dz (-) Test(+) 90 Test(-)")
68
EBMRC What are the Results? Biostatistics Review Positive Predictive Value : Of all the people who tested positive for a disease, the proportion that actually has it Negative Predictive Value : Of all the people who tested negative for a disease, the proportion that actually does not have it In these patients, what you know are their test results, from which you are trying to determine whether they actually have the disease.

69
EBMRC What are the Results? Biostatistics Review Same example: Prevalence of a particular disease in the population is 10%. PPV: 90/180= 50% NPV: 810/820 = 99% Dz (+)Dz (-) Test(+) 90 180 Test(-) 10810820 Sens: 540/600 = 90% Spec: 360/400 = 90%
Dz (-) Test(+) Test(-) Sens: 540/600 = 90% Spec: 360/400 = 90%.")
70
EBMRC What are the Results? Note: The PPV and NPV of a test are DEPENDENT on prevalence. Suppose the Disease Prevalence is 60% Sens: 540/600 = 90% Spec: 360/400 = 90% PPV: 540/580 = 93% NPV: 360/420 = 86% Dz (+)Dz (-) Test(+) 540 40580 Test(-) 60360420 600400
Dz (-) Test(+) Test(-)")
71
EBMRC What are the Results? The use of PPV and NPV when describing a diagnostic test has several drawbacks: 1.They are dependent on the prevalence of disease 2.The prevalence of disease in the general population is not the same as that of the patients you see in clinic/ER. 3.Not all tests have results that can be categorized as “+” or “-”. For these reasons, PPV and NPV may soon be considered “Old School”.

72
EBMRC Relationship Between Prevalence And Predictive Value Based on a test with 90% sensitivity and 82% specificity Difference between PPV and NPV relatively small Difference between PPV and NPV relatively large

73
EBMRC In My Experience! Likelihood of disease and the PPV of diagnostic tests in specialty setting A test with 98% sen &sp Primary care setting p=2% ppv=50% Specialty setting p=30% ppv=95%

74
EBMRC A disease with a prevalence of 4% must be diagnosed. It has a sensitivity of 50% and a specificity of 90%. If the patient tests positive, what is the chance they have the disease? Try it

75
EBMRC Prevalence of 4%, Sensitivity of 50%, Specificity of 90% 4 96 2 9.6 100 11.6 people test positive………. of whom 2 have the disease So, chance of disease is 2/11.6 about 17% Disease +ve Disease -ve Testing +ve Sensitivity = 50% False positive rate = 10%

76
EBMRC Prevalence of 4%, Sensitivity of 50%, Specificity of 90% Doctors with an average of 14 yrs experience ….answers ranged from 1% to 99% ….half of them estimating the probability as 50% Gigerenzer G BMJ 2003;327:741-744

77
EBMRC What are the Results? Likelihood Ratios Simply stated, the Likelihood Ratio is how much more likely someone is to get a positive test result if they have the disease, compared to someone who doesn’t. In fact, the LR is how much more likely someone is to get any particular test result (positive, negative, “intermediate probability, etc) if they have disease, compared to someone who doesn’t.
 if they have disease, compared to someone who doesn’t..")
78
EBMRC What are the Results? From our previous example: The LR is (90/100) / (90/900) = 9.0 This is the LR for a (+) result. Someone with disease is 9 times as likely to test positive than someone without it. Note also that : LR = SENS / 1 - SPEC WOWO Dz (+)Dz (-) Test(+) 90 Test(-) 10810 100900
 / (90/900) = 9.0 This is the LR for a (+) result. Someone with disease is 9 times as likely to test positive than someone without it. Note also that : LR = SENS / 1 - SPEC WOWO Dz (+)Dz (-) Test(+) 90 Test(-)")
79
EBMRC What are the Results? The LR for a negative test is: (10/100) / (810/900) = 0.11 Someone with disease is 0.11 times as likely (1/9) to test negative than someone without it. Dz (+)Dz (-) Test(+) 90 Test(-) 10810 100900
 / (810/900) = 0.11 Someone with disease is 0.11 times as likely (1/9) to test negative than someone without it. Dz (+)Dz (-) Test(+) 90 Test(-)")
80
EBMRC What are the Results? What do all the numbers mean? The Likelihood Ratio tells you by how much a given diagnostic test result will raise or lower the probability of having the disorder. Pretest Probability: the chance that the pt has disease, prior to ordering any tests. This is often an estimation based on clinical experience Posttest Probability: the chance that the pt has disease, given the results of the test

81
EBMRC What are the Results? What do all the numbers mean? A LR of 1.0 means the posttest probability is exactly the same as the pretest probability. A LR >1.0 increases the probability of having the disorder. A LR<1.0 decreases the probability of having the disorder.

82
EBMRC What are the Results? Likelihood ratios >10 or <0.1 generate large changes from pre- to posttest probability and are generally considered significant. Likelihood ratios of 5-10 and 0.1-0.2 generate moderate changes in probability Likelihood ratios of 2-5 and 0.2-0.5 generate small changes Likelihood ratios 0.5-2 usually have little effect

83
EBMRC Relationship Between Prevalence And Predictive Value Based on a test with 75% sensitivity and 93% specificity Prevalence Predictive Value

84
EBMRC Performance of a test with changing prevalence A : Sensitivity = Specificity = 0.9 LR+ = 9.0 B : Sensitivity = Specificity = 0.7 LR+ = 3.0 C : Sensitivity = Specificity = 0.5 LR+ = 1.0 POST-TEST PROBABILITY

85
EBMRC Hyperparathyroidism HIRGH SERUM CA SEN=90% SP=95% PRIOR PROBABILITY WITH RENAL STONE =2% Sen*prevalence/sen*prevalence+(1-sp)(1-prevalence) POSTERIORI=27%
(1-prevalence) POSTERIORI=27%")
86
EBMRC Hyperparathyroidism HIGH SERUM PTH SEN=95% SP=98% PRIOR PROBABILITY=27% Sen*prevalence/sen*prevalence+(1-sp)(1-prevalence) POSTERIORI=94%
(1-prevalence) POSTERIORI=94%")
87
EBMRC

88
What are the Results? What is the pre-test probability? Consider the following patients who present with dyspnea and nonspecific CP. Neither has findings suggestive of pneumonia, obstruction, or CHF 1.A 78yo woman who is 10 days post-surgery 2.A 28yo man experiencing a high level of anxiety

89
EBMRC What are the Results? The level of suspicion (ie the pretest probability) for PE in these two patients is very different. Would you order a V/Q scan or D Dimer? What would you do with the results? What if the results showed “Intermediate probability”?
 for PE in these two patients is very different. Would you order a V/Q scan or D Dimer. What would you do with the results. What if the results showed Intermediate probability .")
90
EBMRC What are the Results? Important: The best predictor of the post-test probability is the pre-test probability. Suppose your suspicion for the 78yo woman for having a PE was 70%. She has a V/Q scan and it shows “High probability”. (Or She has a positive D Dimer test). HOW MUCH does this raise your suspicion that she has PE?
. HOW MUCH does this raise your suspicion that she has PE .")
91
EBMRC What are the Results? In the PIOPED study, Likelihood Ratios were calculated for 4 possible results of a V/Q scan: High probability Intermediate probability Low probability Normal/near normal In this study, V/Q scans were done on the whole spectrum of patients suspected to have PE, NOT on the “general population”. Of 881 patients, 251 had a PE while 630 did not.

92
EBMRC Table 1: Test Properties of V/Q Scanning in the PIOPED study

93
EBMRC What are the Results? So how does one use the LR to calculate the post-test probability? Probabilities (usually reported in %) have to be converted into Odds, then multiplied by the LR, then converted back into a probability. This calculation is not too difficult but can be tedious. An easier way is to use a Likelihood Ratio Nomogram.
 have to be converted into Odds, then multiplied by the LR, then converted back into a probability. This calculation is not too difficult but can be tedious. An easier way is to use a Likelihood Ratio Nomogram..")
94
EBMRC Calculating posttest probability Pretest probability Pretest oddsLikelihood ratioPosttest odds Posttest probability = Test Information

95
EBMRC Likelihood Ratios LR = 18 High Mr. A Pre-Test Prob. 15% Post-Test Prob. 20% Post-Test Probability Pre-Test Probability Mrs. B Pre-Test Prob. 40% Post-Test Prob. 90% LR = 1.2 V/Q Scan Results

96
EBMRC Application: Using Post-test Probability Disease ruled IN Disease ruled OUT Disease not ruled in or out Above this point, treat Below this point, no further testing Determined by: Complications of untreated disease Risks of therapy Complications of tests Cost

97
EBMRC What do likelihood ratios mean? LR>10 = strong positive test result LR<0.1 = strong negative test result LR=1 No diagnostic value

98
EBMRC What do likelihood ratios mean? McGee: Evidence based Physical Diagnosis (Saunders Elsevier)
")
99
EBMRC ? Appendicitis: McBurney tenderness LR+ = 3.4 Pre test 5% % % Bayesian reasoning Fagan nomogram Post test 20%

100
EBMRC Likelihood Ratio And Pre- And Post-test Probabilities For a given test with a given likelihood ratio, the post-test probability will depend on the pre-test probability (that is, the prevalence of the condition in the sample being assessed)
")
101
EBMRC Sensitivity Analysis Of A Diagnostic Test Value95% CI Pre-test probability 35%26% to 44%

102
EBMRC Sensitivity Analysis Of A Diagnostic Test Applying the 95% confidence intervals above to the nomogram, the post- test probability is likely to lie in the range 55-85% Value95% CI Pre-test probability 35%26% to 44% Likelihood ratio 5.03.0 to 8.5

103
EBMRC Appraising diagnostic tests: 3 easy steps 1. Are the results valid? 2. What are the results? 3. How Can the Results be Applied to Patient Care?

104
EBMRC How Can the Results be Applied to Patient Care? Will the results change my management strategy? Always ask yourself the above before ordering a test What is your treatment threshold? What is your threshold for NOT treating? If you find that most patients are having test results with a LR near 1.0, the test is not very useful.

105
EBMRC How Can the Results be Applied to Patient Care? Will patients be better off as a result of the test? Do the benefits of performing the test outweigh the associated risk? If the answer to this is unclear, should a randomized controlled trial be done to determine if the test actually gives any benefit?

106
EBMRC Summary Objectives of testing Diagnostic research Critical appraisal

107
EBMRC THANK YOUTHANK YOU

Similar presentations


 Director of Evidence-Based Practice, Quality Management Assistant Professor,>")

 Director of Evidence-Based Practice, Quality Management.>")


