Download presentation
Presentation is loading. Please wait.

1
Dukakis Center For Urban and Regional Policy Northeastern University School of Public Policy & Urban Affairs www.northeastern.edu/dukakiscenter A “Think and Do” Tank A Glance at the Commonwealth’s Economy and the Region’s Housing Challenge Barry Bluestone NAIOP Breakfast Forum November 19, 2015

2
First, a look at the Massachusetts economy:

3
Dukakis Center for Urban & Regional Policy www.northeastern.edu/dukakiscenter

5
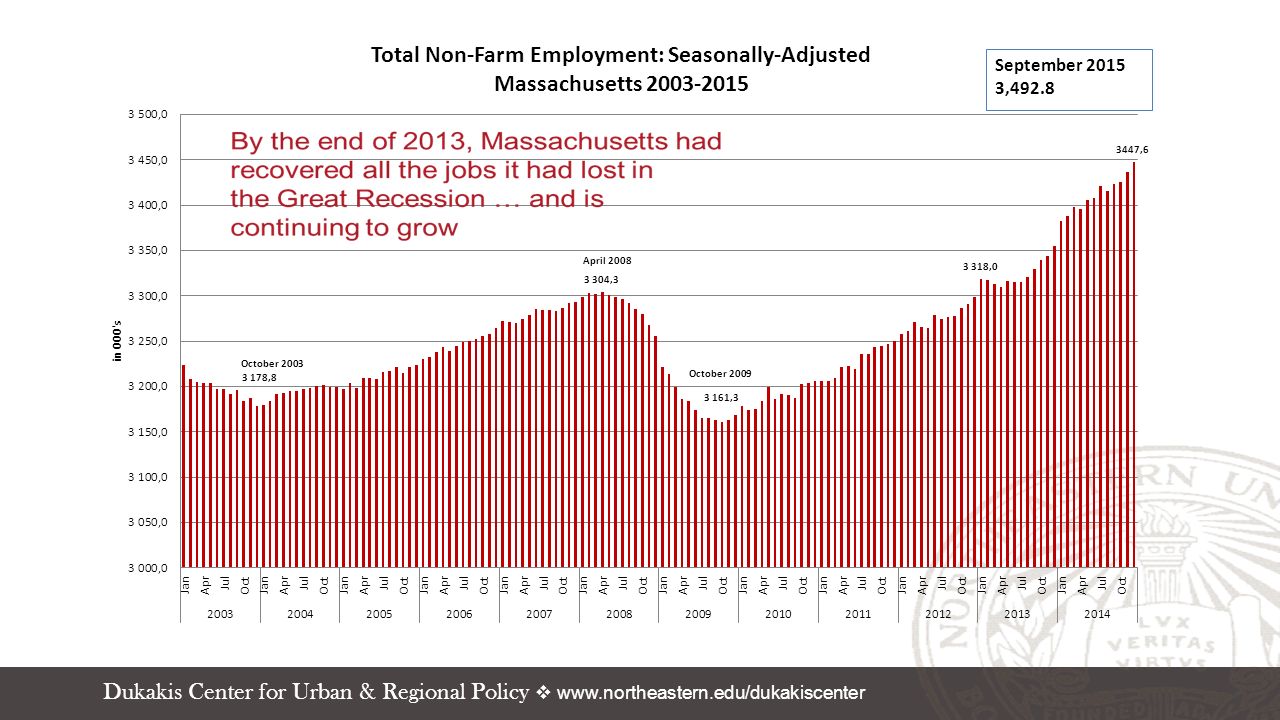
Total Non-Farm Employment Seasonally-Adjusted Massachusetts 2009-2015 (July) Source: Bureau of Labor Statistics Employment Growth 2009 – September 2015: +289,500 Jobs
 Source: Bureau of Labor Statistics Employment Growth 2009 – September 2015: +289,500 Jobs")
6
Dukakis Center for Urban & Regional Policy www.northeastern.edu/dukakiscenter Projected Employment by Sector: 2014-2018

7
Dukakis Center for Urban & Regional Policy www.northeastern.edu/dukakiscenter Massachusetts Civilian Unemployment Rate 2009- 2015 Source: Bureau of Labor Statistics September: 4.6%

8
Dukakis Center for Urban & Regional Policy www.northeastern.edu/dukakiscenter Five County Greater Boston Total Non-Farm Employment 2008-2014 (December) Source: Bureau of Labor Statistics 5-Year Growth: 213,000 additional jobs
 Source: Bureau of Labor Statistics 5-Year Growth: 213,000 additional jobs")
9
Dukakis Center for Urban & Regional Policy www.northeastern.edu/dukakiscenter Real Average Weekly Wage – Private Industry – Massachusetts 2001-2014 (Real 2014 $) Source: Massachusetts Department of Labor – ES202 Data
 Source: Massachusetts Department of Labor – ES202 Data")
10
Some Good News on the New Housing Pipeline

11
Dukakis Center for Urban & Regional Policy www.northeastern.edu/dukakiscenter Total Housing Permits Issued in 5-County Greater Boston Region 2000-2015 Source: U.S. Census Building Permit Survey for Essex, Middlesex, Norfolk, Plymouth, and Suffolk Counties

12
Dukakis Center for Urban & Regional Policy www.northeastern.edu/dukakiscenter Number of Housing Unit Permits in Five-County Greater Boston Region, by Structure Type, 2000-2015 Source: U.S. Census Building Permit Survey for Essex, Middlesex, Norfolk, Plymouth, and Suffolk Counties

13
Dukakis Center for Urban & Regional Policy www.northeastern.edu/dukakiscenter 5+ Unit Housing Permits as a Percent of All Housing Permits in Greater Boston, 2000-2015 Source: U.S. Census Building Permit Survey for Essex, Middlesex, Norfolk, Plymouth, and Suffolk Counties

14
Home Prices Continue to Rise

15
Dukakis Center for Urban & Regional Policy www.northeastern.edu/dukakiscenter Annual Percent Change in Case-Shiller Single-Family House Price Index, Greater Boston Metropolitan Area, 1987-2015 (Est.) Source: Case-Shiller Home Price Index
 Source: Case-Shiller Home Price Index")
16
Dukakis Center for Urban & Regional Policy www.northeastern.edu/dukakiscenter Greater Boston Housing Cycles, 1988-1997 vs. 2005-2015 Case-Shiller Single- Family Home Price Index Months Since Beginning of Price Decline Source: Case-Shiller Home Price Index In 2015 single-family home prices finally -- on average -- reached previous 2005 peak

17
Dukakis Center for Urban & Regional Policy www.northeastern.edu/dukakiscenter Percent Change in Single Family Sales Price 2005-2015 Cambridge+101.2% Boston+ 73.3% Brookline+ 51.8% Newton+ 47.4% Somerville+ 34.7% Lexington+ 32.3% Concord+ 26.9% Watertown+ 24.4% But vast differences depending on where you live

18
Dukakis Center for Urban & Regional Policy www.northeastern.edu/dukakiscenter Percent Change in Single Family Sales Price 2005-2015 Randolph- 24.3% Lawrence- 21.2% Lowell- 16.5% Haverhill- 15.9% Revere- 14.7% East Bridgewater- 14.2% Everett - 12.3% Lynn- 12.1% But vast differences depending on where you live

19
Home Prices Rising; Condo Prices Soaring

20
Dukakis Center for Urban & Regional Policy www.northeastern.edu/dukakiscenter Annual Median Price of Single-Family Homes in Five-County Greater Boston Region, 2000-2013 Source: The Warren Group 2009-2015 +19%

21
Dukakis Center for Urban & Regional Policy www.northeastern.edu/dukakiscenter Annual Median Price of Condominiums in Five- County Greater Boston Region, 2000-2013 Source: The Warren Group

22
Dukakis Center for Urban & Regional Policy www.northeastern.edu/dukakiscenter Ratio of Condominiums to Single-Family Home Prices in Five-County Greater Boston Region, 2000-2013 Source: The Warren Group

23
Dukakis Center for Urban & Regional Policy www.northeastern.edu/dukakiscenter Annual Median Price of Homes in Two-Unit and Three-Unit Structures in Five-County Greater Boston Region, 2000-2015 Source: The Warren Group

24
Rents continuing to soar

25
Dukakis Center for Urban & Regional Policy www.northeastern.edu/dukakiscenter Monthly Rent for Boston Area Apartments, 2 Bedroom Units, 2009 Q:III - 2005 Q:II Source: Rental Jungle

26
With Prices & Rents Rising … Why doesn’t Supply catch up with Demand? The $64,000 Question …

27
With Prices & Rents Rising … Why doesn’t Supply catch up with Demand With a $640,000 Answer! For a 2,300 sq.ft home

28
Cost of Housing Development A brand new analysis of the cost of building Housing - Stick Built on Platform 115 Housing Developments

29
Dukakis Center for Urban & Regional Policy www.northeastern.edu/dukakiscenter

30
Construction Costs$190,000 Land Acquisition$ 49,000 “Soft” Costs$ 35,000 Development Fees$ 23,000 Financing Costs$ 20,000 Site Preparation$ 10,000 TOTAL COSTS$327,000 For a 1,200 Square Foot Urban Project with 30 units – Per Unit Costs

31
Dukakis Center for Urban & Regional Policy www.northeastern.edu/dukakiscenter Ted William’s House 39 Foster St. - Allston-Brighton

32
Dukakis Center for Urban & Regional Policy www.northeastern.edu/dukakiscenter Ted William’s House – 1940’s 39 Foster St. - Allston-Brighton 3,721 Square Ft with 2 bedrooms & a single bath on each floor

33
Dukakis Center for Urban & Regional Policy www.northeastern.edu/dukakiscenter Ted William’s House – 1940’s 39 Foster St. - Allston-Brighton

34
Dukakis Center for Urban & Regional Policy www.northeastern.edu/dukakiscenter Ted William’s House 39 Foster St. - Allston-Brighton Cost to Develop Today @ $275/sq.ft. $1,018,000

35
Dukakis Center for Urban & Regional Policy www.northeastern.edu/dukakiscenter Average Total Development Costs per Square Foot by Number of Units in Development, Massachusetts Source: Dukakis Center Analysis

36
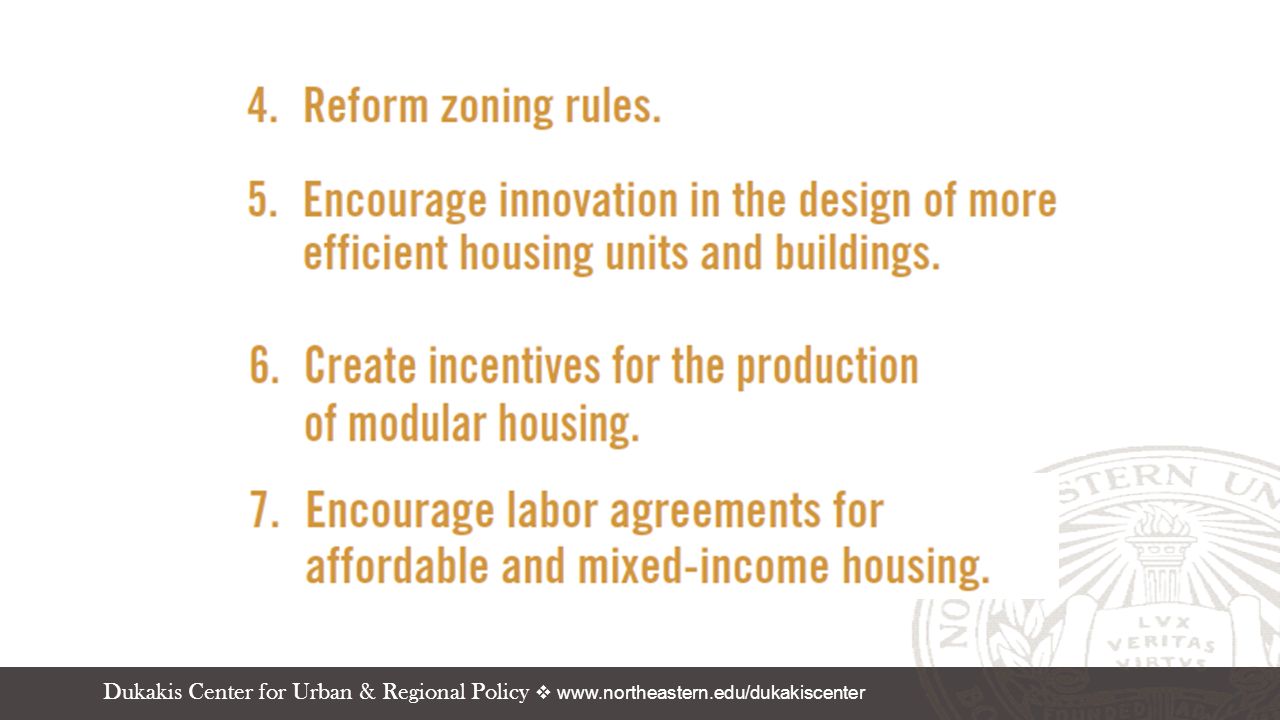
Toward a New Housing Policy

37
Dukakis Center for Urban & Regional Policy www.northeastern.edu/dukakiscenter

40
Thank You

Similar presentations


 forbid the unauthorized reproduction of this report by any means, including.>")


 forbid the unauthorized reproduction of this report by any means, including facsimile.>")


