Download presentation
Presentation is loading. Please wait.

1
Frequency Distributions
Chapter 2

2
Descriptive Statistics
Distributions are part of descriptive statistics…we are learning how to describe some data by first graphing it in a meaningful way.

3
Descriptive Statistics
Frequency distribution – describes the pattern of a set of numbers by displaying a count/percent for the values of the variables.

4
Frequency Distributions
Four different ways to visually describe just one variable: Frequency table Grouped frequency table Frequency histograms Frequency polygon

5
Let’s get some numbers

6
Frequency Tables Frequency tables include:
Values (all the possible numbers) Frequency (how many times each number appears) Percent/proportion Why percent when we have frequency?
 Frequency (how many times each number appears) Percent/proportion. Why percent when we have frequency")
7
Frequency Tables Grouped frequency tables are frequency tables where information has been clumped together. For example, ABCD breakdowns instead of each grade individually. Or income ranges rather than each income separately. Very useful for data with decimals and wide ranges of values.

8
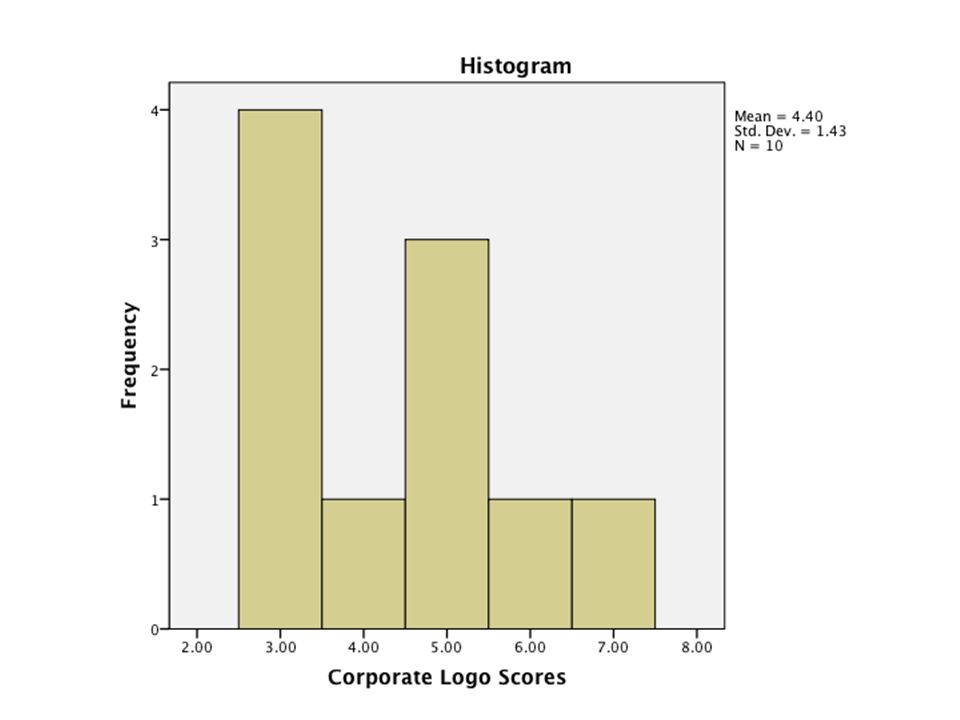
Histograms Histograms are frequency tables in graph form (basically they are turned on their side and made into a chart). Gives you an idea of the shape of the distribution (notes after SPSS instructions).
.")
9
Frequency Polygon Frequency polygons are histograms that aren’t shaded (although I don’t know why you wouldn’t just call it a histogram …).
.")
10
Frequency Tables SPSS instructions!
Just hit cancel on the opening screen.

11
SPSS basics Data view – where you enter data

12
SPSS basics Variable view – where you look at the variable types

13
SPSS basics To start, just enter some numbers.
You will get a variable name automatically.

14
Click on variable view to change the name of the variable.

15
Variable “LABELS” are the space you can enter a proper variable name that will get transferred to the output. Variable “NAMES” are the code SPSS uses to know what to run. No SPACES allowed. Some symbols are prohibited as well.

16
SPSS has a lot of bells and whistles (too many)
SPSS has a lot of bells and whistles (too many). You’ll get instructions with each chapter to not get confusing. So let’s start with frequency tables. How to enter data? You need ONE column with all the numbers you collected.
. You’ll get instructions with each chapter to not get confusing. So let’s start with frequency tables. How to enter data You need ONE column with all the numbers you collected.")
17
Click analyze > descriptives > frequencies.

18
SPSS uses a system where:
Things on left = not using. Things on right = using. So you will have to move the variable over to the right to get a chart.

19
In this case, we want to leave the “display frequency tables” button checked.
Click charts (for histograms).
.")
20
Click on the histogram button for the histogram.
You can check “show normal curve” if you want.

21
Hit ok to get output (comes up in a different window).
Frequency table:

23
We will talk about how to do these next time with chart builder.

24
Shapes of Distributions
Unimodal (normal distribution) Bimodal Multimodal Rectangular
 Bimodal. Multimodal. Rectangular.")
25
Shapes of Distributions
Normal distributions: Specific frequency distribution Bell shaped Symmetrical Unimodal

26
The Normal Distribution

27
Skewed Distributions When our data are not symmetrical
Positive: tail to the right May represent floor effects Negative: tail to the left May represent ceiling effects Memory hint: skew is where the tail is (the cat!)
")
28
Two Kinds of Skew

29
Kurtotic Distributions
Kurtosis – how much a distribution deviates from normal by looking at spread

Similar presentations