Download presentation
Presentation is loading. Please wait.

1
Journal Club 埼玉医科大学 総合医療センター 内分泌・糖尿病内科 Department of Endocrinology and Diabetes, Saitama Medical Center, Saitama Medical University 松田 昌文 Matsuda, Masafumi 2015 年 10 月 24 日 8:30-8:55 8階 医局 Basaria S, Harman SM, Travison TG, Hodis H, Tsitouras P, Budoff M, Pencina KM1, Vita J, Dzekov C, Mazer NA, Coviello AD, Knapp PE, Hally K, Pinjic E, Yan M, Storer TW, Bhasin S. Effects of Testosterone Administration for 3 Years on Subclinical Atherosclerosis Progression in Older Men With Low or Low-Normal Testosterone Levels: A Randomized Clinical Trial. JAMA. 2015 Aug 11;314(6):570-81. doi: 10.1001/jama.2015.8881. Menke A1, Casagrande S, Geiss L, Cowie CC. Prevalence of and Trends in Diabetes Among Adults in the United States, 1988-2012. JAMA. 2015 Sep 8;314(10):1021-9. doi: 10.1001/jama.2015.10029.
: doi: /jama Menke A1, Casagrande S, Geiss L, Cowie CC. Prevalence of and Trends in Diabetes Among Adults in the United States, JAMA Sep 8;314(10): doi: /jama")
2
テストステロン C 19 ステロイドのうち,睾丸由来のテストステロンは,胎生期初期に未分化性腺を男性 型に,分化誘導し,思春期男性における二次性徴の発育促進作用を示す.女子では,副 腎と卵巣起源のアンドロステンジオンからの転換生成物として,重要である. 異常値を示す病態・疾患 上昇する疾患 先天性副腎皮質過形成、睾丸腫瘍、卵巣腫瘍、多発性多毛症、多嚢胞性卵巣症候群、 Cushing 症候群、ターナー症候群、甲状腺機能亢進症 減少する疾患 アジソン病、緊張性筋ジストロフィー、下垂体機能低下症、肝硬変、前立腺癌 エストロゲン 卵巣から,主として産生され,卵胞発育に伴い特徴的な分泌パターンを示す.妊娠中は, 胎盤性エストロゲンの一部として大量分泌される.卵巣機能,とくに卵胞発育の状態を 知るためには,不可欠の検査である. 異常値を示す病態・疾患 上昇する疾患 エストロゲン産生腫瘍、卵巣過剰刺激症候群、多胎妊娠、先天性副腎皮質過形成、肝 疾患 減少する疾患 - (非妊婦) 不妊症、神経性食欲不振症、ターナー症候群、卵巣機能低下 減少する疾患 - (妊婦) 切迫流産、重症妊娠中毒、子宮内胎児死亡、異常妊娠 (From SRL reference) Journal Club 2013 年 9 月 26 日 8:30-8:55
 不妊症、神経性食欲不振症、ターナー症候群、卵巣機能低下 減少する疾患 - (妊婦) 切迫流産、重症妊娠中毒、子宮内胎児死亡、異常妊娠 (From SRL reference) Journal Club 2013 年 9 月 26 日 8:30-8:55")
3
AndroGel is to be applied to the area of the shoulders and upper arms that will be covered by a short-sleeve T-shirt. SIDE EFFECTS: The most common side effects of Androgel are headache, high blood pressure, acne, abnormal lab tests (for example, glucose and cholesterol tests), application site reactions (for example, itching, blisters, and redness), enlarged prostate, and increased serum prostate specific antigen (PSA) levels. Testosterone prescribing is escalating at startling rates, creating a nearly $2 billion (20 億ドル! ) annual market in which the raw drug costs only 1% of that total (Editorial N Engl J Med. 369(11):1058-9, 2013). 使用量・頻度 塗る部位 AndroGel® の場合:毎日風呂上がりに 1 ~ 2 包分( 5~10g )を、上腕や肩、 腹部等に塗布。調剤ジェルの場合は濃度を数倍高く作って貰えるので( 5 ~ 10% +)、大体 1 日 1 ~ 2 回、 1g ほどで済む。腕や肩、腹に塗る場合、吸収率は 10% ほど。 一ヶ月当たりの費用 使用量によるが、ブランドものは $200 以上。調剤だと薬局や使用量によって 差があるが大体 $20 ~ $60 前後。 (175g gel pump of Androgel 1.62% (brand) が 370 ドル、 275g gel pump of Androgel 1% が 380 ドルくらい ) IMS Health によると Testosteron 市場規模は、 $49 million(1997) から $216 million(2002) と大きく 増加 (CBS News | Testosterone In A Tube | May 20, 2003) 。といっても規模はまだ小さく、 Androgel [Solvay] $196 million(+51;2002 年 ) と大半を占める。 しかし新規参入の Auxilium 社は 2008 年に 20 億ドルを見込む。 因みに米国以外は市場と言えるものはない。 http://www.medmk.com/mm/add/mp_androgen.htm
, application site reactions (for example, itching, blisters, and redness), enlarged prostate, and increased serum prostate specific antigen (PSA) levels. Testosterone prescribing is escalating at startling rates, creating a nearly $2 billion (20 億ドル! ) annual market in which the raw drug costs only 1% of that total (Editorial N Engl J Med. 369(11):1058-9, 2013). 使用量・頻度 塗る部位 AndroGel® の場合:毎日風呂上がりに 1 ~ 2 包分( 5~10g )を、上腕や肩、 腹部等に塗布。調剤ジェルの場合は濃度を数倍高く作って貰えるので( 5 ~ 10% +)、大体 1 日 1 ~ 2 回、 1g ほどで済む。腕や肩、腹に塗る場合、吸収率は 10% ほど。 一ヶ月当たりの費用 使用量によるが、ブランドものは $200 以上。調剤だと薬局や使用量によって 差があるが大体 $20 ~ $60 前後。 (175g gel pump of Androgel 1.62% (brand) が 370 ドル、 275g gel pump of Androgel 1% が 380 ドルくらい ) IMS Health によると Testosteron 市場規模は、 $49 million(1997) から $216 million(2002) と大きく 増加 (CBS News | Testosterone In A Tube | May 20, 2003) 。といっても規模はまだ小さく、 Androgel [Solvay] $196 million(+51;2002 年 ) と大半を占める。 しかし新規参入の Auxilium 社は 2008 年に 20 億ドルを見込む。 因みに米国以外は市場と言えるものはない。")
4
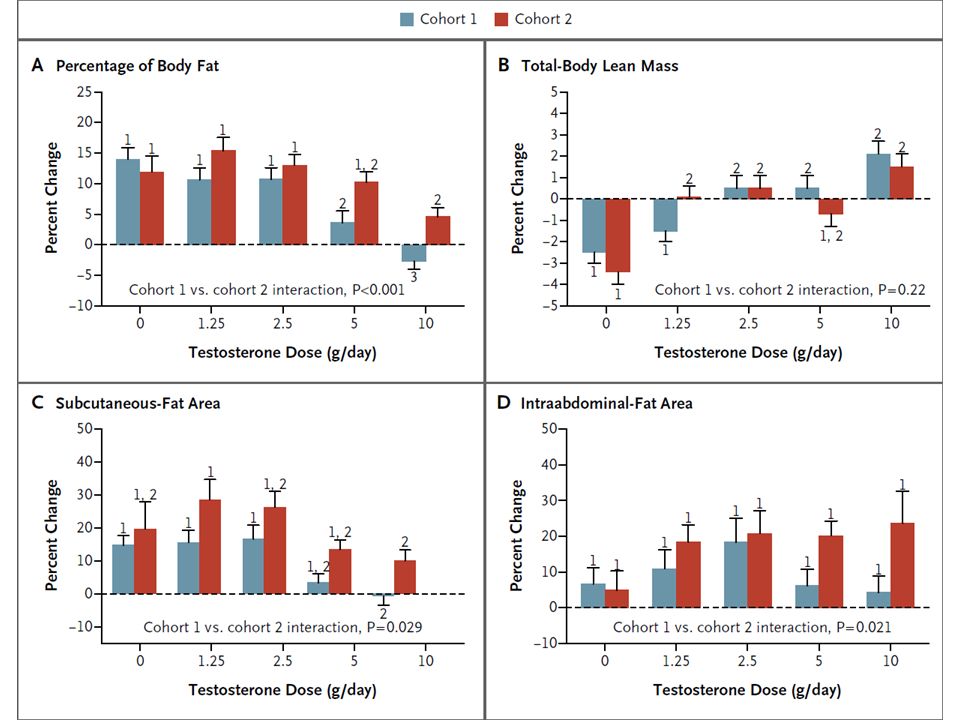
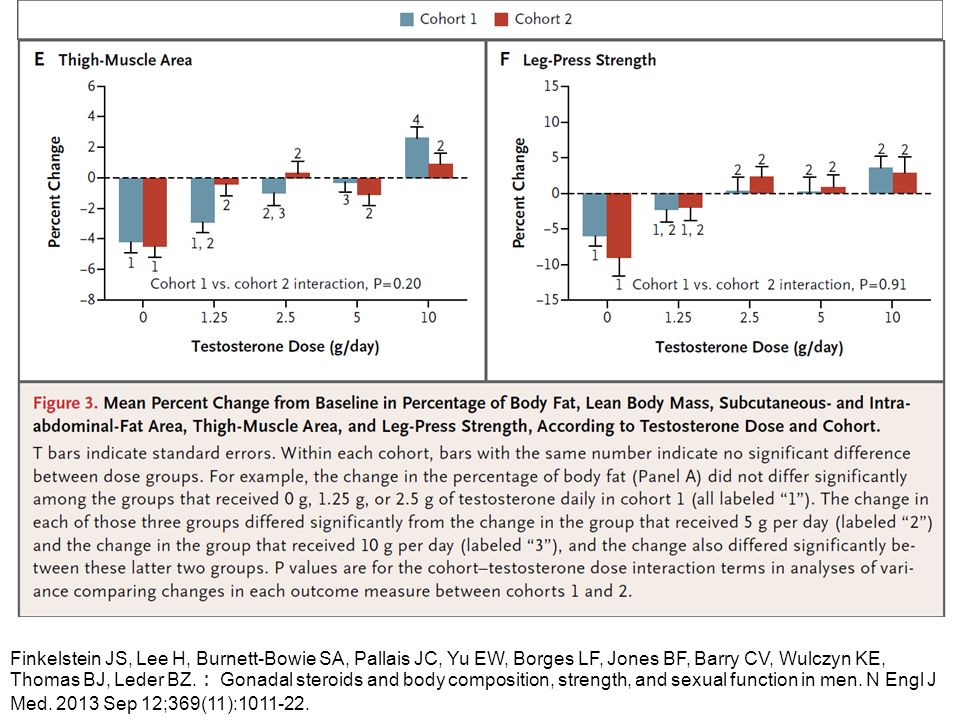
* Plus–minus values are means ±SD. There were no significant differences between cohort 1 and cohort 2 for groups assigned to the same testosterone dose unless otherwise indicated. To convert the values for testosterone to nanomoles per liter, multiply by 0.03467. To convert the values for estradiol to picomoles per liter, multiply by 3.671. To convert the values for leg press to kilograms, multiply by 0.45. † P<0.01 with the use of a nonpaired t-test for the comparison with cohort 2. ‡ P<0.05 with the use of a nonpaired t-test for the comparison with cohort 2. § The body-mass index is the weight in kilograms divided by the square of the height in meters. ¶ P<0.05 with the use of one-way analysis of variance for comparisons across dose groups in cohort 1. We provided 198 healthy men (Cohort 1) 20 to 50 years of age with goserelin acetate (to suppress endogenous testosterone and estradiol) and randomly assigned them to receive a placebo gel or 1.25 g, 2.5 g, 5 g, or 10 g of testosterone gel daily for 16 weeks. Another 202 healthy men (Cohort 2) received goserelin acetate, placebo gel or testosterone gel, and anastrozole (to suppress the conversion of testosterone to estradiol). Changes in the percentage of body fat and in lean mass were the primary outcomes. Subcutaneous- and intraabdominal-fat areas, thigh-muscle area and strength, and sexual function were also assessed. Finkelstein JS, Lee H, Burnett-Bowie SA, Pallais JC, Yu EW, Borges LF, Jones BF, Barry CV, Wulczyn KE, Thomas BJ, Leder BZ. : Gonadal steroids and body composition, strength, and sexual function in men. N Engl J Med. 2013 Sep 12;369(11):1011-22.
 20 to 50 years of age with goserelin acetate (to suppress endogenous testosterone and estradiol) and randomly assigned them to receive a placebo gel or 1.25 g, 2.5 g, 5 g, or 10 g of testosterone gel daily for 16 weeks. Another 202 healthy men (Cohort 2) received goserelin acetate, placebo gel or testosterone gel, and anastrozole (to suppress the conversion of testosterone to estradiol). Changes in the percentage of body fat and in lean mass were the primary outcomes. Subcutaneous- and intraabdominal-fat areas, thigh-muscle area and strength, and sexual function were also assessed. Finkelstein JS, Lee H, Burnett-Bowie SA, Pallais JC, Yu EW, Borges LF, Jones BF, Barry CV, Wulczyn KE, Thomas BJ, Leder BZ. : Gonadal steroids and body composition, strength, and sexual function in men. N Engl J Med Sep 12;369(11):")
7
1 Research Program in Men’s Health: Aging and Metabolism, Boston Claude D. Pepper Older Americans Independence Center, Brigham and Women’s Hospital, Harvard Medical School, Boston, Massachusetts 2 Kronos Longevity Research Institute, Phoenix, Arizona 3 Phoenix VA Health Care System, Phoenix, Arizona 4 Atherosclerosis Research Unit, Keck School of Medicine, University of Southern California, Los Angeles 5 DWR Department of Geriatric Medicine, University of Oklahoma, Oklahoma City 6 Los Angeles Biomedical Research Institute, Division of Cardiology, Harbor-UCLA Medical Center, Torrance, California 7 Division of Cardiology, Boston University School of Medicine, Boston, Massachusetts 8 Division of Endocrinology, Metabolism, and Molecular Medicine, Charles R. Drew University of Medicine and Science, Los Angeles, California 9 Roche Pharmaceutical Research and Early Development, Roche Innovation Center Basel, Basel, Switzerland 10 Division of Endocrinology, Boston University School of Medicine, Boston, Massachusetts 11 Institute for Aging Research, Hebrew SeniorLife, Boston, Massachusetts.

8
Importance Testosterone use in older men is increasing, but its long-term effects on progression of atherosclerosis are unknown. Objective To determine the effect of testosterone administration on subclinical atherosclerosis progression in older men with low or low-normal testosterone levels.

9
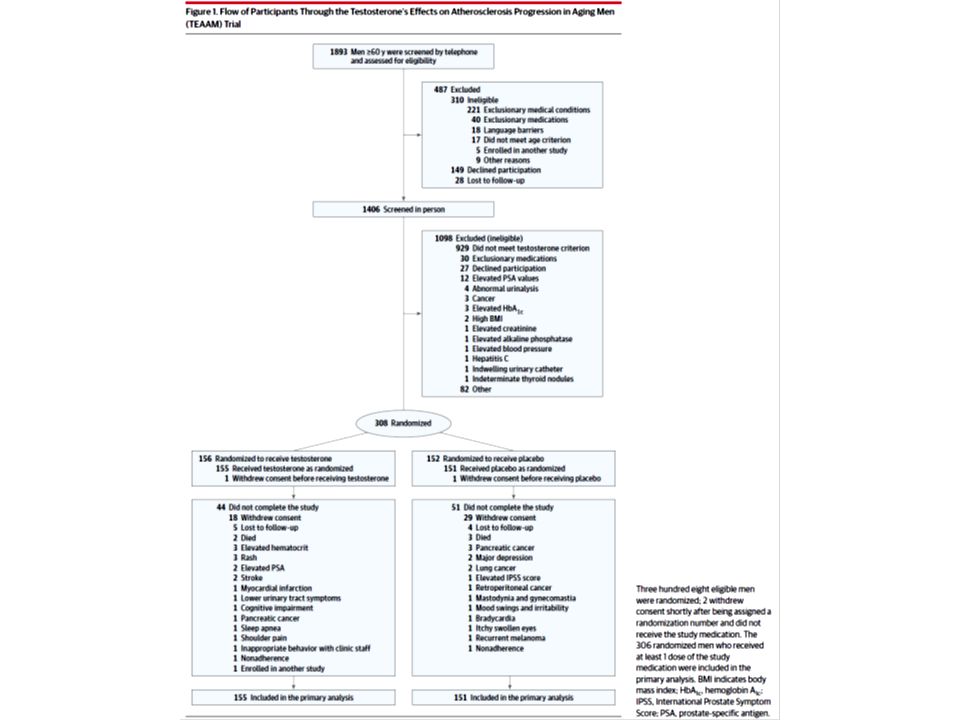
Design, Setting, and Participants Testosterone’s Effects on Atherosclerosis Progression in Aging Men (TEAAM) was a placebo- controlled, double-blind, parallel-group randomized trial involving 308 men 60 years or older with low or low-normal testosterone levels (100- 400 ng/dL; free testosterone <50 pg/mL), recruited at 3 US centers. Recruitment took place between September 2004 and February 2009; the last participant completed the study in May 2012. Interventions One hundred fifty-six participants were randomized to receive 7.5 g of 1% testosterone and 152 were randomized to receive placebo gel packets daily for 3 years. The dose was adjusted to achieve testosterone levels between 500 and 900 ng/dL. Main Outcomes and Measures Coprimary outcomes included common carotid artery intima-media thickness and coronary artery calcium; secondary outcomes included sexual function and health–related quality of life.

11
Abbreviations: AU, Agatston units of coronary artery calcium; BMI, body mass index, calculated as weight in kilograms divided by height in meters squared; CARES, Cancer Rehabilitation Evaluation System; CCA-IMT, common carotid artery intima-media thickness; HDL, high-density lipoprotein; IIEF, International Index of Erectile Function; IPSS, International Prostate Symptom score; LDL, low-density lipoprotein; PSA, prostate-specific antigen; QOL, quality of life. SI conversion factors: To convert estradiol to pmol, multiply by 3.671; LDL, HDL, and total cholesterol to mmol/L, multiply by 0.0259; creatinine to μmol/L, multiply by 88.4; glucose to mmol/L, multiply by 0.0555; total testosterone to nmol/L, multiply by 0.0347; sex hormone–binding globulin to nmol/L, multiply by 8.896; and triglycerides to mmol/L, multiply by 0.0113. a Based on self-report or medication use. bRanges from 0 (asymptomatic) to 35 (severely symptomatic). c Score range, 0%to 100%, with the highest representing perfect health-related QOL. d Self-reports of the physical function domain from the Medical Outcomes Study 36-item short form (range, 0%-100%), with highest score representing no dysfunction. e Score range, 0 to 75, with the highest representing no dysfunction. f Score range, 0 to 24, with the highest representing most severe. g Medication adherence was determined by returned gel packets at follow-up visits.
 to 35 (severely symptomatic). c Score range, 0%to 100%, with the highest representing perfect health-related QOL. d Self-reports of the physical function domain from the Medical Outcomes Study 36-item short form (range, 0%-100%), with highest score representing no dysfunction. e Score range, 0 to 75, with the highest representing no dysfunction. f Score range, 0 to 24, with the highest representing most severe. g Medication adherence was determined by returned gel packets at follow-up visits..")
12
Figure 2. Total and Free Testosterone Levels at Baseline and While Taking Study Medication Means and 95%confidence intervals are presented as data markers and error bars.

13
Figure 3. Change in Distal Common Carotid Artery Intima-Media Thickness and Coronary Artery Calcium Scores in Participants The trajectory of change in carotid artery intima-media thickness and total coronary artery calcium by time since randomization. The means (data markers) and 95%CIs (error bars), generated from the observed data, are shown. Estimates are derived frommixed-effects regression models supplemented by multiple imputation ofmissing records (see theMethods section).
 and 95%CIs (error bars), generated from the observed data, are shown. Estimates are derived frommixed-effects regression models supplemented by multiple imputation ofmissing records (see theMethods section)..")
17
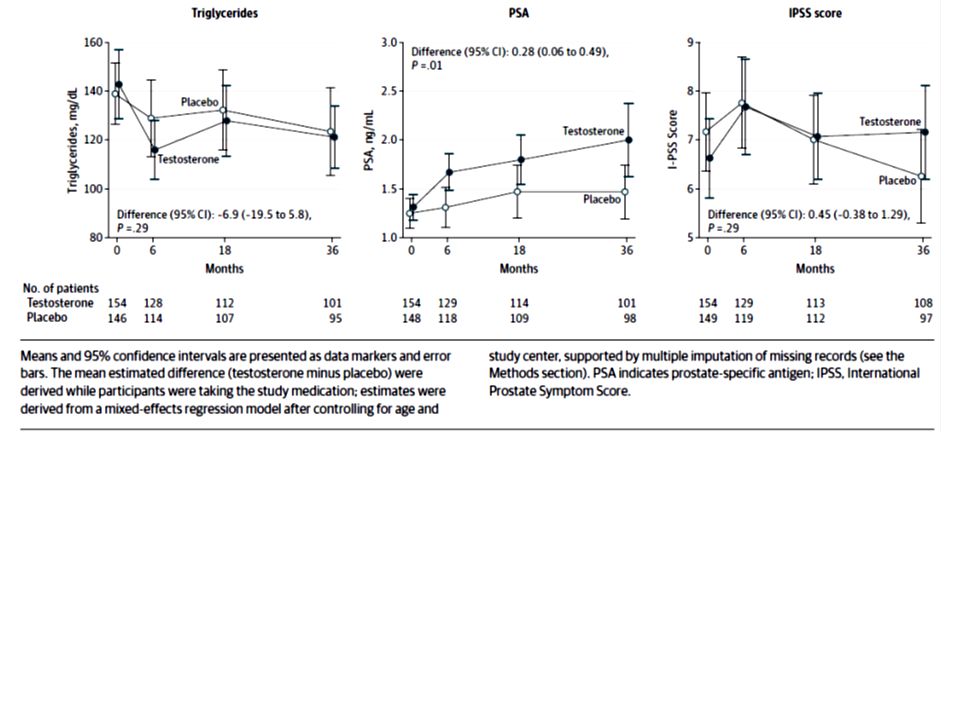
Results: Results Baseline characteristics were similar between groups: patients were a mean age of 67.6 years; 42% had hypertension; 15%, diabetes; 15%, cardiovascular disease; and 27%, obesity. The rate of change in intima-media thickness was 0.010 mm/year in the placebo group and 0.012 mm/year in the testosterone group (mean difference adjusted for age and trial site, 0.0002 mm/year; 95% CI, −0.003 to 0.003, P =.89). The rate of change in the coronary artery calcium score was 41.4 Agatston units/year in the placebo group and 31.4 Agatston units/year in the testosterone group (adjusted mean difference, −10.8 Agatston units/year; 95% CI, −45.7 to 24.2; P =.54). Changes in intima-media thickness or calcium scores were not associated with change in testosterone levels among individuals assigned to receive testosterone. Sexual desire, erectile function, overall sexual function scores, partner intimacy, and health-related quality of life did not differ significantly between groups. Hematocrit and prostate-specific antigen levels increased more in testosterone group.
. The rate of change in the coronary artery calcium score was 41.4 Agatston units/year in the placebo group and 31.4 Agatston units/year in the testosterone group (adjusted mean difference, −10.8 Agatston units/year; 95% CI, −45.7 to 24.2; P =.54). Changes in intima-media thickness or calcium scores were not associated with change in testosterone levels among individuals assigned to receive testosterone. Sexual desire, erectile function, overall sexual function scores, partner intimacy, and health-related quality of life did not differ significantly between groups. Hematocrit and prostate-specific antigen levels increased more in testosterone group..")
18
Conclusions and Relevance Among older men with low or low-normal testosterone levels, testosterone administration for 3 years vs placebo did not result in a significant difference in the rates of change in either common carotid artery intima-media thickness or coronary artery calcium nor did it improve overall sexual function or health-related quality of life. Because this trial was only powered to evaluate atherosclerosis progression, these findings should not be interpreted as establishing cardiovascular safety of testosterone use in older men. Trial Registration clinicaltrials.gov Identifier: NCT00287586

19
Message 平均年齢 67.6 歳のテストステロン低値または 低 - 正常値の男性 308 人を対象に、テストステロ ン 3 年間投与による無症候性アテローム性動脈硬 化症の進行阻止効果をプラセボ対照試験で検討 ( TEAAM 試験)。総頸動脈内膜中膜肥厚度はプ ラセボ群 0.010 mm/year 、テストステロン群 0.012 mm/year (年齢/治験実施施設で調整 後の平均差 0.0002 mm/year; 95% CI, - 0.003 -0.003, P = 0.89 )。冠動脈カルシウム の変化率に有意差が生じることはなかった。 http://www.m3.com/clinical/journal/15768
。総頸動脈内膜中膜肥厚度はプ ラセボ群 mm/year 、テストステロン群 mm/year (年齢/治験実施施設で調整 後の平均差 mm/year; 95% CI, - , P = 0.89 )。冠動脈カルシウム の変化率に有意差が生じることはなかった。")
21
1 Social & Scientific Systems Inc, Silver Spring, Maryland 2 Division of Diabetes Translation, National Center for Chronic Disease Prevention and Health Promotion, US Centers for Disease Control and Prevention, Atlanta, Georgia 3 National Institute of Diabetes and Digestive and Kidney Diseases, National Institutes of Health, Bethesda, Maryland

22
Importance Previous studies have shown increasing prevalence of diabetes in the United States. New US data are available to estimate prevalence of and trends in diabetes. Objective To estimate the recent prevalence and update US trends in total diabetes, diagnosed diabetes, and undiagnosed diabetes using National Health and Nutrition Examination Survey (NHANES) data.
 data..")
23
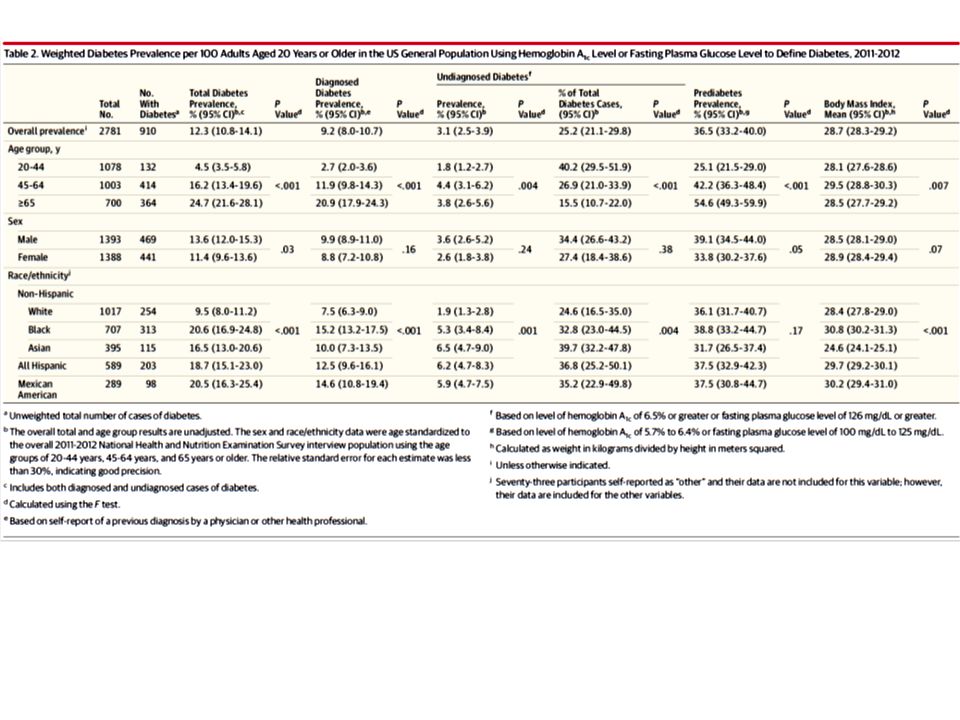
Design, Setting, and Participants Cross-sectional surveys conducted between 1988-1994 and 1999-2012 of nationally representative samples of the civilian, noninstitutionalized US population; 2781 adults from 2011-2012 were used to estimate recent prevalence and an additional 23634 adults from 1988- 2010 were used to estimate trends. Main Outcomes and Measures The prevalence of diabetes was defined using a previous diagnosis of diabetes or, if diabetes was not previously diagnosed, by (1) a hemoglobin A1c level of 6.5% or greater or a fasting plasma glucose (FPG) level of 126 mg/dL or greater (hemoglobin A1c or FPG definition) or (2) additionally including 2-hour plasma glucose (2-hour PG) level of 200 mg/dL or greater (hemoglobin A1c, FPG, or 2-hour PG definition). Prediabetes was defined as a hemoglobin A1c level of 5.7% to 6.4%, an FPG level of 100 mg/dL to 125 mg/dL, or a 2-hour PG level of 140 mg/dL to 199 mg/dL.
 a hemoglobin A1c level of 6.5% or greater or a fasting plasma glucose (FPG) level of 126 mg/dL or greater (hemoglobin A1c or FPG definition) or (2) additionally including 2-hour plasma glucose (2-hour PG) level of 200 mg/dL or greater (hemoglobin A1c, FPG, or 2-hour PG definition). Prediabetes was defined as a hemoglobin A1c level of 5.7% to 6.4%, an FPG level of 100 mg/dL to 125 mg/dL, or a 2-hour PG level of 140 mg/dL to 199 mg/dL..")
27
Both diagnosed and undiagnosed cases of diabetes are included in the total cases. Diagnosed diabetes is based on self-report of a previous diagnosis by a physician or other health professional. Undiagnosed diabetes is based on a hemoglobin A1c level of 6.5%or greater or fasting plasma glucose level of 126mg/dL or greater. All estimates were age standardized to the overall 2011-2012 National Health and Nutrition Examination Survey interview population using the age groups of 20- 44 years, 45-64 years, and 65 years or older. Error bars indicate 95%confidence intervals.

28
Normal weight includes participants with a body mass index (BMI; calculated as weight in kilograms divided by height in meters squared) of less than 25, overweight includes those with a BMI of 25 to 29.9, and obese includes those with a BMI of 30 or greater. Presence of diabetes is based on a previous diabetes diagnosis, hemoglobin A1c level of 6.5%or greater, or fasting plasma glucose level of 126mg/dL or greater. All estimates were age standardized to the overall 2011-2012 National Health and Nutrition Examination Survey interview population using the age groups of 20-44 years, 45-64 years, and 65 years or older. Error bars indicate 95%confidence intervals.

29
Results In the overall 2011-2012 population, the unadjusted prevalence (using the hemoglobin A1c, FPG, or 2-hour PG definitions for diabetes and prediabetes) was 14.3% (95% CI, 12.2%-16.8%) for total diabetes, 9.1% (95% CI, 7.8%-10.6%) for diagnosed diabetes, 5.2% (95% CI, 4.0%-6.9%) for undiagnosed diabetes, and 38.0% (95% CI, 34.7%-41.3%) for prediabetes; among those with diabetes, 36.4% (95% CI, 30.5%-42.7%) were undiagnosed. The unadjusted prevalence of total diabetes (using the hemoglobin A1c or FPG definition) was 12.3% (95% CI, 10.8%- 14.1%); among those with diabetes, 25.2% (95% CI, 21.1%-29.8%) were undiagnosed. Compared with non-Hispanic white participants (11.3% [95% CI, 9.0%-14.1%]), the age-standardized prevalence of total diabetes (using the hemoglobin A1c, FPG, or 2-hour PG definition) was higher among non-Hispanic black participants (21.8% [95% CI, 17.7%-26.7%]; P <.001), non-Hispanic Asian participants (20.6% [95% CI, 15.0%-27.6%]; P =.007), and Hispanic participants (22.6% [95% CI, 18.4%-27.5%]; P <.001). The age-standardized percentage of cases that were undiagnosed was higher among non-Hispanic Asian participants (50.9% [95% CI, 38.3%-63.4%]; P =.004) and Hispanic participants (49.0% [95% CI, 40.8%-57.2%]; P =.02) than all other racial/ethnic groups. The age-standardized prevalence of total diabetes (using the hemoglobin A1c or FPG definition) increased from 9.8% (95% CI, 8.9%-10.6%) in 1988-1994 to 10.8% (95% CI, 9.5%-12.0%) in 2001-2002 to 12.4% (95% CI, 10.8%-14.2%) in 2011-2012 (P <.001 for trend) and increased significantly in every age group, in both sexes, in every racial/ethnic group, by all education levels, and in all poverty income ratio tertiles.
 was 12.3% (95% CI, 10.8%- 14.1%); among those with diabetes, 25.2% (95% CI, 21.1%-29.8%) were undiagnosed. Compared with non-Hispanic white participants (11.3% [95% CI, 9.0%-14.1%]), the age-standardized prevalence of total diabetes (using the hemoglobin A1c, FPG, or 2-hour PG definition) was higher among non-Hispanic black participants (21.8% [95% CI, 17.7%-26.7%]; P <.001), non-Hispanic Asian participants (20.6% [95% CI, 15.0%-27.6%]; P =.007), and Hispanic participants (22.6% [95% CI, 18.4%-27.5%]; P <.001). The age-standardized percentage of cases that were undiagnosed was higher among non-Hispanic Asian participants (50.9% [95% CI, 38.3%-63.4%]; P =.004) and Hispanic participants (49.0% [95% CI, 40.8%-57.2%]; P =.02) than all other racial/ethnic groups. The age-standardized prevalence of total diabetes (using the hemoglobin A1c or FPG definition) increased from 9.8% (95% CI, 8.9%-10.6%) in to 10.8% (95% CI, 9.5%-12.0%) in to 12.4% (95% CI, 10.8%-14.2%) in (P <.001 for trend) and increased significantly in every age group, in both sexes, in every racial/ethnic group, by all education levels, and in all poverty income ratio tertiles..")
30
Conclusions and Relevance In 2011-2012, the estimated prevalence of diabetes was 12% to 14% among US adults, depending on the criteria used, with a higher prevalence among participants who were non-Hispanic black, non- Hispanic Asian, and Hispanic. Between 1988- 1994 and 2011-2012, the prevalence of diabetes increased in the overall population and in all subgroups evaluated.

31
Message 米国の 2011 ~ 12 年の糖尿病有病率は 12.4 %で あり、 1988 ~ 94 年の 9.8 %、 2001 ~ 02 年の 10.8 %から増加傾向が続いていることが明らか になった。同様の傾向は、男女別にみても、また 年齢別や人種別にみた場合も認められたという。 米国疾病予防管理センター( CDC )の Andy Menke 氏らが、米国民健康栄養調査( National Health and Nutrition Examination Survey : NHANES )のデータを基に調べ報告 した。 https://www.carenet.com/news/journal/carenet/40672
の Andy Menke 氏らが、米国民健康栄養調査( National Health and Nutrition Examination Survey : NHANES )のデータを基に調べ報告 した。")
Similar presentations


行列式の定義には、数学的な概念がいろいろ必要である。まずそれらを順に見ていく。>")


 を、出現から消滅まで 全天 X 線監視装置 MAXI (マキシ)で観測したところ、 新種のブラックホール新星であることが判明した。 従来のブラックホールを、 多量のガスを一気に飲み込む「肉食系」と.>")


 ・Excelによる演習>")
 入力データに含まれる、本来ほしくない 成分.>")
を用いて授業を行うために、名古屋工業大学松 尾啓志、津邑公暁が作成しました。 パワーポイント2007で最終版として保存しているため、変更はできませ んが、授業でお使いなる場合は松尾(matsuo@nitech.ac.jp)まで連絡い.>")

を体験したことにより興味を惹かれ るきっかけとなった。主な目的は、これ.>")


を生かした 確かな学力を形成する授業づく り ② 家庭との連携を図った家庭学習の習慣化.>")
