Download presentation
Presentation is loading. Please wait.

1
National and International Accounts: Income, Wealth, and the Balance of Payments In an open economy, the measurement of economic activity is more complicated because we have to account for cross-border flows. These additional flows are recorded in a nation’s balance of payments accounts. An international system of accounts shows international trade in goods and services is complemented and balanced by a parallel trade in assets explains the international system of trade and payments shows how these transactions relate to national income and wealth

2
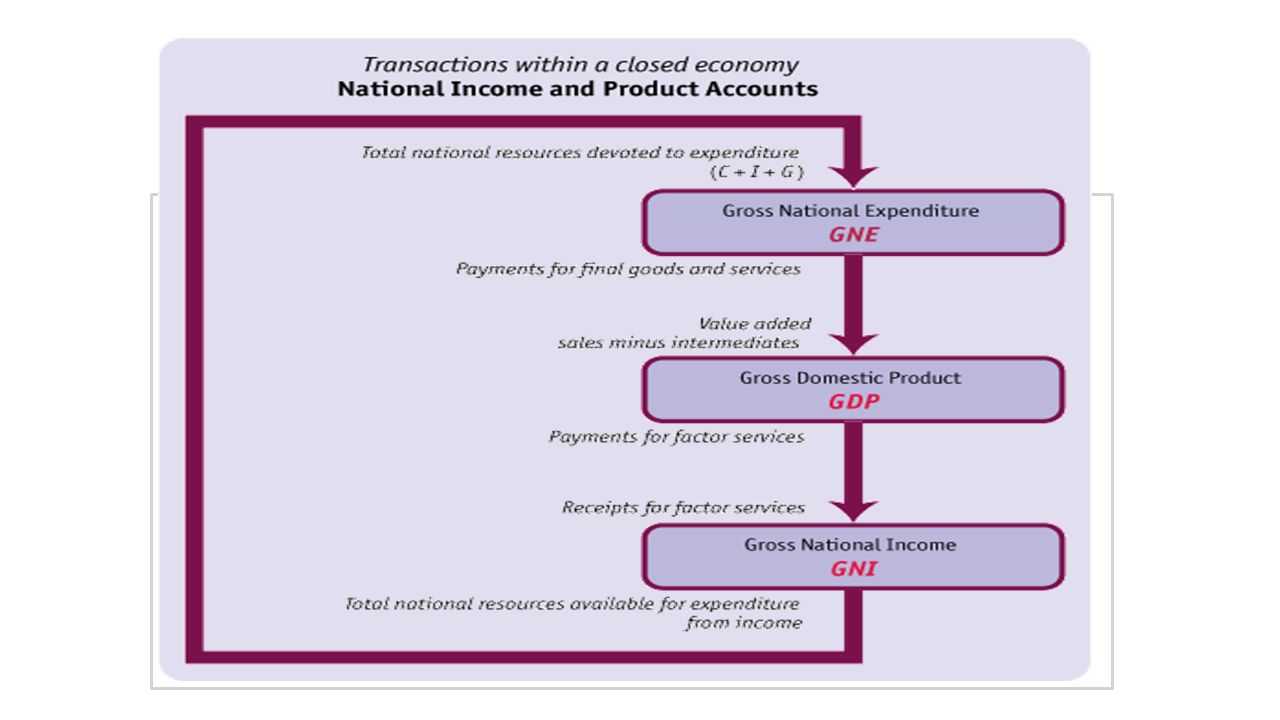
Gross national expenditure (GNE) is the total expenditure on final goods and services by home entities in any given period (C + I + G). A country’s gross domestic product (GDP) is the value of all (intermediate and final ) goods and services produced as output by firms, minus the value of all goods and services purchased as inputs by firms. The Flow of Payments in a Closed Economy: National Income and Product Accounts
 is the value of all (intermediate and final ) goods and services produced as output by firms, minus the value of all goods and services purchased as inputs by firms. The Flow of Payments in a Closed Economy: National Income and Product Accounts.")
3
GDP is a product measure, in contrast to GNE, which is an income measure. In a closed economy, income is paid to domestic entities. It thus equals the total income resources of the economy, also known as gross national income (GNI). The Flow of Payments in a Closed Economy: National Income and Product Accounts
. The Flow of Payments in a Closed Economy: National Income and Product Accounts.")
5
The difference between payments made for imports and payments received for exports is called the trade balance (TB), and it equals net payments to domestic firms for trade. GNE plus TB equals GDP, the total value of production in the home economy. The Flow of Payments in an Open Economy: Incorporating the Balance of Payments Accounts

6
The value of factor service exports minus factor service imports is known as net factor income from abroad (NFIA), and thus GDP plus NFIA equal GNI, the total income earned by domestic entities from all sources, domestic and foreign.
, and thus GDP plus NFIA equal GNI, the total income earned by domestic entities from all sources, domestic and foreign.")
7
Gifts may take the form of income transfers or “in kind” transfers of goods and services. They are considered nonmarket transactions, and are referred to as unilateral transfers. Net unilateral transfers (NUT) equals the value of unilateral transfers the country receives from the rest of the world minus those it gives to the rest of the world. The Flow of Payments in an Open Economy: Transfers in the Balance of Payments
 equals the value of unilateral transfers the country receives from the rest of the world minus those it gives to the rest of the world. The Flow of Payments in an Open Economy: Transfers in the Balance of Payments.")
8
These net transfers have to be added to GNI to calculate gross national disposable income (GNDI). Thus, GNI plus NUT equals GNDI, which represents the total income resources available to the home country.

9
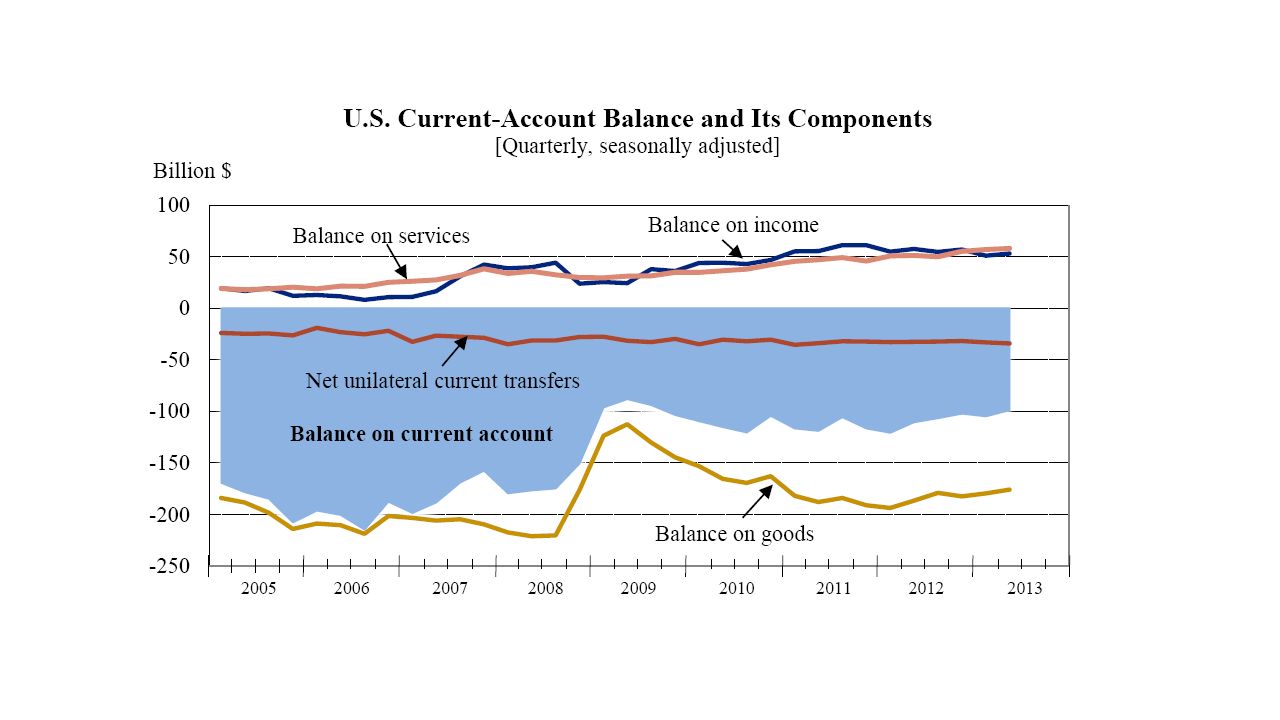
Current Account The current account (CA) is a tally of all international transactions in goods, services, and income (occurring through market transactions or transfers).
 is a tally of all international transactions in goods, services, and income (occurring through market transactions or transfers).")
10
U.S Current Account Percentage Of GDP

11
The value of asset exports minus asset imports is called the financial account (FA). These net asset exports are added to home GNDI when calculating the total resources available for expenditure in the home country. The Flow of Payments in an Open Economy: the Financial Account

12
A country may not only buy and sell assets but also transfer assets as gifts. Such asset transfers are measured by the capital account (KA), which is the value of capital transfers from the rest of the world minus those to the rest of the world. The Flow of Payments in an Open Economy: Capital Account
, which is the value of capital transfers from the rest of the world minus those to the rest of the world. The Flow of Payments in an Open Economy: Capital Account.")
14
The expenditure approach looks at the demand for goods: it examines how much is spent on demand for final goods and services. The key measure is GNE. The product approach looks at the supply of goods: it measures the value of all goods and services produced as output minus the value of goods used as inputs in production. The key measure is GDP. The income approach focuses on payments to owners of factors: it tracks the amount of income they receive. The key measures are gross national income GNI and gross national disposable income GNDI (which includes net transfers). Three Approaches to Measuring Economic Activity
. Three Approaches to Measuring Economic Activity.")
15
Personal consumption expenditures: total spending by households on final goods and services, including nondurable goods such as food, durable goods, and services. Gross private domestic investment: total spending by firms or households on final goods and services to make additions to the stock of capital. Investment includes new construction, the purchase of new equipment, and net increases in inventories. Government consumption expenditures: spending by the public sector on final goods and services. It does not include transfer payments, such as Social Security or unemployment. From GNE to GDP: Accounting for Trade in Goods and Services

16
Gross domestic product equals gross national expenditure (GNE) plus the trade balance (TB). The trade balance, TB, is also often called net exports because it is the net value of exports minus imports, it may be positive or negative. If TB > 0, exports are greater than imports and we say a country has a trade surplus. If TB < 0, imports are greater than exports and we say a country has a trade deficit. From GNE to GDP: Accounting for Trade in Goods and Services

17
U.S. Trade Balance

18
Gross national income equals gross domestic product (GDP) plus net factor income from abroad (NFIA). From GDP to GNI: Accounting for Trade in Factor Services

19
U.S. Net Factor Income from Abroad Billions Chained 2009 Dollars

20
FIGURE 5-3 In the 1970s, Ireland was one of the poorer countries in Europe, but over the next three decades it experienced speedy economic growth with an accompanying investment boom now known as the Irish Miracle.

22
If a country receives transfers UT IN and makes transfers UT OUT, its net unilateral transfers, NUT are NUT = UT IN − UT OUT. This can be positive or negative. Adding net unilateral transfers to gross national income gives a complete measure of national income in an open economy. This is gross national disposable income (GNDI), which we denote Y: From GNI to GNDI: Accounting for Transfers of Income
, which we denote Y: From GNI to GNDI: Accounting for Transfers of Income.")
23
U.S. Net Unilateral Transfers Percentage of GDP

24
From GNI to GNDI: Net Unilateral Transfers, 2000-2008 FIGURE 5-4 Major Transfer Recipients, 2000-2010

25
Define the current account as the sum of all three external terms in gross national disposable income, GNDI: What do National Economic Aggregates Tell Us?

27
U.S. Current Account Balance

28
U.S. Current Account as a Percentage of GDP

29
Data for the National Economic Aggregates The table shows the computation of GDP, GNI, and GNDI in 2014 in billions of dollars using the components of gross national expenditure, the trade balance, international income payments, and unilateral transfers $ billions Consumption (personal consumption expenditure)11,865.9 Investment (gross private investment)2,860.0 Government expenditure3,152.1 Gross national expenditure17,878.0 Trade balance-530.0 Gross domestic product17,348.1 Net factor income263.1 Gross national income17,611.2 Net unilateral transfers-119 Gross national disposable income17,492.0
11,865.9 Investment (gross private investment)2,860.0 Government expenditure3,152.1 Gross national expenditure17,878.0 Trade balance Gross domestic product17,348.1 Net factor income263.1 Gross national income17,611.2 Net unilateral transfers-119 Gross national disposable income17,492.0")
30
The Current Account This equation is the open-economy national income identity. It tells us that the current account represents the difference between national income Y (or GNDI) and gross national expenditure GNE (or C + I + G ). Notice that GNDI is greater than GNE if and only if CA is positive, or in surplus. GNDI is less than GNE if and only if CA is negative, or in deficit.
 and gross national expenditure GNE (or C + I + G ). Notice that GNDI is greater than GNE if and only if CA is positive, or in surplus. GNDI is less than GNE if and only if CA is negative, or in deficit..")
31
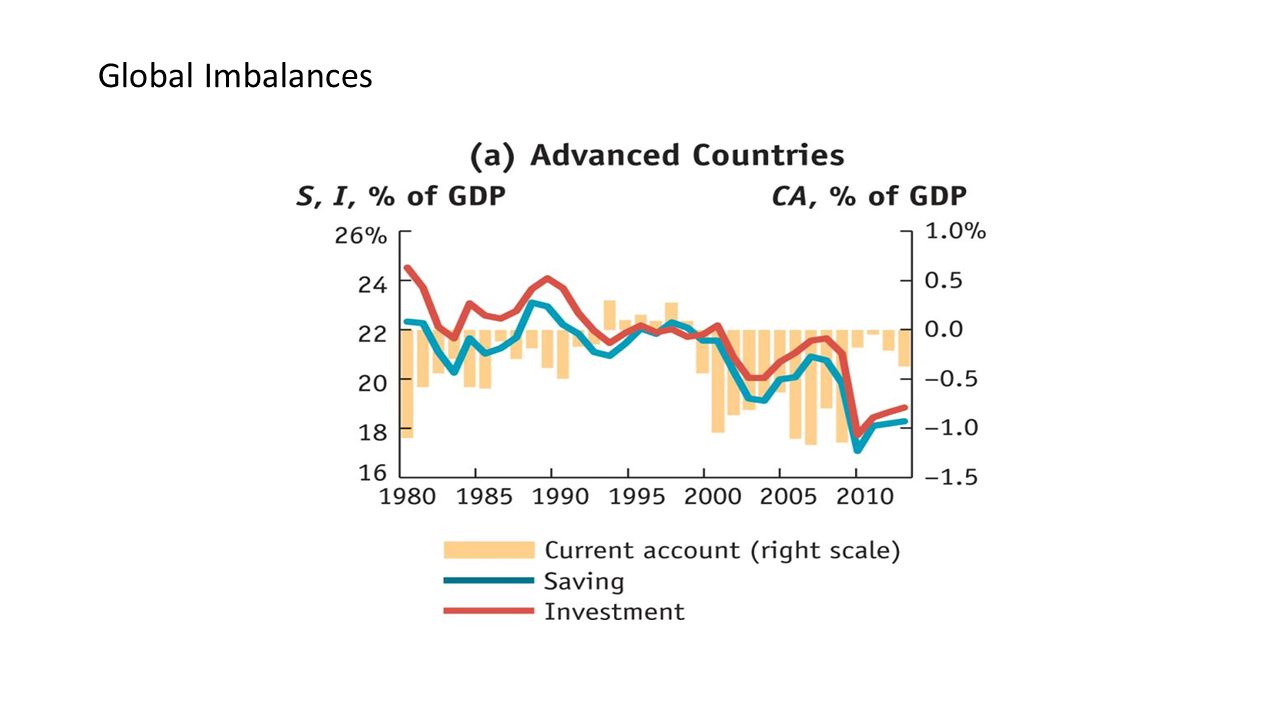
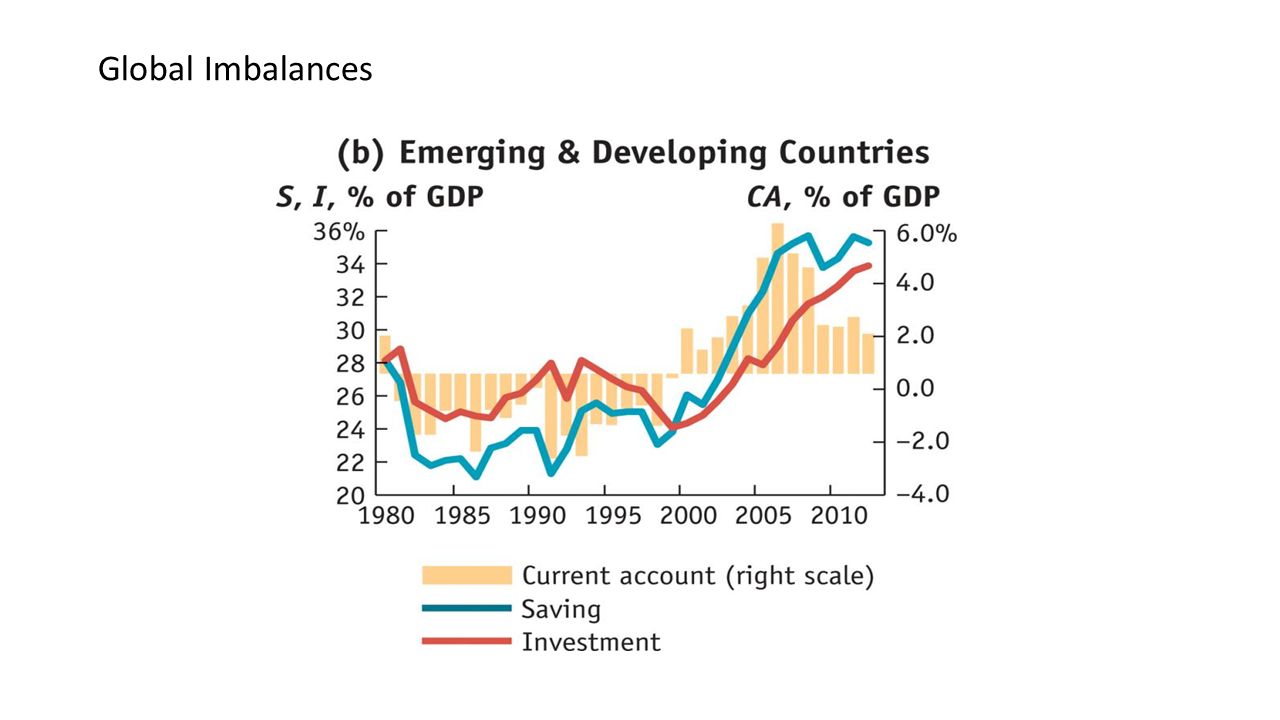
The current account is also the difference between national saving (S=Y-C-G) and investment: This equation is called the current account identity even though it is just a rearrangement of the national income identity. Thus, S is greater than I if and only if CA is positive, or in surplus. S is less than I if and only if CA is negative, or in deficit. The Current Account

32
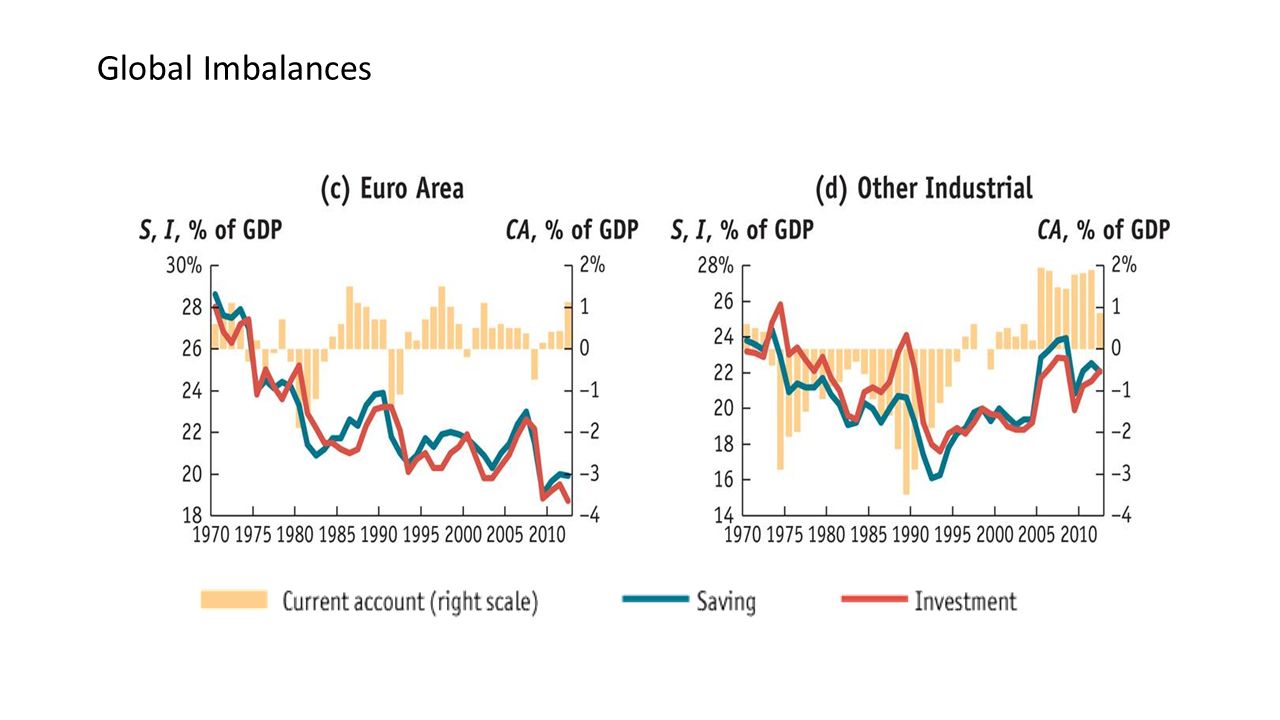
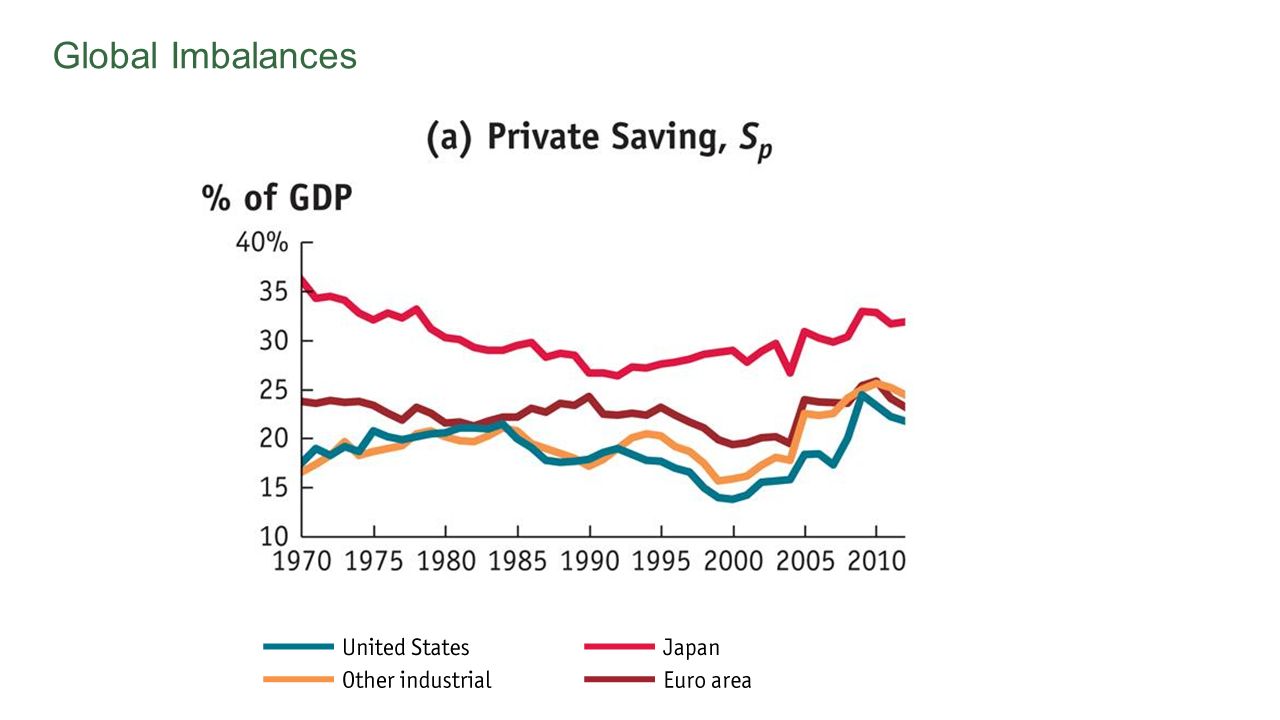
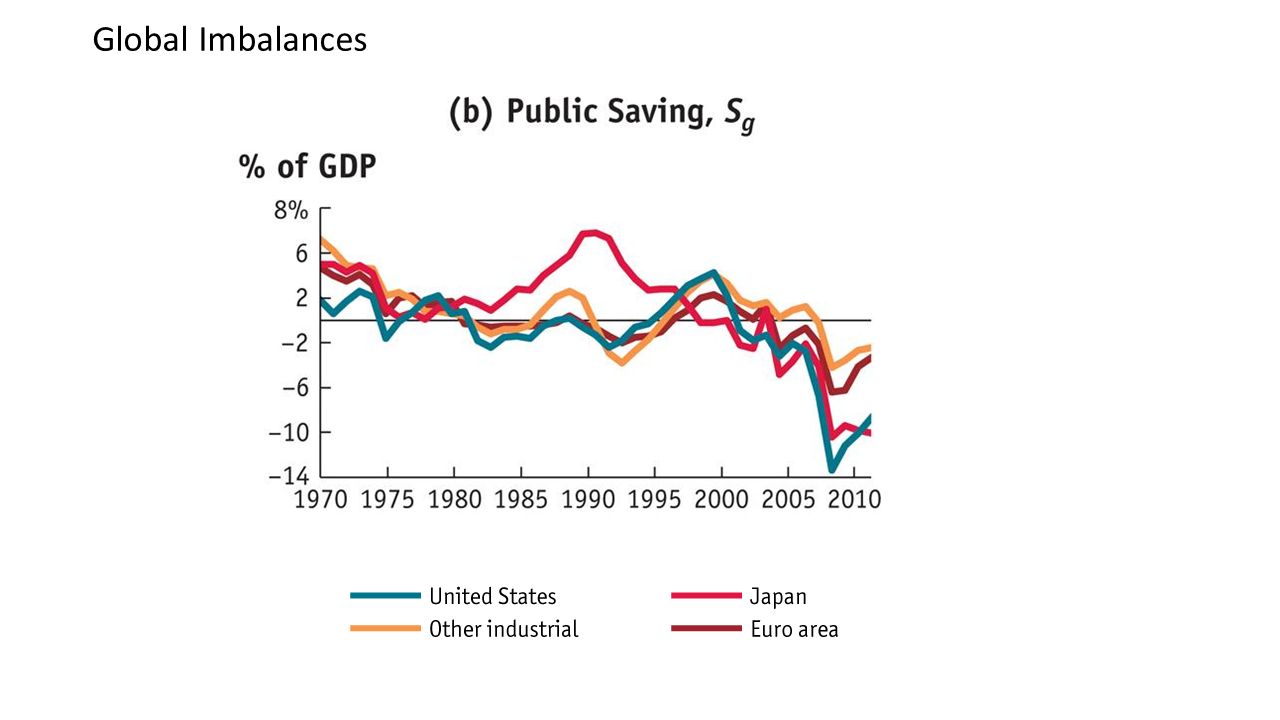
Global Imbalances

34
Private saving S P is that part of after-tax private sector disposable income Y that is not spent on private consumption C. Hence, private saving S P is We define government saving as the difference between tax revenue T received by the government and government purchases G. Hence, government saving S g equals Private saving plus government saving equals total national saving, since Global Imbalances

37
Do government deficits cause current account deficits? Sometimes they do go together, but these “twin deficits” are not inextricably linked, as is sometimes believed. The current account identity is The theory of Ricardian equivalence asserts that a fall in public saving is fully offset by a contemporaneous rise in private saving. What do we find in the data? The current account balance falls about 1/5 to 2/5 of the amount that government deficits rise. Private saving offsets the effects of tax cuts by more than half. Global Imbalances

40
For the world as a whole, saving equals investment. The sum of all current accounts must balance.

41
The Balance of Payments Accounting for Asset Transactions: the Financial Account The financial account records transactions between residents and nonresidents that involve financial assets. This definition covers all types of assets: real assets such as land or structures, and financial assets such as debt (bonds, loans) or equity, issued by any entity (private or public). Subtracting asset imports from asset exports gives the home country’s net overall balance on asset transactions. This is called the financial account, where FA = EX A − IM A. The financial account measures how the country accumulates or decumulates assets through international transactions.
 or equity, issued by any entity (private or public). Subtracting asset imports from asset exports gives the home country’s net overall balance on asset transactions. This is called the financial account, where FA = EX A − IM A. The financial account measures how the country accumulates or decumulates assets through international transactions..")
42
Accounting for Asset Transactions: the Capital Account The capital account (KA) covers two remaining areas of asset movements of minor quantitative significance. The first is the acquisition and disposal of nonfinancial, nonproduced assets (e.g., patents, copyrights, trademarks, franchises, etc.). The second important item in the capital account is capital transfers (i.e., gifts of assets), an example of which is the forgiveness of debts. Capital transfers received by the home country are KA IN and capital transfers given by the home country as KA OUT. The capital account, KA = KA IN − KA OUT, records net capital transfers received.
. The second important item in the capital account is capital transfers (i.e., gifts of assets), an example of which is the forgiveness of debts. Capital transfers received by the home country are KA IN and capital transfers given by the home country as KA OUT. The capital account, KA = KA IN − KA OUT, records net capital transfers received..")
43
Accounting for Home and Foreign Assets From the home perspective, a foreign asset is a claim on a foreign country. When a home entity holds such an asset, it is called an external asset of the home country. When a foreign entity holds such an asset, it is called an external liability of the home country because it represents an obligation owed by the home country to the rest of the world. The export of a home asset is denoted The import of a foreign asset is denoted

44
Accounting for Home and Foreign Assets We can break down the financial account as the sum of the net exports of each type of asset: FA equals the additions to external liabilities (the home-owned assets moving into foreign ownership, net) minus the additions to external assets (the foreign-owned assets moving into home ownership, net).
 minus the additions to external assets (the foreign-owned assets moving into home ownership, net).")
45
How the Balance of Payments Accounts Work Recall that gross national disposable income is In addition, the home economy can free up (or use up) resources in another way: by engaging in net sales (or purchases) of assets. We can calculate these extra resources using our previous definitions:

46
Adding the last two expressions, we arrive at the value of the total resources available to the home country for expenditure purposes. This total value must equal the total value of home expenditure on final goods and services, GNE: We can cancel GNE from both sides of this expression to obtain the important result known as the balance of payments identity or BOP identity: How the Balance of Payments Accounts Work

47
The components of the BOP identity let us see the details behind why the accounts must balance. If an item has a plus sign, it is called a balance of payments credit or BOP credit. If an item has a minus sign, it is called a balance of payments debit or BOP debit. How the Balance of Payments Accounts Work

48
We have to understand one simple principle: every market transaction (whether for goods, services, factor services, or assets) has two parts: (i)If party A engages in a transaction with a counterparty B, then A receives from B an item of a given value, (ii)and in return B receives from A an item of equal value. How the Balance of Payments Accounts Work

49
How the Balance of Payments Accounts Work: examples 1.CA: Café visit on the Left Bank −$110 FA: Café’s claim on AMEX+$110 2.CA: Monterey County red wine exported to Ireland +$36 CA: Guiness imported to United States −$36 3.FA: American Purchase of UK stocks −$10,000 FA: London bank claim against at Wells Fargo +$10,000

50
4.CA: Relief supplies exported to South Sudan +$5,000 CA: U.S. citizen’s charitable gift −$5,000 5.KA: U.S. grant of debt relief−$1,000,000,000 FA: Decline in U.S. external assets$1,000,000,000 The Double-Entry Principle in the Balance of Payments, continued

51
What the Balance of Payments account tells us A country that has a current account surplus is called a (net) lender. By the BOP identity, we know that it must have a deficit in its asset accounts, so like any lender, it is, on net, buying assets (acquiring IOUs from borrowers). For example, China is a large net lender. A country that has a current account deficit is called a (net) borrower. By the BOP identity, we know that it must have a surplus in its asset accounts, so like any borrower, it is, on net, selling assets (issuing IOUs to lenders). As we can see, the United States is a large net borrower.
. For example, China is a large net lender. A country that has a current account deficit is called a (net) borrower. By the BOP identity, we know that it must have a surplus in its asset accounts, so like any borrower, it is, on net, selling assets (issuing IOUs to lenders). As we can see, the United States is a large net borrower..")
52
U.S. Balance of Payments for 2014 Current accountBillions U.S.$ Exports of goods and services and income receipts (credits)3307 Exports of goods and services2343 Goods1633 Services711 Income receipts823 Investment income816 Compensation of employees7 Imports of goods and services and income payments (debits)-3696 Imports of goods and services-2852 Goods-2374 Services-477 Income payments-585 Investment income-569 Compensation of employees-16 Net unilateral transfers-119
3307 Exports of goods and services2343 Goods1633 Services711 Income receipts823 Investment income816 Compensation of employees7 Imports of goods and services and income payments (debits)-3696 Imports of goods and services-2852 Goods-2374 Services-477 Income payments-585 Investment income-569 Compensation of employees-16 Net unilateral transfers-119.")
53
Billions U.S. $ Financial and capital account Capital account0 U.S. owned assets abroad738 U.S. official reserve assets-4 Foreign-owned assets in U.S.977 Foreign official assets100 Statistical discrepancy 150 Balances Balance on current account-390 Balance on goods and services-508 Balance on income238 Balance on financial account240 U.S. Balance of Payments for 2014 (cont.)
.")
54
A country that has a current account surplus is called a (net) lender. By the BOP identity, it must have a deficit in its asset accounts. Any lender, on net, buys assets (acquiring IOUs from borrowers). For example, China is a large net lender. A country that has a current account deficit is called a (net) borrower. By the BOP identity, it must have a surplus in its asset accounts. Any borrower, on net, sells assets (issuing IOUs to lenders). As we can see, the United States is a large net borrower. Interpreting the Balance of Payments
. For example, China is a large net lender. A country that has a current account deficit is called a (net) borrower. By the BOP identity, it must have a surplus in its asset accounts. Any borrower, on net, sells assets (issuing IOUs to lenders). As we can see, the United States is a large net borrower. Interpreting the Balance of Payments.")
55
The current account measures external imbalances in goods, services, factor services, and unilateral transfers. The financial and capital accounts measure asset trades. Surpluses on the current account side must be offset by deficits on the asset side. Similarly, deficits on the current account must be offset by surpluses on the asset side. By telling us how current account imbalances are financed, the balance of payments makes the connection between a country’s income and spending decisions and the evolution of that country’s wealth. What the Balance of Payments account tells us

56
U.S. Balance of Payments, 1960-2012 (current billion US$)
")
57
The level of a country’s external wealth (W) equals A country’s level of external wealth is also called its net international investment position or net foreign assets. It is a stock measure, not a flow measure. If W > 0, home is a net creditor country: external assets exceed external liabilities. If W < 0, home is a net debtor country: external liabilities exceed external assets. The Level of External Wealth

58
There are two reasons a country’s level of external wealth changes over time. 1.Financial flows: As a result of asset trades, the country can increase or decrease its external assets and liabilities. Net exports of home assets cause an equal increase in the level of external liabilities and hence a corresponding decrease in external wealth. 2.Valuation effects: The value of existing external assets and liabilities may change over time because of capital gains or losses. In the case of external wealth, this change in value could be due to price effects or exchange rate effects. Changes in External Wealth

59
Adding up these two contributions to the change in external wealth (ΔW), we find Since −FA = CA + KA, substituting into the first equation gives us Changes in External Wealth
, we find Since −FA = CA + KA, substituting into the first equation gives us Changes in External Wealth")
60
External wealth and total wealth A country’s total wealth is the sum of its capital stock (K = all nonfinancial assets in the home economy) plus amounts owed to home by foreigners (A) minus amounts owed foreigners by home (L): Changes in the value of total wealth are given by
 plus amounts owed to home by foreigners (A) minus amounts owed foreigners by home (L): Changes in the value of total wealth are given by")
61
Increases in K are investment, I. Increases in external wealth, A – L, equal net additions to external assets minus net additions to external liabilities Using the BOP identity, we know that CA + KA + FA = 0 so that minus the financial account –FA must equal CA + KA, so that we can write External wealth and total wealth, continued

62
The BOP identity connects external asset trade and transactions on the current account. Using the current account identity, S = I + CA, we get the equation This says that there are three ways to increase national wealth: save more (S), receive gifts of assets (KA), or realize capital gains (losses) on our net holdings of assets. External wealth and total wealth, continued
, receive gifts of assets (KA), or realize capital gains (losses) on our net holdings of assets. External wealth and total wealth, continued.")
63
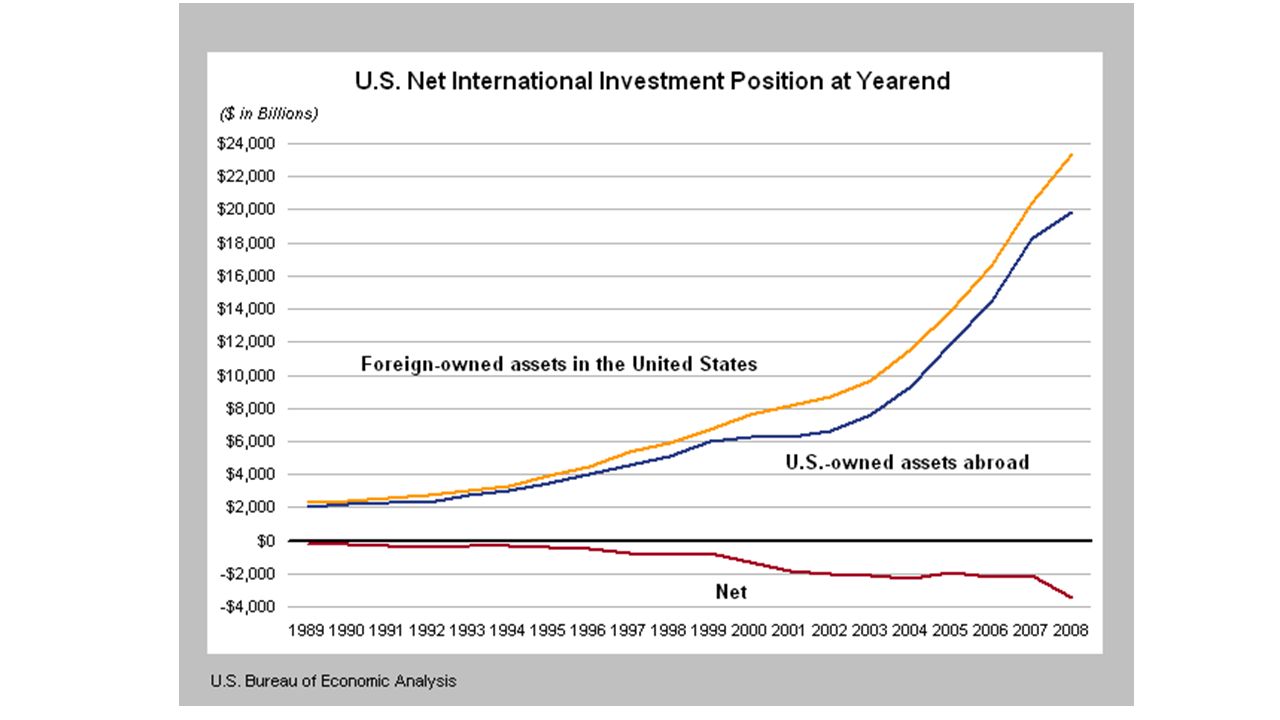
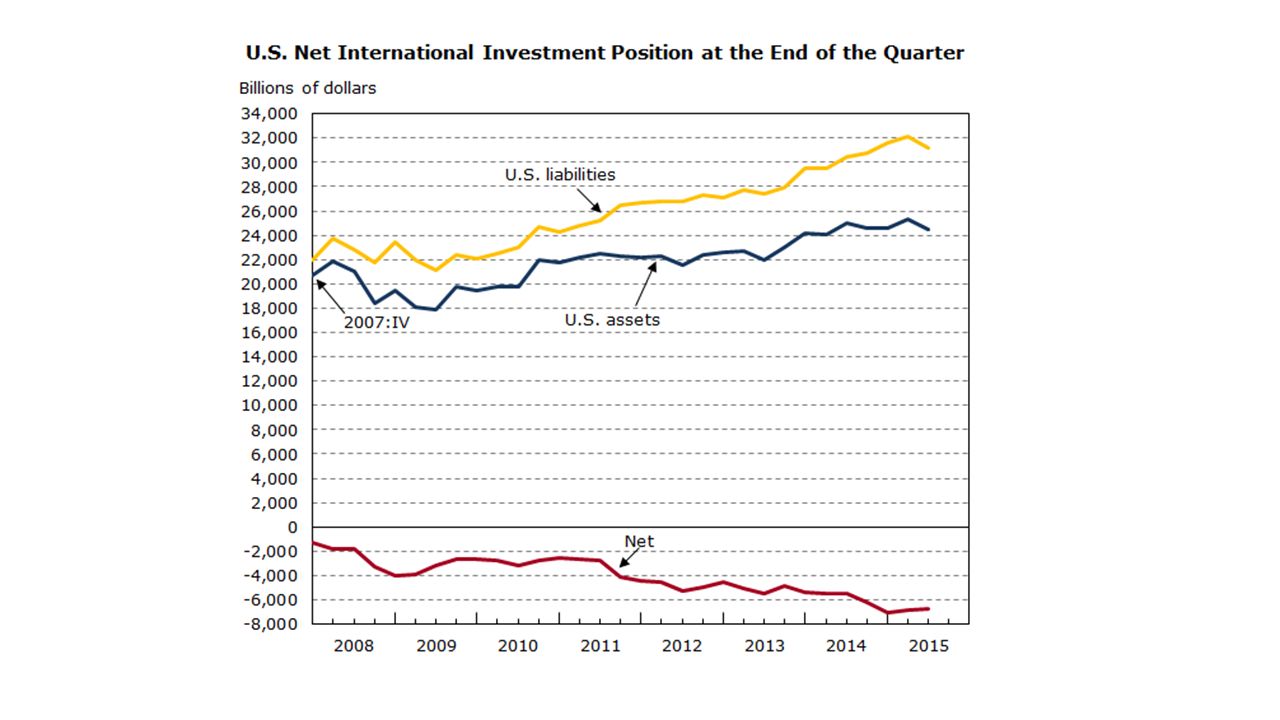
U.S. External Wealth in 2011–2012 U.S. net international investment position for 2012 in billions of dollars. The net result in row 3 (third slide of three) equals row 1 (slide 1) minus row 2 (slide 2).
 equals row 1 (slide 1) minus row 2 (slide 2)..")
64
U.S. External Wealth in 2011–2012

65
The net result in row 3 equals row 1 minus row 2.

66
In the case of the United States, for the past three decades, the financial account has been almost always in surplus, reflecting a net export of assets to the rest of the world to pay for chronic current account deficits. If there were no valuation effects, the change in external wealth between two dates would equal the cumulative net import of assets (negative of the financial account) over the intervening period. But valuation effects (capital gains and losses) can generate a significant difference in external wealth. From 1988 to 2009 these effects reduced U.S. net external indebtedness in 2009 by more than half what financial flows alone would predict. U.S. External Wealth
 over the intervening period. But valuation effects (capital gains and losses) can generate a significant difference in external wealth. From 1988 to 2009 these effects reduced U.S. net external indebtedness in 2009 by more than half what financial flows alone would predict. U.S. External Wealth.")
67
External wealth data tell us the net credit or debit position of a country with respect to the rest of the world. They include data on external assets (foreign assets owned by the home country) and external liabilities (home assets owned by foreigners). A creditor country has positive external wealth, a debtor country has negative external wealth. Countries with a current account surplus (deficit) must be net buyers (sellers) of assets. What External Wealth Tells Us
 and external liabilities (home assets owned by foreigners). A creditor country has positive external wealth, a debtor country has negative external wealth. Countries with a current account surplus (deficit) must be net buyers (sellers) of assets. What External Wealth Tells Us.")
68
An increase in a country’s external wealth results from the net import of assets; conversely, a decrease in external wealth results from the net export of assets. In addition, countries can experience capital gains or losses on their external assets and liabilities that cause changes in external wealth. All of these changes are summarized in the statement of a country’s net international investment position. What External Wealth Tells Us

Similar presentations


 The market value of all final goods and.>")
 The record of a country’s transactions in goods, services and assets with.>")
 The value of all final goods and services.>")


