Download presentation
Presentation is loading. Please wait.

1
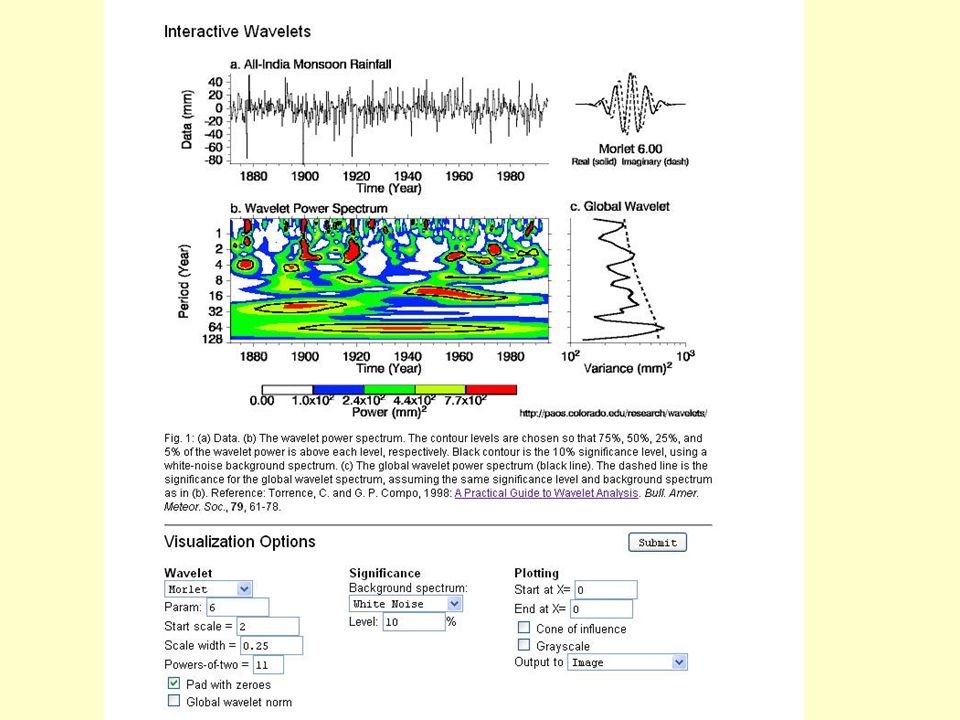
Wavelet Spectral Analysis Ken Nowak 7 December 2010

2
Need for spectral analysis Many geo-physical data have quasi- periodic tendencies or underlying variability Spectral methods aid in detection and attribution of signals in data

3
Fourier Approach Limitations Results are limited to global Scales are at specific, discrete intervals –Per fourier theory, transformations at each scale are orthogonal

4
Wavelet Basics W f ( a,b)= f(x) ( a,b) (x) dx Morlet wavelet with a=0.5 Function to analyze Integrand of wavelet transform |W(a=0.5,b=6.5)| 2 =0 |W(a=0.5,b=14.1)| 2 =.44 b=2b=6.5b=14.1 graphics courtesy of Matt Dillin ∫ Wavelets detect non-stationary spectral components
= f(x) ( a,b) (x) dx Morlet wavelet with a=0.5 Function to analyze Integrand of wavelet transform |W(a=0.5,b=6.5)| 2 =0 |W(a=0.5,b=14.1)| 2 =.44 b=2b=6.5b=14.1 graphics courtesy of Matt Dillin ∫ Wavelets detect non-stationary spectral components")
5
Wavelet Basics Here we explore the Continuous Wavelet Transform (CWT) –No longer restricted to discrete scales –Ability to see “local” features Mexican hat wavelet Morlet wavelet
 –No longer restricted to discrete scales –Ability to see local features Mexican hat wavelet Morlet wavelet")
6
Global Wavelet Spectrum |W f ( a,b)| 2 function Wavelet spectrum a =2 a =1/2 Global wavelet spectrum Slide courtesy of Matt Dillin
| 2 function Wavelet spectrum a =2 a =1/2 Global wavelet spectrum Slide courtesy of Matt Dillin")
7
Wavelet Details Convolutions between wavelet and data can be computed simultaneously via convolution theorem. Wavelet transform Wavelet function All convolutions at scale “a”

8
Analysis of Lee’s Ferry Data Local and global wavelet spectra Cone of influence Significance levels

9
Analysis of ENSO Data Characteristic ENSO timescale Global peak

10
Significance Levels Background Fourier spectrum for red noise process (normalized) Square of normal distribution is chi-square distribution, thus the 95% confidence level is given by: Where the 95 th percentile of a chi-square distribution is normalized by the degrees of freedom.
 Square of normal distribution is chi-square distribution, thus the 95% confidence level is given by: Where the 95 th percentile of a chi-square distribution is normalized by the degrees of freedom.")
11
Scale-Averaged Wavelet Power SAWP creates a time series that reflects variability strength over time for a single or band of scales

12
Band Reconstructions We can also reconstruct all or part of the original data

13
PACF indicates AR-1 model Statistics capture observed values adequately Spectral range does not reflect observed spectrum Lee’s Ferry Flow Simulation

14
Wavelet Auto Regressive Method (WARM) Kwon et al., 2007
 Kwon et al., 2007")
15
WARM and Non-stationary Spectra Power is smoothed across time domain instead of being concentrated in recent decades

16
WARM for Non-stationary Spectra

17
Results for Improved WARM

18
Wavelet Phase and Coherence Analysis of relationship between two data sets at range of scales and through time Correlation =.06

19
Wavelet Phase and Coherence

20
Cross Wavelet Transform For some data X and some data Y, wavelet transforms are given as: Thus the cross wavelet transform is defined as:

21
Phase Angle Cross wavelet transform (XWT) is complex. Phase angle between data X and data Y is simply the angle between the real and imaginary components of the XWT:

22
Coherence and Correlation Correlation of X and Y is given as: Which is similar to the coherence equation:

23
Summary Wavelets offer frequency-time localization of spectral power SAWP visualizes how power changes for a given scale or band as a time series “Band pass” reconstructions can be performed from the wavelet transform WARM is an attractive simulation method that captures spectral features

24
Summary Cross wavelet transform can offer phase and coherence between data sets Additional Resources: http://paos.colorado.edu/research/wavelets/ http://animas.colorado.edu/~nowakkc/wave

Similar presentations


 ● Standard Definitions ● Computing the DFT and FFT ● Sine and cosine wave multiplication.>")
 Discrete Fourier transform.>")


>")


