Download presentation
Presentation is loading. Please wait.

1
Catalyst Come in quietly and get started on the catalyst Describe why this course is trying to prepare us for. Describe why this course is important to you. HW: Come up with three questions that can be answered using one of each type of graph

2
Tickets Tomorrow we will exchange the tickets for snacks

3
Procedure Review Before entering class No hood, ipods, food/beverage Entering the classroom Get the paper(s) Go immediately to your assigned desk Start on the catalyst
 Go immediately to your assigned desk Start on the catalyst")
4
Agenda SWBAT select the appropriate graph Catalyst Pick the best type Notes/Discussion Graphing Exit Ticket

5
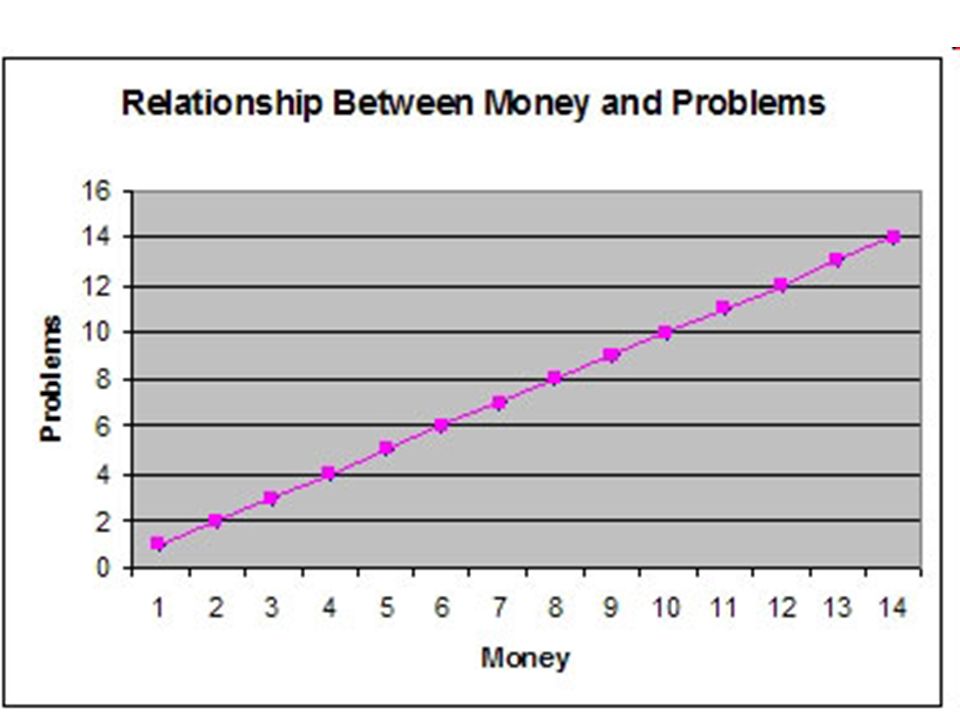
Graphs try to convey a message What are the following graph trying to tell us? $$$$$

10
Graphs Different graphs are used for different reasons!!!!!!!!!!!

11
Three types of Graphs Pie Graphs Line Graph Bar Graphs

12
Procedure Alter – Getting into groups Move Desk to form a group Move ALL DESK even if your group is missing people There should be space between your group and the next one

13
Alacia Deron B. Bryana Torriona Arielle A. Jacob Blake Terriell Darrion D. Darius D. Darion J. Charliethia Joseph Todd Joshua Ashley Brandon Antonio Irvondra Leiana Jasmine Jamie Jamal Tirelle Jeremy Arielle S DoorTeacher’s Desk 654321

14
Marlonika C Ese C Kenneth B Brandi B Joshua B Kevin A Ebony H Tracy G Cory G Ambrika F Tra F Jared D Calbrenlyn J Kev’Ionn Shaquille J LaJuana J Paul J Jennae H Danielle P Jorrance M Sheldon M Kayla L Gerid J Joshua R Clarence R Raquel R Jyi R Curits P LaNell W SeRyan W Keywanda Brandon S Kenicia S DoorTeacher’s Desk 654321 4 th period

15
Andrew D Nicholas B Savanna B Lomar B Teirra A Natosha A Blaine H Myraniesa G Rajari G Jason G Daniel D Fatina D Antonio L Marcel J Jeremy J LaJuana J Jacinta H Navion H Elizabeth R Jamal P Jewels P Lillian M Chris M Latoya T Taya T Rasean S Caleb S Branden R Tre W Shaeh- lynne M Dequan W Rickie V Terrance T DoorTeacher’s Desk 654321 5 th period

16
Procedure Alter – Working in Groups Work on the same problem as people in your group. You either help someone out or Ask for help If you don’t understand something ask your group first BEFORE asking the teacher. Stay on task! **If you copy someone else’s work, BOTH papers will be taken up!!!

17
Check for understanding

18
Explore Activities Think, do the best that you can!! Make sure that you give specific answers AVOID “I just know” or I.D.K. “It looks BETTER” DISCUSS, DISCUSS, DISCUSS!!!

19
Expectations Grading the assignment Complete thoughts require COMPLETE SENTENCES (so does your grade )
")
20
Assignment 1. Choose which graphs best shows the data. 2. Explain your answer in complete sentences 3. In your own words determine when it would be best to use the particular type of graph

21
Notes - Expectations During the notes You must raise your hand to talk Start getting the notes right when the come up on the board

22
Notes Keypoint #1 – Three different types of graphs – pie graph, line graph, bar graph – have different uses

23
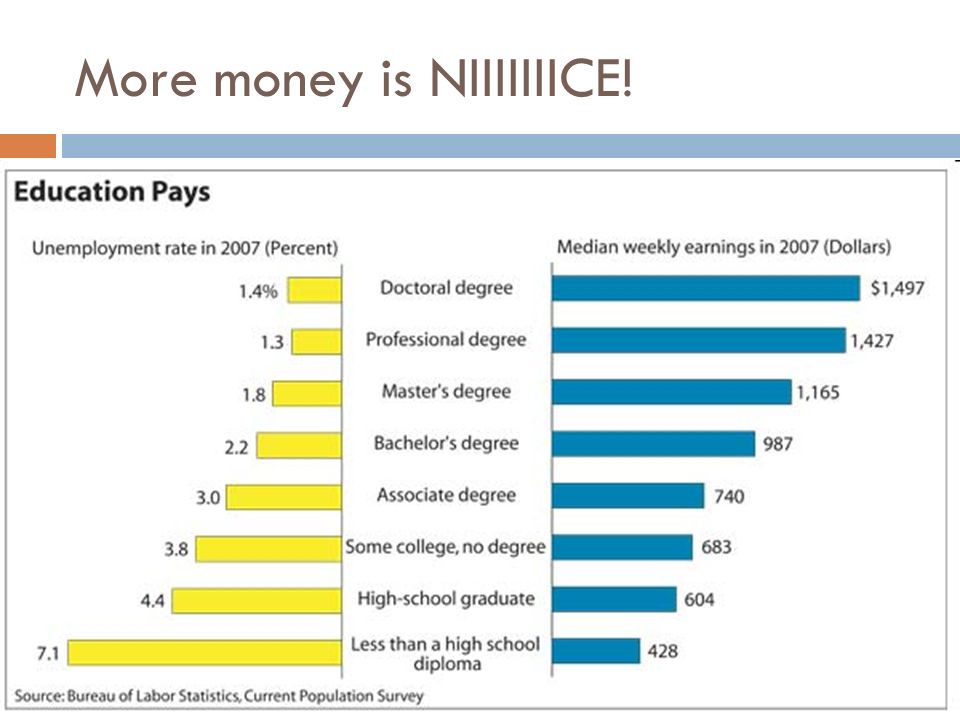
Bar Graph vs Line Graph Bar Graph – graph used for comparing distinct groups Example – which level of education will get you more money

24
Line Graph Line Graph – graph used for a continuous range (no gaps) Best for time!!! Ex. Change in stock market over time

25
Check for Understanding Line or Bar Graph? Comparing the graduation rate of West Bank high schools

26
Check for Understanding Line or Bar Graph? Looking at how the stock market increased or decreased during the day

27
Check for Understanding Line or Bar Graph? Looking at how attendance increased or decreased during the school year

28
Check for Understanding Line or Bar Graph? Comparing the graduation rates between different states

29
Check for Understanding Line or Bar Graph? Comparing the offensive yards between different football games

30
Check for Understanding Line or Bar Graph? Looking how speed changed during a car trip

31
Pie Graph Pie graphs - are best used for showing percentages of a whole Example – the different parts of a budget

32
Independent Assignment Expectations Work individually Do not discuss answers with other people If you have question, raise your hand!

33
Check for Understanding

34
Assignment Identify the type of graph for each of the following sets of data. Sketch the graph Draw on your notes

35
Assignment 1) Percentage of people making above $500/week Doctoral degree – 40% College Degree - 45 % High school degree – 15% 2) Weekly Average income for Doctoral degree - $1500 College degree - $1000 High School degree - $600 3) Years in college school and income 0 years - $600 4 years - $1000 8 years - $1500
 Percentage of people making above $500/week Doctoral degree – 40% College Degree - 45 % High school degree – 15% 2) Weekly Average income for Doctoral degree - $1500 College degree - $1000 High School degree - $600 3) Years in college school and income 0 years - $600 4 years - $1000 8 years - $1500")
36
Exit Ticket Expectations 1) Clear off notes and papers 2) Answer the questions the best that you can you will get credit even if you are wrong!!!! 3) No talking (or you will lose credit) 4) Self-grade (fill in answers and lose credit)
 No talking (or you will lose credit) 4) Self-grade (fill in answers and lose credit).")
37
Exit Ticket What graph would be best for this data? 1) Showing how graduation rates increased over time 2) Showing what percentage of seniors graduate on time 3) Comparing the graduation rates of West Bank High Schools Bonus *What is one ($)big reason that you want to graduate from high school?
 Showing how graduation rates increased over time 2) Showing what percentage of seniors graduate on time 3) Comparing the graduation rates of West Bank High Schools Bonus *What is one ($)big reason that you want to graduate from high school .")
38
Answer ONE of the following question the best you can 1. Why do people have to die? Why don’t we live forever? 2. What separates human from animals? Be specific and answer it from a scientist’s prospective. 3. Why do polar bears and people living in southern Louisiana have to fear the increased usage of energy in Asia? Write in complete sentences! Don’t talk during the Catalyst!

39
More money is NIIIIIIICE!

Similar presentations


, 2011 WAY BACK WEDNESDAY!!! 1. Which is more specific: a genus or a species? 2. Fill in the blanks using the following words:>")


 1. What does a question always end with? 2. What is the achievement gap? 3. What are two examples of the achievement.>")


 answer all questions in the Scavenger Hunt.>")