Download presentation
Presentation is loading. Please wait.

1
STA302: Regression Analysis

2
Statistics Objective: To draw reasonable conclusions from noisy numerical data Entry point: Study relationships between variables

3
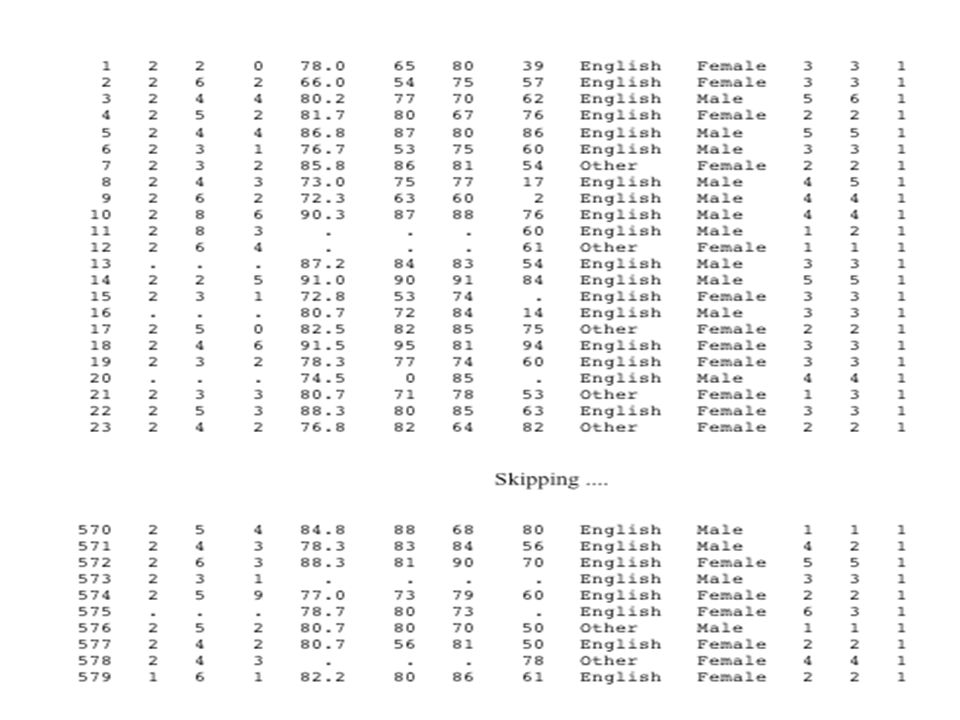
Data File Rows are cases Columns are variables

5
Variables can be Independent: Predictor or cause (contributing factor) Dependent: Predicted or effect
 Dependent: Predicted or effect")
6
Simple regression and correlation Simple means one IV DV quantitative IV usually quantitative too

7
Simple regression and correlation High School GPAUniversity GPA 8886 7873 8789 8681 7767 ……

8
Scatterplot

9
Least squares line

10
Correlation coefficient r -1 ≤ r ≤ 1 r = +1 indicates a perfect positive linear relationship. All the points are exactly on a line with a positive slope. r = -1 indicates a perfect negative linear relationship. All the points are exactly on a line with a negative slope. r = 0 means no linear relationship (curve possible). Slope of least squares line = 0 r 2 = proportion of variation explained
. Slope of least squares line = 0 r 2 = proportion of variation explained.")
11
r = 0.004

12
r = 0.112

13
r = 0.368

14
r = 0.547

15
r = 0.733

16
r = - 0.822

17
r = 0.025

18
r = - 0.811

19
Why -1 ≤ r ≤ 1 ?

20
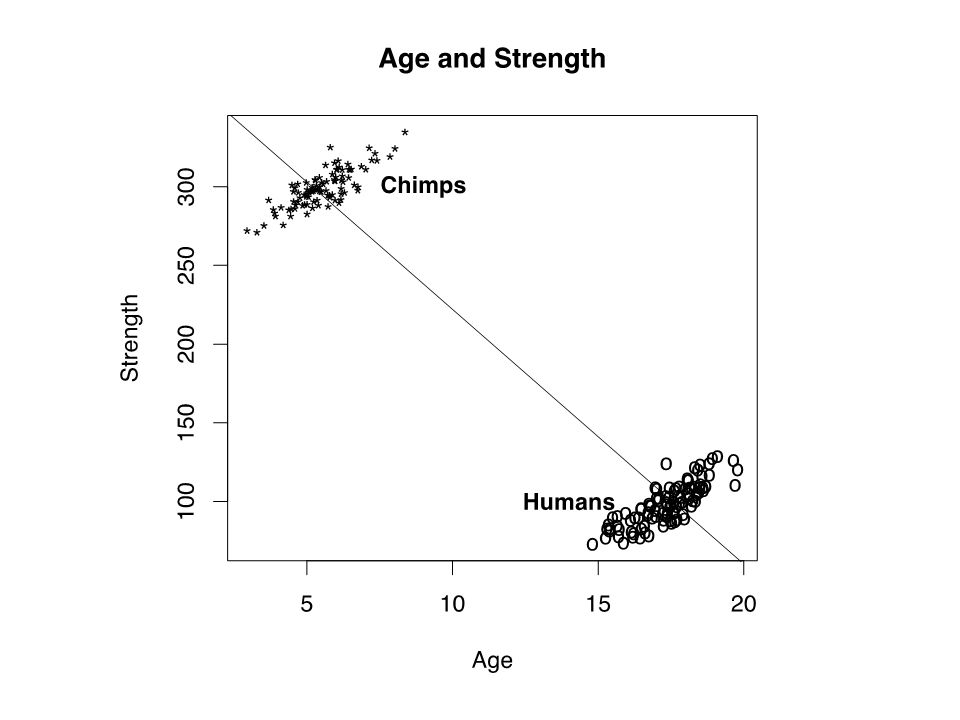
One Independent Variable at a Time Can Produce Misleading Results The standard elementary tests all have a single independent variable, so they should be used with caution in practice. Example: Artificial and extreme, to make a point Suppose the correlation between Age and Strength is r = -0.96

22
Need multiple regression

23
Copyright Information This slide show was prepared by Jerry Brunner, Department of Statistical Sciences, University of Toronto. It is licensed under a Creative Commons Attribution - ShareAlike 3.0 Unported License. Use any part of it as you like and share the result freely. These Powerpoint slides are available from the course website: http://www.utstat.toronto.edu/~brunner/oldclass/302f13

Similar presentations