Download presentation
Presentation is loading. Please wait.

2
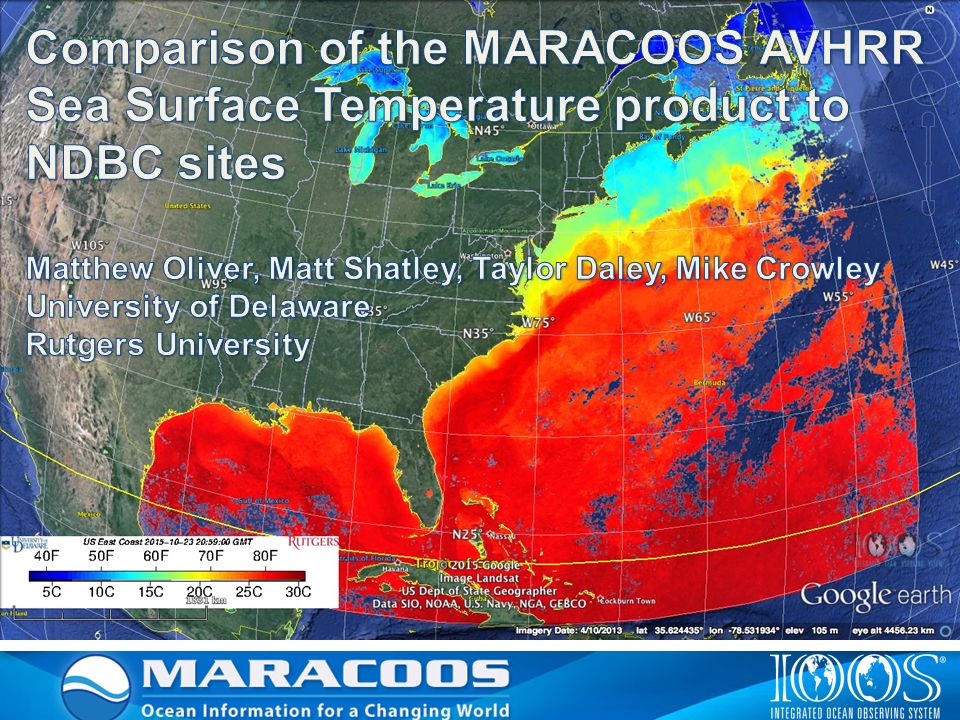
MARACOOS - International Constellation of Satellites – Since 1992 X-Band (installed 2003) L-Band (installed 1992) Sea Surface Temperature - SST Ocean Color <River Plumes Ocean Blooms> Combined SST & Color Water Mass Boundaries
 L-Band (installed 1992) Sea Surface Temperature - SST Ocean Color <River Plumes Ocean Blooms> Combined SST & Color Water Mass Boundaries")
3
The Problem with AVHRR - Clouds Both temperature and edge effects

4
Testing for cloud contamination (Three tests) Test 1: Time Test: A measurement fails the time test if it is more than 2 degrees cooler than the mean of the satellite passes in the previous 72 hrs. Test 2: Climatology Test: A measurement fails the climatology test if the temperature is more than 5 degrees colder than the climatologies calculated by NSIPP AVHRR Pathfinder and Erosion Global 9km SST Climatology (Casey, Cornillon) A description of this climatology can be found at ftp://podaac.jpl.nasa.gov/pub/documents/dataset_docs/nsipp_climatology.htm Test 3: Sequential Test: In this test, the previous 72 hours or satellite passes are first passed through a climatology test, then passed through the time test. It is a sequential test, rather than two independent tests. If any measurement is fails one of these three tests, all neighboring measurements within 3km are also automatically failed.
 A description of this climatology can be found at ftp://podaac.jpl.nasa.gov/pub/documents/dataset_docs/nsipp_climatology.htm Test 3: Sequential Test: In this test, the previous 72 hours or satellite passes are first passed through a climatology test, then passed through the time test. It is a sequential test, rather than two independent tests. If any measurement is fails one of these three tests, all neighboring measurements within 3km are also automatically failed..")
5
Temporally and Spatially interpolated climatology Coastal Pixels are nearest-neighbor interpolated

6
Coding of the Tests 0: Passed all tests 1: Failed the time test 2: Failed the clim. test 4: Failed the seq. test. 3: Failed test 1 and 2 5: Failed test 1 and 4 6: Failed test 2 and 4 7: Failed test 1, 2, and 4 Pixels that failed time test 1, 3, 5, 7 Pixels that failed clim test 2, 3, 6, 7 Pixels that failed seq. test 4, 5, 6, 7 Data compression

7
The Problem with AVHRR - Clouds Both temperature and edge effects

8
Eliminating Flag >= 7 1: Failed the time test 2: Failed the clim. test 4: Failed the seq. test. It had to fail every test

9
Eliminating Flag >= 6 2: Failed the clim. test 4: Failed the seq. test. Or 1: Failed the time test 2: Failed the clim. test 4: Failed the seq. test.

10
Eliminating Flag >= 5 1: Failed the time. test 4: Failed the seq. test. Or 2: Failed the clim. test 4: Failed the seq. test. Or 1: Failed the time test 2: Failed the clim. test 4: Failed the seq. test.

11
Eliminating Flag >= 4 4: Failed the seq. test. Or 1: Failed the time. test 4: Failed the seq. test. Or 2: Failed the clim. test 4: Failed the seq. test. Or 1: Failed the time test 2: Failed the clim. test 4: Failed the seq. test.

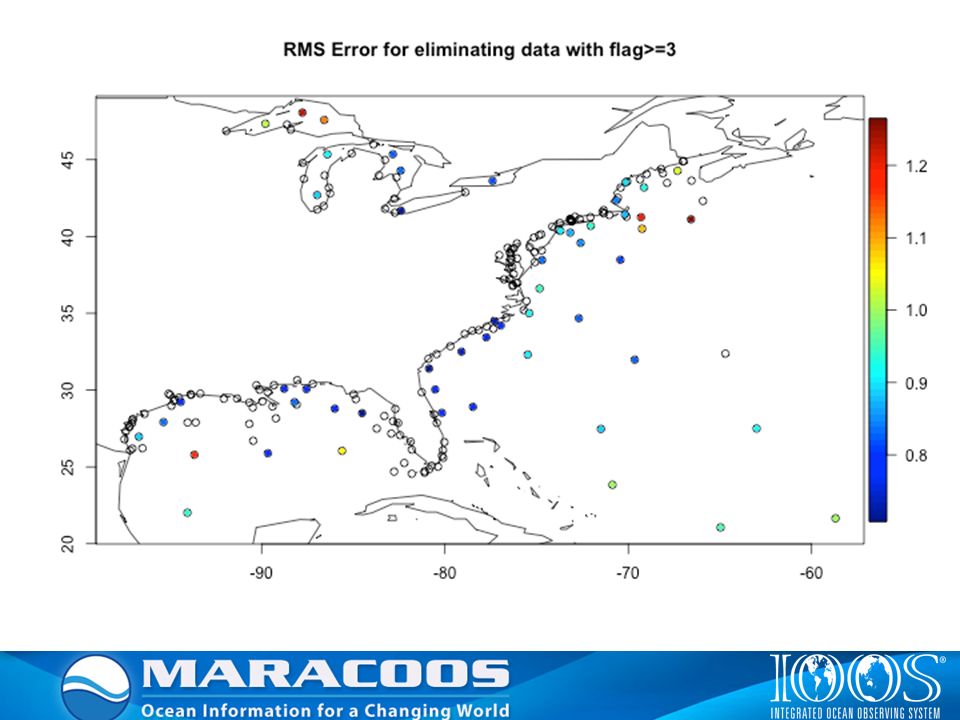
12
Eliminating Flag >= 3 1: Failed time test 2: Failed clim test Or 4: Failed the seq. test. Or 1: Failed the time. test 4: Failed the seq. test. Or 2: Failed the clim. test 4: Failed the seq. test. Or 1: Failed the time test 2: Failed the clim. test 4: Failed the seq. test.

13
Eliminating Flag >= 2 2: Failed clim test Or (3) 1: Failed time test 2: Failed clim test Or (4) 4: Failed the seq. test. Or (5) 1: Failed the time. test 4: Failed the seq. test. Or (6) 2: Failed the clim. test 4: Failed the seq. test. Or (7) 1: Failed the time test 2: Failed the clim. test 4: Failed the seq. test.
 1: Failed the time. test 4: Failed the seq. test. Or (6) 2: Failed the clim. test 4: Failed the seq. test. Or (7) 1: Failed the time test 2: Failed the clim. test 4: Failed the seq. test..")
14
Eliminating Flag >= 1 1: Failed time test Or (2) 2: Failed clim test Or (3) 1: Failed time test 2: Failed clim test Or (4) 4: Failed the seq. test. Or (5) 1: Failed the time. test 4: Failed the seq. test. Or (6) 2: Failed the clim. test 4: Failed the seq. test. Or (7) 1: Failed the time test 2: Failed the clim. test 4: Failed the seq. test.
 1: Failed the time. test 4: Failed the seq. test. Or (6) 2: Failed the clim. test 4: Failed the seq. test. Or (7) 1: Failed the time test 2: Failed the clim. test 4: Failed the seq. test..")
15
How does this compare to available platforms and NDBC bouys? SST data was downloaded for 205 NDBC sites from http://coastwatch.pfeg.noaa.gov/erddap/tabledap/ndbcSosWTemp.subset http://coastwatch.pfeg.noaa.gov/erddap/tabledap/ndbcSosWTemp.subset (Jan 1, 2006 – September 14, 2014) The data on this site is “initially quality controlled.” We further quality controlled the data by visually inspecting each data set. The downloaded buoy data set was hourly, but we interpolated each SST measurement to the satellite pass time
 The data on this site is initially quality controlled. We further quality controlled the data by visually inspecting each data set. The downloaded buoy data set was hourly, but we interpolated each SST measurement to the satellite pass time.")
16
How does this compare to all platforms?

17
How does this compare to NDBC Buoys?

18
What does this look like with buoy records? Unfiltered SST (red) compared to Buoy (black)
 compared to Buoy (black)")
20
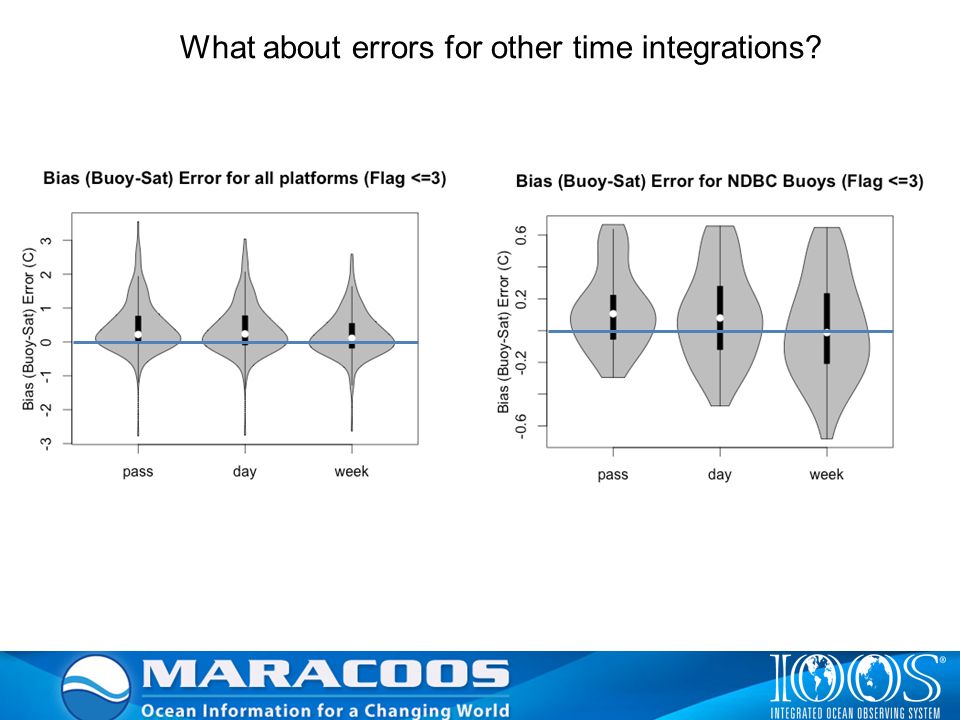
What about errors for other time integrations?

22
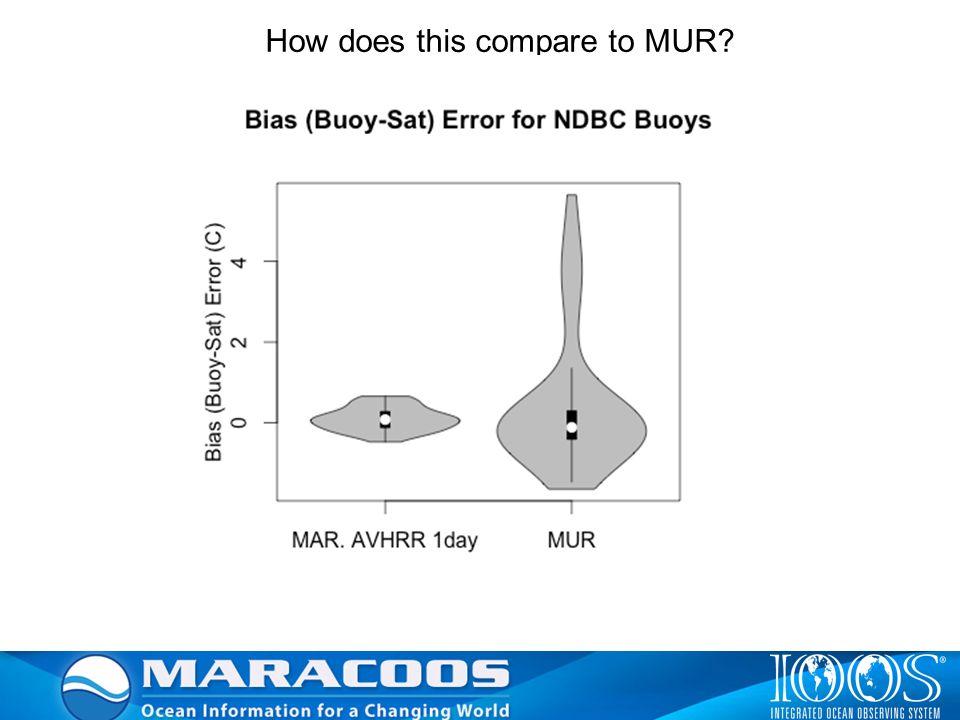
How does this compare to MUR? Multi-scale Ultra-high Resolution (MUR) Sea Surface Temperature (SST) Analysis Gap-filled, ~1km res, 24 hr delay. https://podaac.jpl.nasa.gov/Multi-scale_Ultra-high_Resolution_MUR-SST MARACOOS AVHRR 1-day MUR 1-day
 Sea Surface Temperature (SST) Analysis Gap-filled, ~1km res, 24 hr delay. MARACOOS AVHRR 1-day MUR 1-day.")
23
How does this compare to MUR? MUR better MAR. AVHRR better MUR better MAR. AVHRR better

24
How does this compare to MUR?

26
Conclusions MARACOOS AHVRR de-clouded products 1.Available at 1-km in real time at the pass, 1, 3, 7 day aggregations 2.Individual passes are flagged for clouds 3.Individual users can opt to use different combinations of the tests 4.Comparisons to in situ records vary, but RMS errors to NDBC buoys ~0.7 deg C. JPL MUR 1km product 1.Available at 1-km at 1day aggregation with 24 hour delay 2.Data are gap filled with multiple platforms 3.Does not appear to preserve all hi-resolution features 4.Comparisons to in situ records vary, but RMS errors to NDBC buoys ~0.5 deg C. 5.More variation in bias across platforms

27
MARACOOS Cloud Filtered SST Resources http://tds.maracoos.org/thredds/SST.html http://tds.maracoos.org/thredds/MODIS.html http://modata.ceoe.udel.edu/web_kmzs/ Soon to include MUR!! We are working with JPL for a MARACOOS subset that will be served via this portal for the MABPOM community Ask me for the error tables.

Similar presentations


 and Valborg Byfield (NOCS ) Advanced DevCoCast Training.>")
 for Real-Time Forecasting in Prince William Sound and Adjacent Alaska Coastal Waters YI CHAO,>")


 United States NOAA POES AVHRR Product: 1km sea surface temperatures (SST), de-clouded.>")


 Dudley B. Chelton (Oregon State University)>")

 Dudley B. Chelton (Oregon State University) Thomas M. Smith (NOAA, STAR)>")
 Analyses for Climate NOAA’s National Climatic Data Center Asheville, NC Thomas M. Smith Richard W. Reynolds Kenneth.>")

