Download presentation
Presentation is loading. Please wait.

1
Bill Roenigk Roenigk Consulting July 13, 2015 Amelia Island, Florida

3
Consumption = Disappearance We Eat What We Produce Minus Exports/Plus Imports and Adjustment for Inventory Change

4
Over 90 Percent of Chicken Consumption Can Be Explained by Price and Disposable Consumer Income. Corn for Ethanol Experience from 2006 through 2013 and Weak U.S. Economy Re-Confirmed this Conclusion.

5
USDA’s Three Measures of Chicken Consumption Weight 2015Difference From MeasurementPounds Carcass Weight (estimated)---------------- % --------------- Boneless62.860 Retail*90.086 Carcass104.7 * Most often reported by USDA Note: “Chicken” includes young meat chicken and (broilers) and “other” chicken (spent fowl)
 % Boneless Retail* Carcass104.7 * Most often reported by USDA Note: Chicken includes young meat chicken and (broilers) and other chicken (spent fowl)")
6
Per Capita Chicken Consumption 1970 to Forecast 2016 Source: USDA

9
When Chicken Consumption Surpassed Pork and Beef? PorkBeef --------------------------------------- weight basis ---------------------------------------- RetailBonelessRetailBoneless Year1982199419922010 Source: USDA/ERS

10
Consumption ≠ Demand

11
Demand: Pounds Consumed Price Consumers Paid Outcome Compared with Expectation (Elasticity)
")
12
U.S. Monthly Domestic Retail Meat Demand Ron Plain, University of Missouri PorkBeefYoung ChickenTurkeyAll 4 Meats Current Month Last 12 Months Current Month Last 12 Months Current Month Last 12 Months Current Month Last 12 Months Current Month Last 12 Months Percent Change in Retail Demand From 1 Year Earlier Mar 140.94.91.81.37.83.2-3.90.03.22.7 Apr 146.75.04.01.03.33.4-8.1-0.74.12.7 May 1410.05.66.81.5-1.63.1-4.6-0.74.62.9 Jun 143.85.41.61.50.53.1-3.1-0.61.72.9 Jul 143.75.20.71.5-2.12.9-10.0-1.20.22.8 Aug 143.04.99.32.0-1.32.3-3.9-1.44.02.7 Sep 149.35.611.42.9-1.91.4-10.0-2.65.62.9 Oct 148.15.78.73.3-0.60.7-1.9-2.75.22.9 Nov 147.25.811.04.16.41.1-9.8-4.77.33.2 Dec 146.85.810.35.12.50.7-7.1-6.16.33.4 Jan 1515.06.716.36.913.82.5-9.7-6.514.14.9 Feb 1511.67.212.57.93.82.6-6.2-6.58.95.4 Mar 1512.38.17.68.44.12.2-1.4-6.3+7.45.8 Apr 152.27.75.18.56.22.51.8-5.54.65.8

13
U.S. Annual Domestic Retail Meat Demand PorkBeefYoung Chicken-TurkeyAll 4 Meats PercentIndexPercentIndexPercentIndexPercentIndexPercentIndex Change1998Change1998Change1998Change1998Change1998 Year Ago100Year Ago100Year Ago100Year Ago100Year Ago100 1998100 19990.4100.42.8102.84.9104.9-2.797.32.6102.6 2000-0.2100.22.5105.4-1.5103.4-1.196.30.5103.1 2001-0.799.53.2108.7-1.2102.13.699.80.9104 20020.399.8-0.2108.66.2108.4-2.497.41.7105.8 200398.83.9112.9-0.6107.796.41106.8 20040.699.46.5120.26.6114.9-4.192.54.8111.9 2005-3.895.6-2.71170.3115.2-5.187.7-2109.7 2006-3.792.1-3.6112.7-7.8106.21.589-4.8104.4 20071.993.80112.8-0.31063.4920.5105 2008-490.1-4.5107.7-1.1104.8596.6-3101.8 20091.491.4-2.7104.8-2.4102.35.8102.2-1.5100.3 201090.5-1.4103.30.9103.3-0.4101.8-0.599.9 20111.191.50.8104.1-1.2102.10.9102.70.4100.3 2012-0.6911.3105.50.8102.9-0.4102.40.5100.7 20134.695.21.7107.33.5106.50.6102.93103.7 20145.9100.84.9112.60.5107.1-6.196.73.4107.3 Ron Plain, University of Missouri U.S. Annual Domestic Retail Meat Demand

14
Total US – Fresh Meat Sales April 2015 Dollars – Total *Other includes Exotic, Non Meat and Unknown. Sourced from FreshLook data, categorized by the VMMEAT® System Four Weeks Ending 04/26/15 4 WEEKS13 WEEKS52 WEEKS Class03/30/15-04/26/15% ChangeWE 04/26/15% ChangeWE 04/26/15% Change TOTAL MEAT$3,745,481,375+ 2.5%$12,041,933,846+ 5.4%$48,671,130,047+ 6.4% Beef$1,781,419,933+ 3.9%$6,021,368,088+ 6.2%$23,880,828,635+ 6.7% Chicken$892,058,810+ 5.2%$2,959,060,559+ 5.7%$11,676,704,401+ 6.3% Pork$815,656,674- 0.8%$2,297,902,048+ 4.7%$9,340,375,880+ 5.8% Turkey$173,244,091+ 0.5%$539,953,666+ 4.2%$2,815,970,775+ 5.3% Lamb$49,126,346- 3.4%$114,628,943+ 6.0%$386,027,454+ 9.5% Veal$5,994,263- 15.6%$22,018,096- 9.1%$89,881,417+ 0.2% Other*$27,981,258- 23.9%$87,002,445- 24.7%$481,341,485+ 7.7%

15
Pounds - Total 4 WEEKS13 WEEKS52 WEEKS Class03/30/15-04/26/15% ChangeWE 04/26/15% ChangeWE 04/26/15% Change TOTAL MEAT1,089,178,886- 1.1%3,400,869,454- 1.4%14,159,367,976- 2.9% Beef325,846,289- 5.5%1,128,593,717- 7.0%4,579,589,836- 7.8% Chicken371,264,841+ 1.8%1,232,147,402+ 1.3%4,933,538,056+ 2.4% Pork317,561,955+ 2.8%823,869,876+ 4.5%3,098,732,968- 4.8% Turkey58,823,286- 6.2%173,385,432- 0.4%1,346,612,890+ 1.0% Lamb7,255,632- 8.9%16,259,386+ 0.1%53,812,431+ 5.0% Veal853,486- 21.9%3,207,869- 13.9%13,407,166- 0.5% Other*7,573,397- 34.5%23,405,773- 38.7%133,674,629- 10.4%

16
Average Price/Pound 4 WEEKS13 WEEKS52 WEEKS Class03/30/15-04/26/15% ChangeWE 04/26/15% ChangeWE 04/26/15% Change TOTAL MEAT$3.44+ 3.7%$3.54+ 6.9%$3.44+ 9.6% Beef$5.47+ 9.9%$5.34+ 14.2%$5.21+ 15.7% Chicken$2.40+ 3.4%$2.40+ 4.3%$2.37+ 3.8% Pork$2.57- 3.6%$2.79+ 0.2%$3.01+ 11.1% Turkey$2.95+ 7.1%$3.11+ 4.6%$2.09+ 4.2% Lamb$6.77+ 6.0%$7.05+ 5.9%$7.17+ 4.4% Veal$7.02+ 8.0%$6.86+ 5.5%$6.70+ 0.7% Other*$3.69+ 16.2%$3.72+ 22.7%$3.60+ 20.2%

17
Total US – Fresh Meat Feature and Promotion April 2015 Feature Outlet Count - Total 4 WEEKS13 WEEKS52 WEEKS Class3/30/15 - 4/26/15% ChangeWE 4/26/15% ChangeWE 4/26/15% Change TOTAL MEAT 967,5124.4%3,066,1110.3%12,006,354-8.1% Beef361,6003.9%1,201,3108.1%4,416,475-10.7% Chicken246,8371.8%791,722-12.0%3,459,069-5.0% Lamb29,800-18.3%70,080-6.9%242,380-17.9% Pork237,24022.8%751,4205.3%2,713,100-9.5% Turkey87,625-14.1%237,4291.0%1,125,4601.9% Veal4,410-14.7%14,150-40.4%49,870-41.5% Class – Fresh meat cuts, ground meat and poultry parts. Excludes ham, bacon, franks, sausage, lunch meats, prepared products and offal. Feature Outlet Count – Total of sample stores with ad. Feature Outlet Share – Outlets with ad as a percent to the total ad outlets. Feature Average Price – Total outlets with ad times the ad price divided by the ad count. Promotion Percent on Sale – Feature sales as a percent to total sales. Promotion Weighted Sale Price – Feature sales divided by feature pounds. Source by USDA Market News and FreshLook Marketing, categorized by the VMMEAT® System

18
Feature Outlet Share - Total 4 WEEKS13 WEEKS52 WEEKS Class3/30/15 - 4/26/15% ChangeWE 4/26/15% ChangeWE 4/26/15% Change TOTAL MEAT 100.0% Beef37.4%-0.2%39.2%2.9%36.8%-1.0% Chicken25.5%-0.6%25.8%-3.6%28.8%0.9% Lamb3.1%-0.9%2.3%-0.2%2.0%-0.2% Pork24.5%3.7%24.5%1.2%22.6%-0.3% Turkey9.1%-1.9%7.7%0.1%9.4%0.9% Veal0.5%-0.1%0.5%-0.3%0.4%-0.2%

19
Feature Average Price 4 WEEKS13 WEEKS52 WEEKS Class3/30/15 - 4/26/15% ChangeWE 4/26/15% ChangeWE 4/26/15% Change TOTAL MEAT $4.162.7%$4.189.3%$4.0910.1% Beef$6.056.8%$5.9810.9%$5.8915.1% Chicken$2.614.4%$2.635.0%$2.706.7% Lamb$6.991.1%$7.195.0%$7.274.5% Pork$2.91-8.5%$2.911.7%$3.1211.7% Turkey$2.888.8%$3.110.3%$2.791.9% Veal$8.7815.0%$8.5824.3%$8.1013.7%

20
Promotion – Percent on Sale And Weighted Sale Price 4 WEEKS13 WEEKS52 WEEKS Class3/30/15 - 4/26/15WE 4/26/15 TOTAL MEAT 25.9%$3.1226.4%$3.1225.9%$2.93 Beef25.1%$5.2825.5%$5.0725.0%$5.00 Chicken23.4%$1.9324.7%$1.9524.4%$1.96 Lamb33.6%$2.4535.5%$2.5431.3%$2.71 Pork19.1%$2.2817.2%$2.4527.3%$1.31 Turkey38.2%$5.6727.6%$6.0121.9%$6.04 Veal12.4%$6.5612.7%$6.4515.0%$6.08

21
Retail Beef Performance FreshLook Marketing and USDA Market News April 2015 Highlights can be downloaded at: http://www.beefretail.org/CMDocs/BeefRetail2/Sales%20Data/Sales %20Featuring/4-15-Top-Line-Final.pdf

22
USDA Chicken Weight Category 4.25 pounds & under: normally marketed bone-in into fastfood/foodservice sectors; may include Cornish hens. 4.26 pounds to 6.25 pounds: normally marketed into retail grocery sector in tray-pack or bagged forms. Source: USDA/Agricultural Marketing Service

23
USDA Chicken Weight Category 6.26 pounds to 7.75 pounds: normally marketed either into retail grocery sector in tray-pack and quick-frozen form or further processed and marketed into various sectors. 7.76 pounds & heavier: normally marketed deboned or as roasters/roasting chickens. Source: USDA/Agricultural Marketing Service Cont’d.

24
Young Meat Chicken Slaughtered Under Federal Inspection by Liveweight Category 4.25 pounds & under 4.26 to 6.25 pounds 6.26 to 7.75 liveweight 7.76 pounds & heavier Total Number of Chickens Year-------------------------- percent ------------------------- --000-- 201426.434.219.519.97,962,523 201326.935.519.418.37,968,913 201224.240.719.315.67,874,506 201123.042.919.115.18,085,700 201024.147.216.412.38,334,894 200924.950.513.910.78,117,428 200825.448.515.111.08,388,473 200726.549.516.27.88,402,576 200628.249.713.98.28,343,196 200529.347.916.76.18,351,179 Source: USDA/Agricultural Marketing Service

25
Share and Change in Number of Chickens and Weight for Liveweight Categories 4.25 & under 4.26 to 6.25 6.26 to 7.75 7.76 & heavier Year numberweightnumberweightnumberweightnumberweight 201426.416.634.231.319.522.519.929.6 200529.320.647.948.116.721.76.19.6 Change From 2005 to 2014 ---------------------------------- percent ---------------------------------------- -10-19-29-35174226208

28
What Factors Could Accelerate/Decelerate Consumption Trend Line Price/Cost State of U.S. Economy in Future years Impact of Competing Meats New Products “Events”

29
Thank You for Your Attention! Any Questions?

Similar presentations


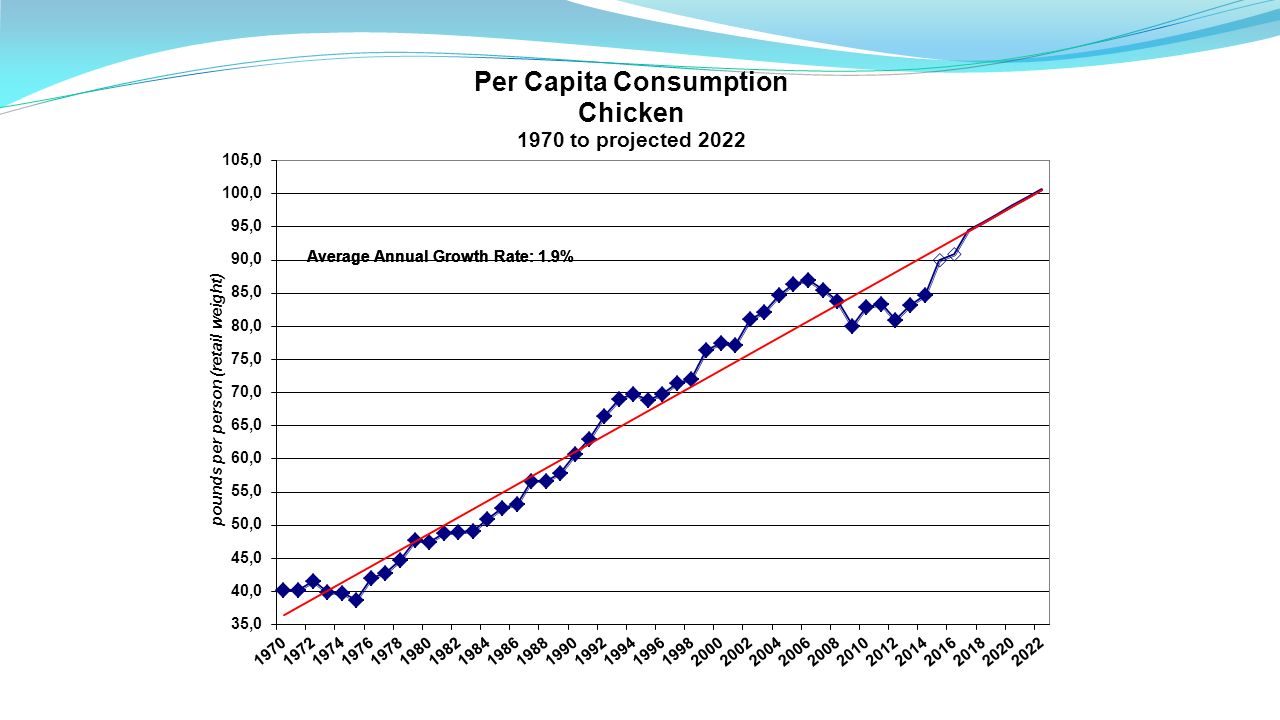


 CHART DATA PRACTICE Meat and Poultry Yellow Pages PAGE 64.>")


. Source: USDA/ERS 10 monthly records in 2014.>")


