Download presentation
Presentation is loading. Please wait.

1
Category Project: Liquid Tea Jason Call & Lauren Dockery

2
Overview Who buys tea? Category Role Leading Brands Audit Summary Store Demographics Strategy and Tactics 2007 Audit Comparison

3
Category Snapshot ★ Enjoyed by all lifestyles

4
Demographics Variables and Measures Demographic Variables % Total $Index Race of Head of Household White67.2%97 Black13.1%109 Hispanic13.7%111 Asian3.9%91 Other2.1%97 Number of Persons 1 Person17.2%63 2 Persons32.8%101 3 Persons19.0%117 4 Persons16.7%126 5+ Persons14.4%130 Household Income Under $10,0007.1%90 $10,000 - $19,9999.3%80 $20,000 - $29,9999.8%86 $30,000 - $39,9999.5%90 $40,000 - $49,9998.8%95 $50,000 - $74,99918.1%100 $75,000 - $99,99913.5%115 $100,000 - $149,99913.7%120 $150,000 or More10.3%128

5
Category Role Sales Volume (US) = $1.1 Billion Sales Volume (West South Central) = $100 Million From our data: Average $ Gross Margin = $0.87
 = $1.1 Billion Sales Volume (West South Central) = $100 Million From our data: Average $ Gross Margin = $0.87")
6
Product Penetration #1 #2 #3

7
New Products in Region since 2007 ●Arizona Rx Energy ●Honest Tea ●Lipton Pure Leaf ●Milo’s ●Tazo ●Turkey Hill

8
Leading Brands: Total Sales US: 1. Lipton - $430M 2. Arizona - $230M 3. Snapple - $180M Region: 1. Lipton - $52M 2. Red Diamond - $19M 3. Arizona - $14M 2/3 of total sales

9
Leading Brands: % Repeat Buyers US: 1. Milo’s – 56.7% 2. Arizona – 55.3% 3. Lipton – 54.1% Region: 1. Red Diamond – 55.1% 2. Lipton – 54.8% 3. Sweet Leaf – 44.7%

10
Leading Brands: Loyalty US: 1. Lipton – 54.4 2. Red Diamond – 49.2 3. Arizona – 41.6 Region: 1. Lipton – 68.0 2. Red Diamond – 63.4 3. Sweet Leaf – 39.2

11
Deal or No Deal? Most probable tea buyers? Struggling Urban households Modest working households Older couples Families with children and non-working spouse Market Related Factors: Moderate purchasing cycle (30 days) High household penetration High loyalty Recent recession
 High household penetration High loyalty Recent recession.")
12
Audit Summary Store#SKU% of Category Walmart Supercenter4532.85% Flash Market (Sp)118.03% Flash Market (Fay)1712.41% Phillips 661510.95% Walmart NM (Fay)2921.17% Walmart NM (Sp)6144.53% Harps6345.99% Murphy Express118.03%
118.03% Flash Market (Fay) % Phillips % Walmart NM (Fay) % Walmart NM (Sp) % Harps % Murphy Express118.03%")
13
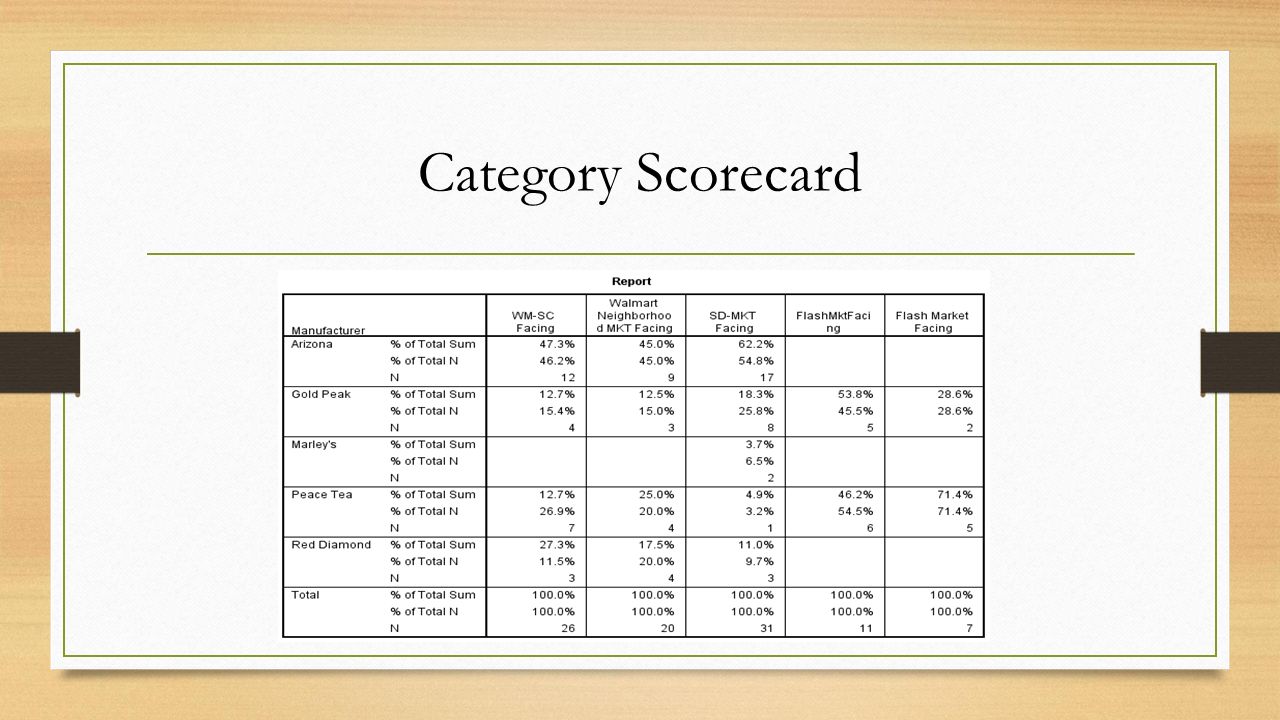
Category Scorecard

16
Neighborhood Market #5738Harps #124 Demography 2 mile Ring % HHsHHs Index% HHsHHs Index Race of Head of Household White42.9%6283.4%121 Black3.7%316.8%57 Hispanic42.9%3424.7%38 Asian8.1%1902.4%56 Other2.4%1062.7%118 Number of Persons 1 Person20.4%7536.3%134 2 Persons20.2%6235.1%108 3 Persons15.7%9714.8%91 4 Persons15.7%1198.4%63 5+ Persons27.9%2515.4%49 Household Income Under $10,00011.1%14520.2%264 $10,000 - $19,9998.8%7918.2%162 $20,000 - $29,99915.3%1409.7%89 $30,000 - $39,99916.8%16510.2%100 $40,000 - $49,99913.8%1538.3%93 $50,000 - $74,99917.0%9512.2%68 $75,000 - $99,9998.2%697.4%63 $100,000 - $149,9996.9%5610.6%86 $150,000 or More2.1%243.2%35

17
Neighborhood Market #5738Harps #124 Demography 2 mile Ring % HHsHHs Index% HHsHHs Index Age of Head of Household Age 18 - 248.3%19821.7%515 Age 25 - 3427.2%18031.0%205 Age 35 - 4425.6%14816.7%96 Age 45 - 5417.8%8911.3%56 Age 55 - 6410.5%5410.1%52 Age 65 - 745.7%435.1%39 Age 75 or More4.9%454.1%39 Age and Presence of Children Age < 613.0%1767.0%94 Age 6 - 1725.1%1357.4%40 Age < 6 & 6 - 1716.5%2517.5%113 No Children45.5%6778.2%116 Housing Tenure Own40.2%6236.4%56 Rent59.8%17163.6%181 Education of Head of Household Not a High School Graduate36.2%2786.2%47 High School Graduate25.5%10013.9%55 Some College19.5%6836.9%129 College Graduate11.4%6025.3%133 Post College Degree7.4%5417.7%129

18
Category Strategy Both Flash Market Gas Stations have high gross margins in teas that are sold in smaller oz. Larger grocery stores have a higher saturation of tea product and a large number of varieties within a manufacturer’s brand Variety leads to increased profits Gas stations more interested in traffic building Grocery stores more interested in profit and cash generating

19
Audit Summary StoreLocation#SKU Unique SKUsAudited By WM SupercenterMLK456Call Flash MarketSpringdale111Call Flash MarketWedington174Dockery Phillips 66Fayetteville157Call Walmart NMWedington294Dockery Walmart NMSpringdale6115Call HarpsWedington6330Dockery Murphy ExpressFayetteville115Dockery High % Unique SKUs

20
Category Tactics Increase use of Private Label Small perceived quality gap - “Quality Equivalent” No switching cost Expand Private label depth Flavors Expand Private label assortment 6 pack bottles (Kroger)
")
21
Category Review 2007 Audit SKUs - 56 US Sales - $1.3B No P/L data 2014 Audit SKUs - 136 US Sales - $1.1B (15%) P/L - 3 SKUs (Great Value) Increased average loyalty
 P/L - 3 SKUs (Great Value) Increased average loyalty")
22
Thanks for Listening! Any Questions?

Similar presentations