Download presentation
Presentation is loading. Please wait.

1
HUMAN POPULATIONS World Population Clock Population Ranks U.S. POP Clock Projection

2
Human Population Expansion and Its Cause Reasons for the patterns of growth –Biotic potential exceeds environmental resistance: birth rates exceed death rates There are 7.1 billion people on Earth If each one stood up, pronounced their name and sat down –It would take 600 years to complete roll call –By 2025 it will take 1,000 years to complete this exercise

3
HUMAN POPULATIONS Every second, on average, 4-5 children are born somewhere on earth. In that same second, 2 other people die. This difference between births and deaths means a net gain of nearly 2.5 people per second in the world’s population. –9000 people per hour –214,000 people per day –78 million per year

4
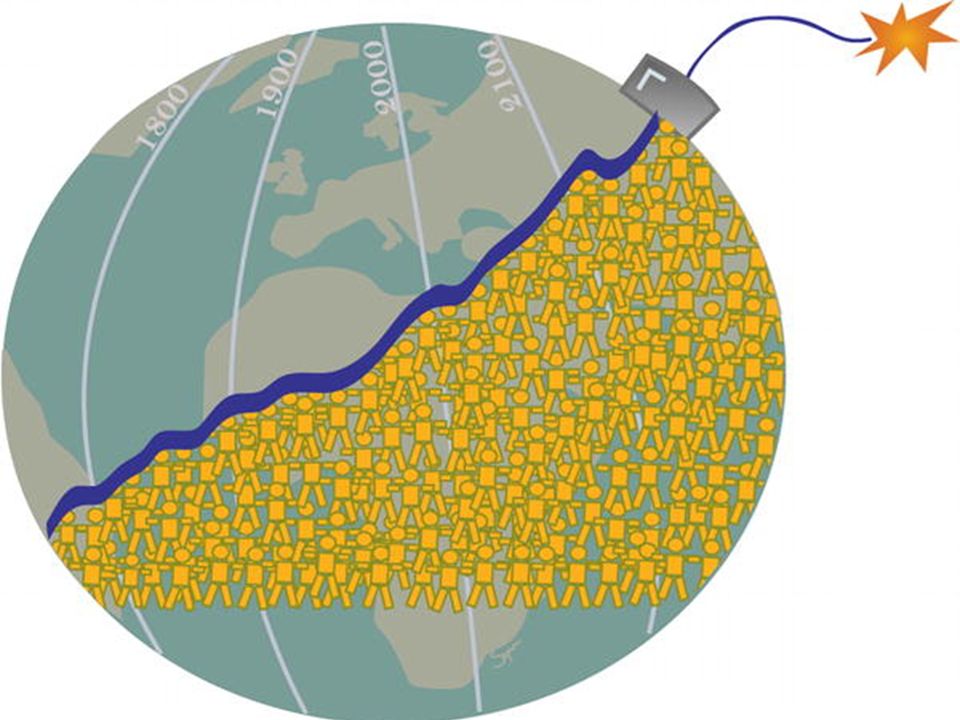
World Population Over the Centuries 9,000 human beings added to the planet every hour

5
World’s Human Population The human population hit 1 million about 15,000 years ago. The human population hit 1 billion in 1804. –3 billion in 1960 ( 150 years to add 2 billion) –1 billion people add between 1987-1999 This means our population will double in about 40 years.
 –1 billion people add between This means our population will double in about 40 years..")
6
What is Exponential Growth? Which would you choose? 2 million dollars or 1 penny on day one and then double it each day for 30 days.

7
$5,368,709.12 0.011 0.022 0.043 0.084 0.165 0.326 0.647 1.288 2.569 5.1210 10.2411 20.4812 40.9613 81.9214 163.8415 327.6816 655.3617 1310.7218 2621.4419 5242.8820 10485.7621 20971.5222 41943.0423 83886.0824 167772.1625 335544.3226 671088.6427 1342177.2828 2684354.5629 5368709.1230

8
Exponential Growth Exponential growth is marked by doubling. A few doublings can lead quickly to enormous numbers. It is deceptive because it starts out slowly, but rapidly gets out of hand.

9
Growth Rate- includes birth rate, death rate, immigration and emigration Doubling time- The time it takes for the population to double the number of people

10
What influences Growth rate? Crude birth rate – the number of births per thousand people. Crude death rate – the number of deaths per thousand people. –If they are equal, there is zero population growth. –If births is higher than deaths, then the pop. goes up. –Life expectancy – The average number of years someone is expected to live.

11
Calculating Fertility Rates and Doubling Times (CBR - CDR)/1000 x 100 = % Rate of Increase or decrease in population per 1000 per year 70/ Rate of Increase = Doubling Time
/1000 x 100 = % Rate of Increase or decrease in population per 1000 per year 70/ Rate of Increase = Doubling Time")
13
Reasons for the Human Population Explosion Causes of disease recognized Improvements in nutrition Discovery of antibiotics Improvements in medicine Increase in number of women who actually reach child-bearing age Short doubling times in some countries

14
Factors Affecting Death Rates Death rates have declined because of: –Increased food supplies, better nutrition. –Advances in medicine. –Improved sanitation and personal hygiene. –Safer water supplies. U.S. infant mortality is higher than it could be (ranked 46 th world-wide) due to: –Inadequate pre- and post-natal care for poor. –Drug addiction. –High teenage birth rate.
 due to: –Inadequate pre- and post-natal care for poor. –Drug addiction. –High teenage birth rate..")
15
Infant mortality rate- Number of child/infant deaths. If a mother lives in an area with a high infant mortality rate she will tend to have a lot of children to ensure some will make it to adulthood.

16
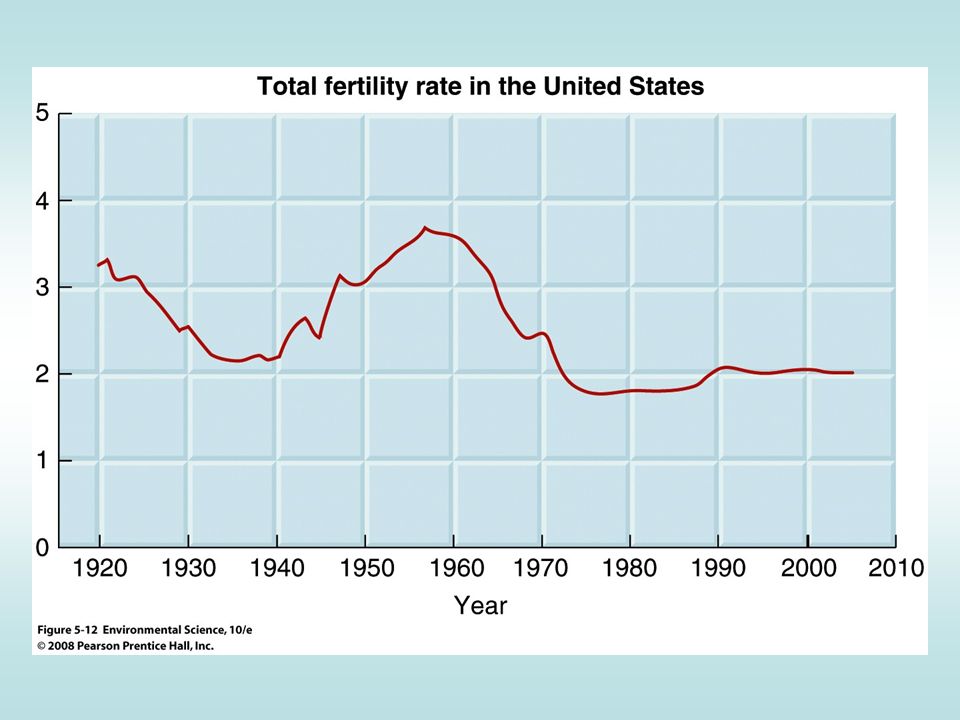
Zero Population Growth- When the number of births, equals the number of deaths. No growth in the population. Total Fertility Rate- an estimate of the average number of children a women will have during her childbearing years.

17
Replacement-level fertility- the number of children a couple must bear to replace themselves. It is slightly higher than two children per couple. (2.2 in developed countries and as high as 2.5 in some developing countries) It is greater in countries w/ high infant mortality rates than in countries w/ low infant mortality rates
 It is greater in countries w/ high infant mortality rates than in countries w/ low infant mortality rates.")
18
Factors Affecting Birth Rates and Fertility Rates The number of children women have is affected by: –The cost of raising and educating them. –Availability of pensions. –Urbanization. –Education and employment opportunities. –Infant deaths. –Marriage age. –Availability of contraception and abortion. –Importance of kids in labor force –Religious beliefs, traditions & cultural norms

19
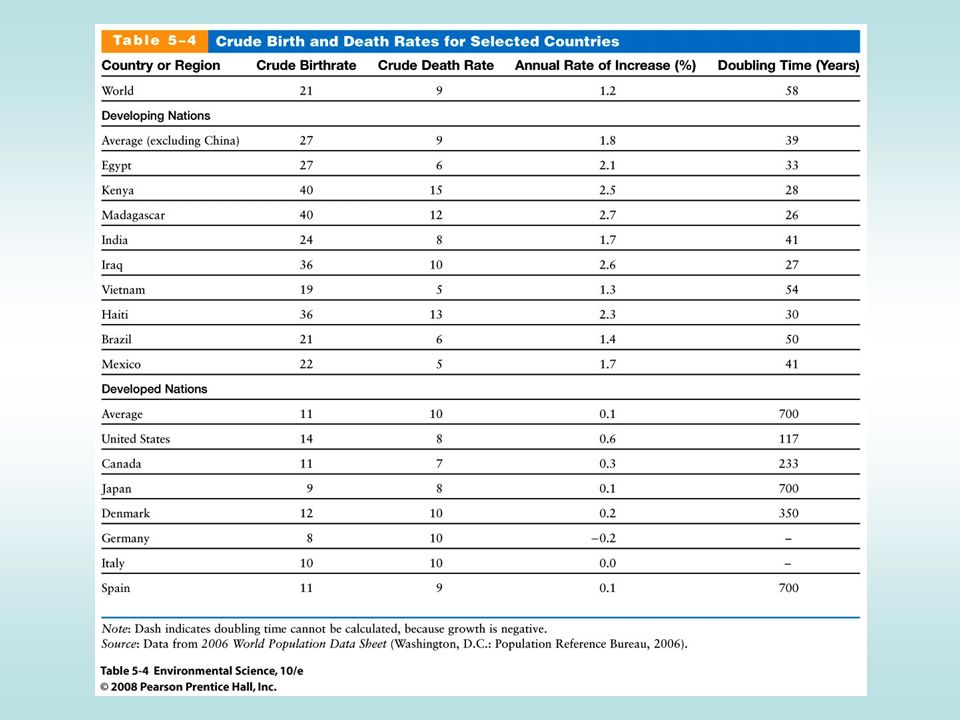
Fig. 9-3, p. 174 Average crude death rate Average crude birth rate World 21 9 All developed countries 11 10 All developing countries 27 8 9 23 Developing countries (w/o China)
.")
21
Other factors that influence a countries population Immigration – the migration or movement of people into a country or area to take up permanent residence. Emigration – the migration or movement of people from a country. Net Migration- Total number of people moving into or out of the population.

22
Reasons to Immigrate 1.Work 2.Money 3.Political Safety 4.Freedom of Religion 5.To Escape War 6.Famine 7.For a Better Education 8.Different Government 9.Tolerance Usually people immigrate to start a better life for them or their families. Some come alone in hope that they can soon bring the rest of their family. Others work so they can send money to help those where they came from.

23
Growth Rate

24
FACTORS AFFECTING HUMAN POPULATION SIZE Population increases because of births and immigration and decreases through deaths and emigration. Instead of using raw numbers, crude birth rates and crude death rates are used (based on total number of births or deaths per 1,000 people in a population).
..")
25
Demographics Demography – Keeps track of human populations. The data collected is used to show age structures (number of people in various age brackets), and is separated by gender (male and female). Population profiles (graphs) are used to determine age structures (proportions of people in each age bracket), and are used to make predictions of future population trends.
, and is separated by gender (male and female). Population profiles (graphs) are used to determine age structures (proportions of people in each age bracket), and are used to make predictions of future population trends..")
26
Demographics A demographer studies vital statistics about people, such as birth rates, death rates, where they live, as well as population size. They compare country to country, state to state, region to region. They can predict trends that can be important to plan the future.

27
Demographics They study the populations of developed countries and non-developed countries. –Developed countries are those that are industrialized and/or have high standards of living. –Less-developed countries are those that have very little industrialization and/or low standards of living.

28
Demographics Developed –High literacy rates –High standards of living –Low birth rate –Low death rate –Slow or Zero population growth –High life expectancy –Rich –High per capita –High Energy Consumption –Urban populations Less-Developed –Low literacy rates –Low standard of living –High birth rate –High death rate –Rapid population growth –Low life expectancy –Poor –Widespread Disease –Low per capita –Rural populations

29
Economic Categories Based on Per Capita Gross National Income Gross National Product- The most commonly used measure of the economic growth of a country. –Capita:the value of all products and services generated within a country in one year Gross National Income Per Capita: GNP + net income received from other countries –low income, $1,005 or less –lower middle income $1,006 - $3,975 –upper middle income, $3,976 - $12,275 –high income, $12,276 or more.

30
Per Capita Gross National Income Developed High-income, highly developed, industrialized –Europe, Japan, US, Canada –Average GNI per capita = $26,710 –US = $47,140 –Wealthiest = Monoco ($197,460) Moderately Developed Low-income, under developed countries, non-industrialized –Central Asia, Middle East and Sub-Saharan Africa –Average GNI per capita = $430 –Poorest = Burundi ($160)
 Moderately Developed Low-income, under developed countries, non-industrialized –Central Asia, Middle East and Sub-Saharan Africa –Average GNI per capita = $430 –Poorest = Burundi ($160)")
31
Major Economic Divisions of the World Gross national income/capita

32
The Poverty Cycle

34
Disparities Developed countries –15% of the world’s population –Control 80% of the world’s wealth Low-income developing countries –37% of the world’s population –Control 3.0% of the world’s gross national income Difference in per capita income: 63 to 1!

35
Dimensions of the Human Poverty Index

36
Poor (less developed) countries have high population growth rates therefore, high populations. More developed (richer) countries have little or no population growth.
 countries have little or no population growth..")
37
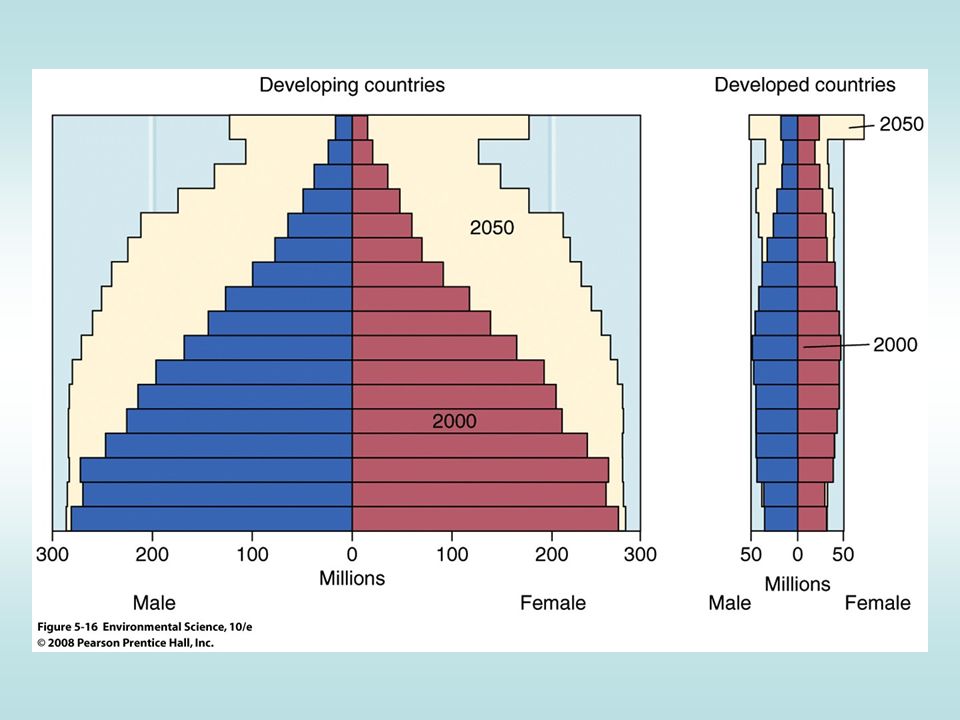
Histograms These population histograms show the age distribution and help predict the age dist. for the future. 10 years later

38
The age structure histogram below shows the percentage of population for both male (left) and female (right) for three nations, Mexico (rapid growth), U.S. (slow growth) and Sweden (zero growth). The shaded areas on each graph show people in their child bearing years.
 and Sweden (zero growth). The shaded areas on each graph show people in their child bearing years..")
40
What is the growth rate?

41
Age structure- Percentage of the population at each age level in a population Generation time- the time it takes for 1 generation to pass.

42
POPULATION AGE STRUCTURE The number of people in young, middle, and older age groups determines how fast populations grow or decline. The number of people younger than age 15 is the major factor determining a country’s population growth. Changes in the distribution of a country’s age groups have long-lasting economic and social impacts.

43
POPULATION AGE STRUCTURE Populations with a large proportion of its people in the preproductive ages 1-14 have a large potential for rapid population growth. Figure 9-9

44
Population Profile of Italy

45
U.S. Statistics Because of the ‘Baby Boom’ the US has a bulge in the pyramid with people in their 50’s-60’s. There are also more women than men in the older age group because of differences in longevity between the sexes. (Cont…)
.")
46
POPULATION AGE STRUCTURE Today, baby boomers make up nearly half of all adult Americans and dominate the populations demand for goods and services. Figure 9-11

47
POPULATION AGE STRUCTURE About 14% of the world’s population live in countries with stabilizing or declining populations. Rapid population decline can lead to long- lasting economic and social problems. Death from AIDS can disrupt a country’s social and economic structure by removing significant numbers of young adults.

48
POPULATION AGE STRUCTURE Some problems with rapid population decline. Which of these problems do you believe are the most important? Figure 9-13

49
Population Profile United States

51
US Population Growth Histogram

52
SOLUTIONS: INFLUENCING POPULATION SIZE Demographic Transition: As countries become economically developed, their birth and death rates tend to decline. –Preindustrial stage: little population growth due to high infant mortality. –Transitional stage: industrialization begins, death rates drops and birth rates remain high. –Industrial stage: birth rate drops and approaches death rate.

55
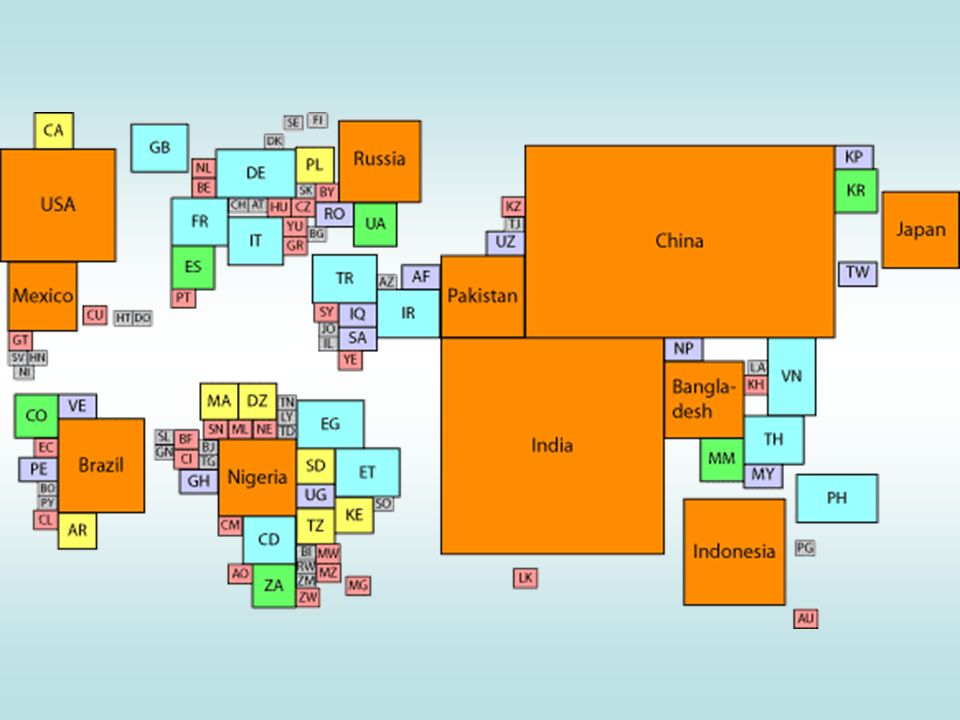
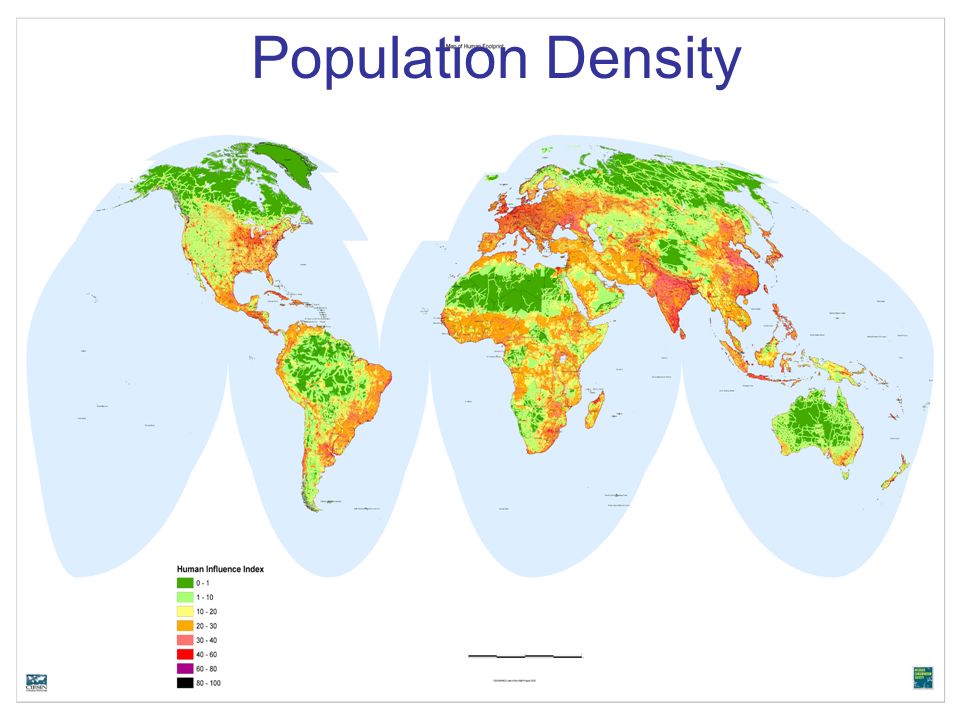
Population Density

59
Do you think our world can handle this many people? Carrying capacity – The maximum number of individual species that can be supported by an ecosystem on a long term basis.

60
Carrying Capacity At this point, the environment can no longer provide for the species, due to a number of different environmental resistances, including food, crowding, competition, etc. The population, due to lack of resources, will begin to die out, allowing the environment to recover. As the environment recovers, the species population is able to flourish once more. This leads to a fluctuation between the prosperity of the species and the prosperity of the environment (hence the fluctuations in the graph).
..")
61
Human predictions If there was a continued growth and not death, food would run short and available space would run out. But, humans can’t reproduce as fast as other animals. This helps to stop the growth.

62
Effects of Overpopulation? Food Shortage - famine Natural resources shortage Land Overuse War Disease Pollution-waste management

65
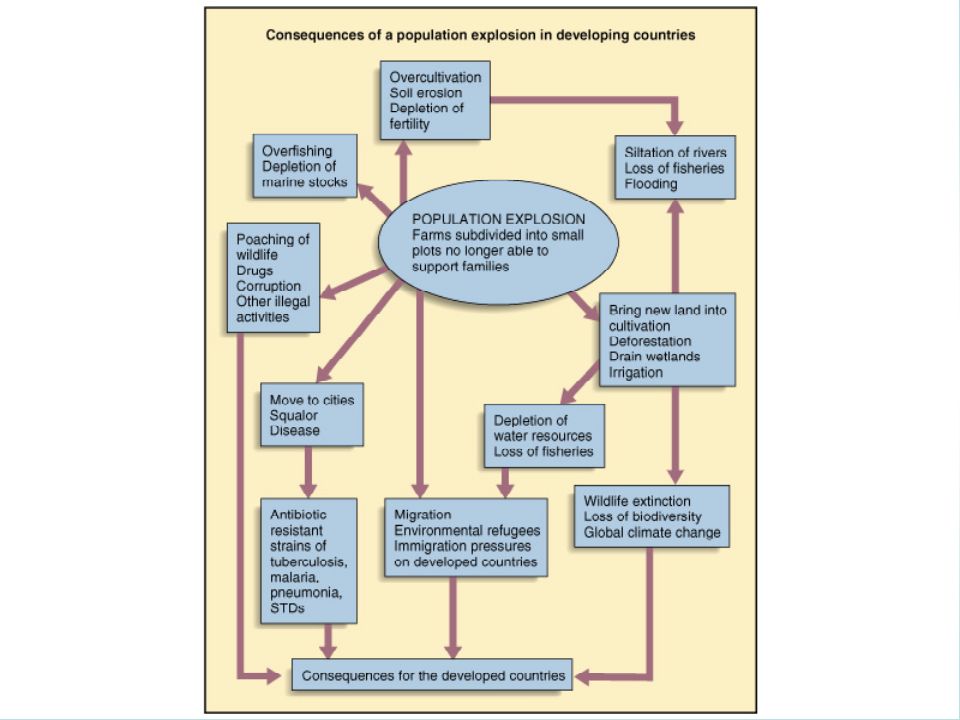
Consequences of Exploding Populations More Population Causes MORE LESS deforestation resource depletion loss of agricultural land biodiversity disease pest resistance population migration irrigation wetlands

66
Reasons for World Hunger Issues Unequal distribution of available food Loss of arable land Increasing population growth rate Increasing poverty in developing countries

67
Strategies for ensuring adequate nutrition for a growing population: Increase the number of new food crops from a diversity of plant species Distribute food more equitably Increase land area that is dedicated to grain production rather than meat production Assist developing countries in efficient crop irrigation systems.

68
HUMAN ASPECTS ON NATURAL SYSTEMS We have used technology to alter much of the rest of nature in ways that threaten the survival of many other species and could reduce the quality of life for our own species. Figure 9-17

69
Different Populations, Different Problems IPAT Formula: calculates human pressure on the environment (I = P x A x T) –I = environmental impact –P = population –A = affluence and consumptive patterns –T = level of technology in the society
 –I = environmental impact –P = population –A = affluence and consumptive patterns –T = level of technology in the society")
70
Different Populations, Different Problems Environmental impact of developing countries due to “P.” Environmental impact of developed countries due to “A” and “T.” –Both have some measure of “I” for different reasons. –Average American places at least 20 times the demand on Earth’s resources compared to a person in Bangladesh.

71
Different Populations, Different Problems How does stewardship (S) affect the IPAT formula? –S = wildlife conservation, pollution control, energy conservation, and recycling I = P x A x T S

72
Developed Countries High rates of resource use result in high levels of pollution and environmental degradation per person These are believed to be the key factors determining overall environmental impact. (Cont….)
.")
73
It is estimated that a US citizen consumes 35 X’s as much as the average citizen of India and 100 X’s as much as the average person in the world’s poorest countries. Thus, poor parents in a developing country would need 70-200 kids to have the same lifetime environmental impact as 2 typical US kids.

74
Urban areas must import most of its food, water, energy, minerals, & other resources. They produce enormous quantities of wastes that can pollute the air, water & land. 44% of the world’s people live in urban areas that occupy only 5% of the world’s land & they consume 75% of the world’s resources.

75
Core Case Study: Is the World Overpopulated? The world’s population is projected to increase from 6.6 billion to 8.9 billion between 2006 and 2050. The debate over interactions among population growth, economic growth, politics, and moral beliefs is one of the most important and controversial issues in environmental science.

76
Core Case Study: Is the World Overpopulated? Some argue that the planet has too many people. Some feel that the world can support billions of more people due to technological advances. There is a constant debate over the need to reduce population growth. –Must consider moral, religious, and personal freedom.

77
Population Control Psychological/Behavioral: abstention, calendar rhythm method Mechanical: condoms, diaphragms Chemical: the pill, Norplant Surgical: tubal ligation, vasectomy Intrauterine Devices (IUD): abortion device An important example of mandated population control is China's one- child policy, in which having more than one child is made extremely unattractive. This has led to allegations that practices like infanticide, forced abortions, and forced sterilization are used as a result of the policy.Chinaone- child policy

81
China’s Family Planning Program Currently, China’s TFR is 1.6 children per women. China has moved 300 million people out of poverty. Problems: –Strong male preference leads to gender imbalance. –Average population age is increasing. –Not enough resource to support population.

82
Some countries, including China, penalize couples who have more than one or two children by: 1.Raising their taxes 2.Charging other fees 3.Eliminating income tax deductions for a couple’s third child 4.Loss of health-care benefits, food allotments and job options

83
In China couples who pledge to have no more than one child receive 1.Extra food 2.Larger pensions 3.Better housing 4.Free medical care 5.Salary bonuses 6.Free school tuition for their one child 7.Preferential treatment in employment when their child enters the job market.

84
India’s Failed Family Planning Program Poor planning. Bureaucratic inefficiency. Low status of women. Extreme poverty. Lack of administrative financial support. Disagreement over the best ways to slow population growth.

85
Putting It All Together: Social Modernization

Similar presentations