Download presentation
Presentation is loading. Please wait.

1
Standard of Living vs. Quality of Life Disparity between the Nations of the World

2
Population Distribution Why is the world’s population so uneven? –Only 1/5 of the Earth’s surface is ideal for inhabitation 90% of the world’s population lives on 1/5 of the available land

3
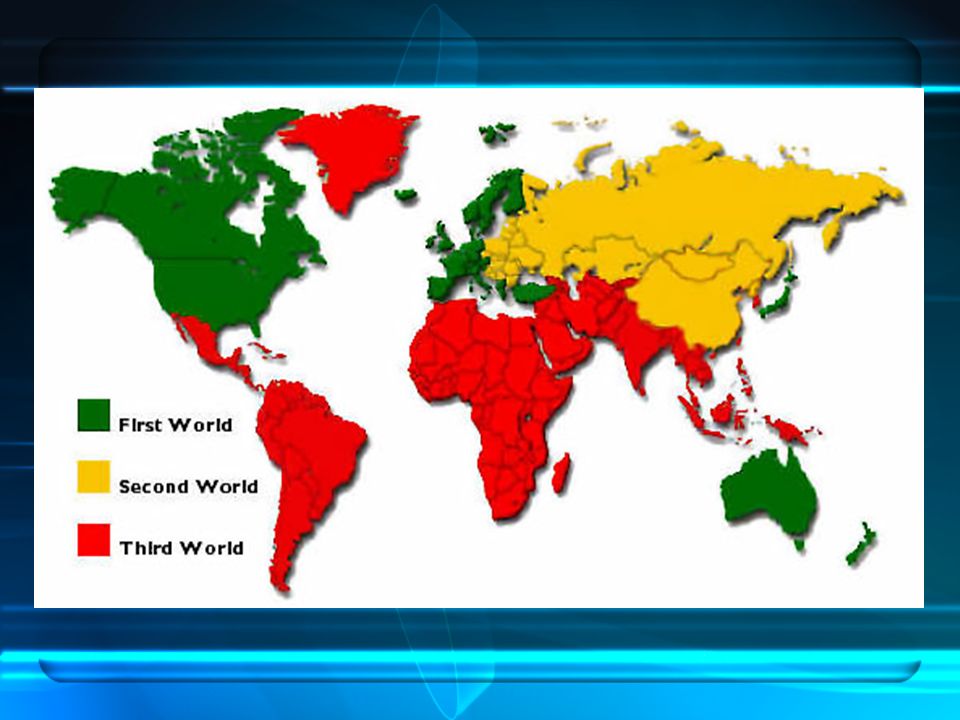
Geopolitical Classifications First World –Capitalist economy Second World State controlled economy –China, the former USSR & its satellite states, Cuba, & North Korea Third World The remainder of the world’s poorer nation-states fit here, regardless of their differences

6
Economic Classifications 1991 the USSR collapsed Developed world & Developing world are the two terms we will use to classify nation-states The developing is split into Less Developed (LDC) and Least Developed (LLDC) classifications that recognize the extreme disparities that exist within developing nations
 and Least Developed (LLDC) classifications that recognize the extreme disparities that exist within developing nations")
7
Disparity Definition: disparity exists when there is a significant difference between two groups of people The three richest people have assets that exceed the combined Gross Domestic Product of the 48 least developed countries, with a combined population of 585,000,000.

8
How do we Measure Development? Gross Domestic Product (GDP) – Is the total market value of all of the goods and services produced in that country combined for a certain period of time, usually one calendar year. Many international organizations determine a country’s prosperity by measuring the size of their economy.
 – Is the total market value of all of the goods and services produced in that country combined for a certain period of time, usually one calendar year. Many international organizations determine a country’s prosperity by measuring the size of their economy..")
9
International GDP What do you notice? What is the general theme? What flaws do you see in this method? Is this a good measure of prosperity for all?

10
RankCountryGDP (millions of USD) — Gross world product 48,144,466 — European Union 14,527,140 1 United States 13,244,550 2 Japan 4,367,459 3 Germany 2,897,032 4 People's Republic of China 2,630,113 5 United Kingdom 2,373,685 6 France 2,231,631 7 Italy 1,852,585 8 Canada 1,269,096 9 Spain 1,225,750 10 Brazil 1,067,706 11 Russia 979,048 12 India 886,867 13 South Korea 884,267 14 Mexico 840,012 15 Australia 754,816 * GDP for top 15 nations as determined by IMF 2005 Use your previous knowledge concerning living conditions around the world. Do you see anything here that raises any possible concerns about this measure?

11
GDP per capita GDP per capita – The GDP of a country divided by that countries population for that year. Per Capita Income = ___GDP_____ Total Population Example: = 300 000 000 2 600 000 = 11 500.00 U.S.

12
1 Luxembourg 87,9552005 2 Norway 72,3062005 3 Qatar 62,9142005 4 Iceland 54,8582005 5 Switzerland 51,7712006 6 Denmark 50,9652005 7 Ireland 44,5002006 8 United States 44,1902006 9 Sweden 42,3832006 10 Netherlands 40,5712006 11 Finland 40,1972005 12 United Kingdom 39,2132005 13 Austria 38,9612006 14 Canada 38,9512006 15 Belgium 37,2142006 Rank Country GDP (USD) per capita * GDP (nominal) per capita as determined by the IMF 2006. Do you see any changes here? Why might they have changed?

13
GDP per capita (2006) What do you notice?What countries have changed? Why? Can you think of any flaws in this measure? How do these flaws relate to differing perspectives on prosperity?

14
Income Inequality Refers to disparities in the distribution of wealth. Usually it compares differences in income between members and groups of a specific society but can also be used to compare nations.

15
Income Inequality What do you notice? Does this give you a new perspective on using measures like the GDP or GDP per capita? * As determined by the United Nations

16
More factors in measuring development Life Expectancy: –number of years a person lives. http://www.statcan.gc.ca/kits-trousses/animat/edu06a_0000-eng.htm Canada / Provinceshttp://www.statcan.gc.ca/kits-trousses/animat/edu06a_0000-eng.htm http://esa.un.org/wpp/population-pyramids/population-pyramids.htm worldhttp://esa.un.org/wpp/population-pyramids/population-pyramids.htm –number of children per 1000 births who die in the first year of life. Food Intake: –the average food intake as a percentage of average food needs. (Example – anything over 100% indicates more food than required). –Also measured by Caloric intake. The average human being requires around 2 400 Calories per day.
. –Also measured by Caloric intake. The average human being requires around Calories per day..")
17
Population Density: Number of people per square km. Literacy Rates – Is determined by the percentage of a countries population over the age of 15 that are able to read and write. How does this relate to prosperity?

18
Literacy Rates (yrs vary) * As determined by the CIA world Factbook, 2014 Is there a reoccurring theme?? http://world.bymap.org/LiteracyRates.html

19
Digital Divide The Digital Divide – Refers to the disparity between nations regarding access to digital information and resources. How does this relate to prosperity? I.E. – Availability of Internet access, number of internet users per nation or percentage of population with access to the internet.

20
Digital Divide % of population with access to the Internet * As determined by the United Nations

21
Digital Divide Total number of internet users per country * As determined by the United Nations

22
HDI Index Just because a country is poor, doesn’t mean that their QUALITY OF LIFE is poor! Human Development Index is the most recent measurement to date Uses three indicators: Longevity: Measured by life expectancy Knowledge: Measured by adult literacy and school enrollment Standard of Living: GDP per capita in US $ You can have access to education and healthcare that will increase knowledge and life expectancy HDIHDI CLIP HDI INTERACTIVE WORLD MAP INTERACTIVE WORLD MAP ON WORLD DEVELOPMENT INTERACTIVE WORLD MAP ON WORLD DEVELOPMENT INTERACTIVE WORLD MAP

23
██ 0.450-0.499 ██ 0.400-0.449 ██ 0.350-0.399 ██ 0.300-0.349 ██ under 0.300 ██ n/a ██ 0.700-0.749 ██ 0.650-0.699 ██ 0.600-0.649 ██ 0.550-0.599 ██ 0.500-0.549 ██ 0.950 and over ██ 0.900-0.949 ██ 0.850-0.899 ██ 0.800-0.849 ██ 0.750-0.799 Human Development Index * As determined by the United Nations 2004-2006

24
World Stats

25
Standard of Living vs. Quality of Life Standard of living –Material possessions –Access to health care and education –Luxury items Quality of life –More than just possessions –environment, human rights, psychological factors (how people feel about their lives) There are no universally objective measures to capture all of quality of life
 There are no universally objective measures to capture all of quality of life.")
26
Do not be confused! Standard of Living poverty linepoverty line –Level of material comfort as measured by the goods, services, and luxuries available to an individual, community, or nation Quality of Life –The degree of enjoyment and satisfaction experienced in everyday life that includes standard of living as well as non-material things, such as political and religious freedom, health care, and the environment

27
Bhutan page 285

28
GNH – Gross National Happiness http://www.grossnationalhappiness.com/m ultimedia/

33
Worlds Happiest Nations Are Top ten countries

Similar presentations