Download presentation
Presentation is loading. Please wait.

1
Using Data to Improve Student Achievement Summer 2006 Preschool CSDC

2
Outcomes Know why we need to look at data Know why we need to look at data Identify two types of tests Identify two types of tests Understand three types of scores Understand three types of scores Understand Summative & Formative Assessments Understand Summative & Formative Assessments Be able to interpret Summative Assessment Reports Be able to interpret Summative Assessment Reports Know how to use data in instructional planning for increased student learning Know how to use data in instructional planning for increased student learning

3
Why Look at Data? The purpose of data is to give educators INSIGHT!

4
Types of Tests Norm-Referenced Test (NRT) Criterion-Referenced Test (CRT)
 Criterion-Referenced Test (CRT)")
5
What is a Norm-Referenced Test (NRT)? A standardized assessment in which all students perform under the same conditions. A standardized assessment in which all students perform under the same conditions. It compares the performance of a student or group of students to a national sample of students at the same grade and age, called the norm group. It compares the performance of a student or group of students to a national sample of students at the same grade and age, called the norm group.

6
What is a Criterion-Referenced Test (CRT)? An assessment comparing one student's performance to a specific learning objective or performance standard and not to the performance of other students. An assessment comparing one student's performance to a specific learning objective or performance standard and not to the performance of other students. It tells us how well students are performing on specific goals or content standards rather than how their performance compares to a national or local norming group. It tells us how well students are performing on specific goals or content standards rather than how their performance compares to a national or local norming group.

7
Summary NRT and CRT

8
Types of Scores

9
Raw Score (RS) The number of items a student answers correctly on a test. The number of items a student answers correctly on a test. John took a 10 item Grammar and Usage Content Mastery Subtest (where each item was worth one point) and correctly answered 7 items. John took a 10 item Grammar and Usage Content Mastery Subtest (where each item was worth one point) and correctly answered 7 items. His raw score for this assessment is 7. His raw score for this assessment is 7.
 and correctly answered 7 items. John took a 10 item Grammar and Usage Content Mastery Subtest (where each item was worth one point) and correctly answered 7 items. His raw score for this assessment is 7. His raw score for this assessment is 7..")
10
Scale Score (SS) Mathematically converted raw scores based on level of difficulty per question. Mathematically converted raw scores based on level of difficulty per question. For FCAT-SSS, a computer program is used to analyze student responses and to compute the scale score. For FCAT-SSS, a computer program is used to analyze student responses and to compute the scale score. Scale Scores reflect a more accurate picture of the student’s achievement level. Scale Scores reflect a more accurate picture of the student’s achievement level.

11
Gain Scores Commonly referred to as “Learning Gains”. Commonly referred to as “Learning Gains”. The amount of progress a student makes in one school year.

12
Student Learning Gains: Who Qualifies? All students with a pre- and post-test, including all subgroups (ESE, LEP, etc.). All students with matched, consecutive year (i.e. 2005 & 2006) FCAT SSS results, grades 4-10. Students enrolled in the same school during October and February FTE will count toward school learning gains.
. All students with matched, consecutive year (i.e & 2006) FCAT SSS results, grades Students enrolled in the same school during October and February FTE will count toward school learning gains..")
13
Learning Gains: Which Scores? Gains are applied in reading and math, not writing or science. Gains are applied in reading and math, not writing or science. Pre-test may be from same school, same district, or anywhere in the state. Pre-test may be from same school, same district, or anywhere in the state.

14
Learning Gains: What equals Adequate Yearly Progress (AYP)? A. Improve FCAT Achievement Levels from 2005 to 2006 (e.g. 1-2, 2-3, 3-4, 4-5) OR B. Maintain “satisfactory” Achievement Levels from 2005-2006 (e.g. 3-3, 4-4, 5-5) OR C. Demonstrate more than one year’s growth within Level 1 or Level 2 - determined by DSS Cut Points (not applicable for retained students)
 OR B. Maintain satisfactory Achievement Levels from (e.g. 3-3, 4-4, 5-5) OR C. Demonstrate more than one year’s growth within Level 1 or Level 2 - determined by DSS Cut Points (not applicable for retained students).")
15
Developmental Scale Score Gains Table (DSS Cut Points) Students achieving within Level 1 (or within Level 2) for two consecutive years must gain at least one point more than those listed in the table in order to satisfy the “making annual learning gains” component of the school accountability system. Grade Level ChangeReadingMathematics 3 to 4230162 4 to 5166119 5 to 613395 6 to 711078 7 to 89264 8 to 97754 9 to 107748

16
Learning Gains: Retainees A retained student can only be counted as making adequate progress if he/she: Moves up one level. (e.g. 1-2, 2-3, 3-4, 4-5) Maintains a level 3, 4, or 5. Maintains a level 3, 4, or 5.
 Maintains a level 3, 4, or 5. Maintains a level 3, 4, or 5..")
17
Learning Gains: Activity Using the data on the following table to determine: which students made a learning gain what percentage of the teacher’s students made a learning gain

18
Data Display for FCAT Reading Results Student04/05 Grade Level 05/06 Grade Level Pre-test Achievement Level Pre- test DSS Post-test Achievement Level Post- test DSS Learning Gain Determination A78Level 1Level 2Yes or No Reason: A, B, or C B78Level 4 Yes or No Reason: A, B, or C C78Level 21598Level 21743Yes or No Reason: A, B, or C D88Level 1Level 2Yes or No Reason: A, B, or C E88Level 3 Yes or No Reason: A, B, or C F88Level 11486Level 11653Yes or No Reason: A, B, or C G78Level 5Level 4Yes or No Reason: A, B, or C

19
Data Display for FCAT Reading Results Student04/05 Grade Level 05/06 Grade Level Pre-test Achievement Level Pre- test DSS Post-test Achievement Level Post- test DSS Learning Gain Determination A78Level 1Level 2Yes Reason: A B78Level 4 Yes Reason: B C78Level 21598Level 21743Yes Reason: C D88Level 1Level 2Yes Reason: A E88Level 3 Yes Reason: B F88Level 11486Level 11653No Reason: C G78Level 5Level 4No Reason: B

20
Teacher Learning Gains Based on Data Display 5 out of 7 students made learning gains. 71% of this teacher’s students made learning gains and add points towards the school’s grade. No points are given to the school for Student F because he was retained and stayed within level 1 – even though he made significant gains in DSS points. No points are given to Student G because he decreased a level. Total Number of Students with a Pre and Post-test who qualify for learning gain calculations: Reason A Increased 1 or more Achievement Levels Reason B Maintains “satisfactory” levels (3, 4, or 5) Reason C DSS Target Gain (More than a year’s growth) 7221
 Reason C DSS Target Gain (More than a year’s growth)")
21
Class Record Sheet for Learning Gains

22
Types of Data Results (Summative) Data used to make decisions about student achievement at the end of a period of instruction. Process (Formative) Data gathered at regular intervals during the instructional period; used to provide feedback about student progress and to provide direction for instructional interventions.
 Data gathered at regular intervals during the instructional period; used to provide feedback about student progress and to provide direction for instructional interventions..")
23
A Closer Look at Results Data Examples:

24
FCAT Parent Report

25
A Closer Look at Formative Data FORF Content Mastery Fluency Checks

26
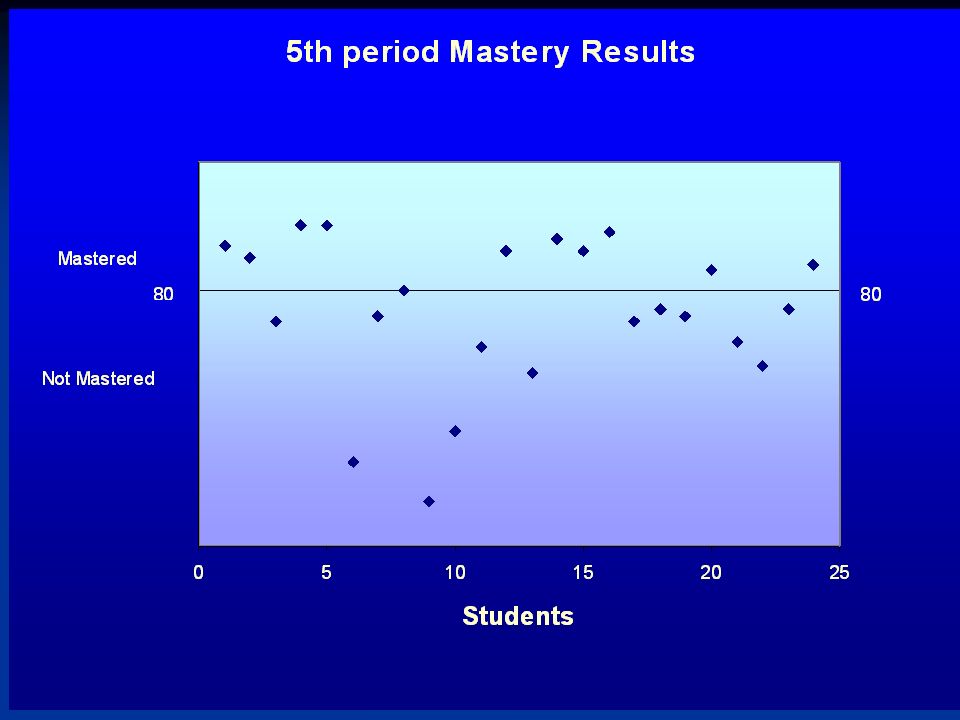
What tools do we have? FCAT Data Inquiry (Summative) FCAT Data Inquiry (Summative) Teacher Tools for Data Collection Teacher Tools for Data Collection (Can be Summative or Formative) Histogram Pareto Chart Run Chart Scatter Diagram Item Analysis
 FCAT Data Inquiry (Summative) Teacher Tools for Data Collection Teacher Tools for Data Collection (Can be Summative or Formative) Histogram Pareto Chart Run Chart Scatter Diagram Item Analysis.")
27
Histogram Bar chart representing a frequency distribution of student scores Heights of the bars represent number of students scoring at same level/score Used to Monitor progress Histogram: Minutes to Run 1 Mile 0 2 4 6 8 10 12 14 16 5-67-89-1011-1213-1415-16 Time Frequency

28
Beginning of Year Placement Scores

29
Mid-year

30
End of Year Placement Scores

31
Run Chart Use to: Monitor progress over time Display data in simplest form

32
Word Fluency Checks

33
Individual Student Fluency Scores

34
Class Fluency Averages

35
Class Goal: By the end of the year, 100% of our class will have an average of at least 140 words correct per minute. Class Run Chart: Percent of Students Reading 140 words correct per minute on fluency checks. Quizzes 0 10 20 30 40 50 60 70 80 90 100 123456789 Week Correct Words per Minute

36
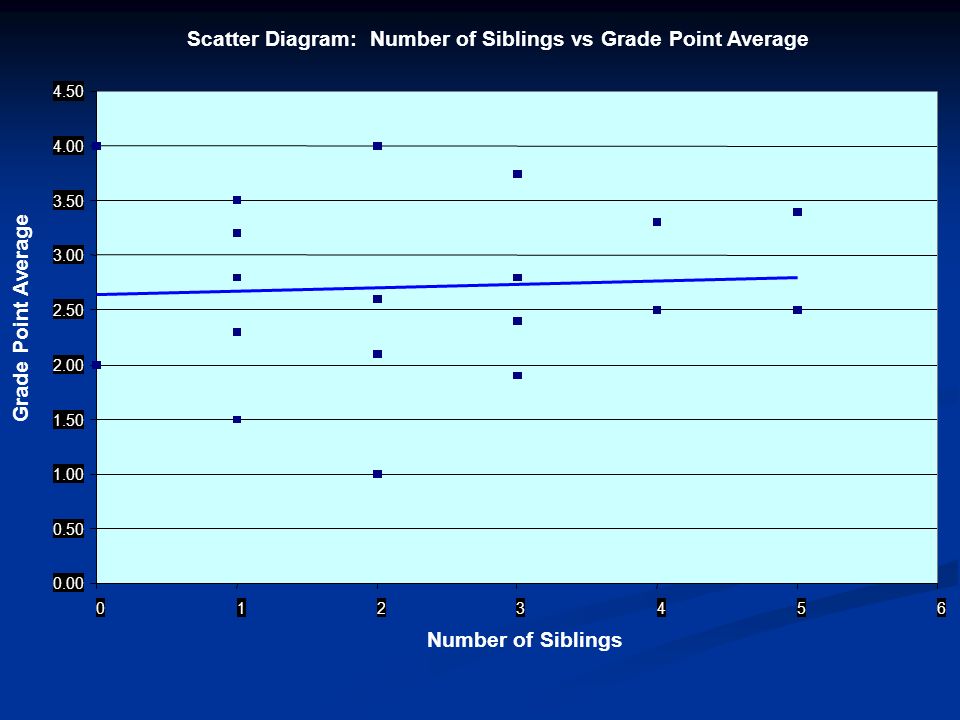
Scatter Diagram

38
Scatter Diagram: Hours of Sleep vs Mistakes on Test 0 2 4 6 8 10 12 012345678910 Hours of Sleep Mistakes

40
Item Analysis Use to: Determine mastered content Determine most common mistakes

41
Spelling Inventory Item Analysis

42
CLASSROOM TEST ANALYSIS BENCHMARK ASSESSED ITEM # NUMBER CORRECT NUMBER INCORRECT NUMBER PARTIAL CREDIT NUMBER DISTRACTOR A/1 NUMBER DISTRACTOR B/2 NUMBER DISTRACTOR C/3 NUMBER DISTRACTOR D/4 NUMBER NO ANSWER 1 2 3 4 5 6 7 8 9 10

43
ITEM ANALYSIS ACTIVITY

44
Pareto Chart Use to: Rank issues in order of occurrence Decide which problems need to be addressed first Find the issues that have the greatest impact Monitor impact of changes

45
Pareto Chart: Types of mistakes in Division Problems 0 10 20 30 40 50 60 70 80 90 100 Incorrect multiplicationIncorrect subtractionNo decimalOther Mistake Percent 0 10 20 30 40 50 60 70 80 90 100 Cumulative percentage

47
Conclusion With the run charts, scatter diagrams, and histograms, educators can do a far better job of leading the vast majority to meet grade-level standards. With the run charts, scatter diagrams, and histograms, educators can do a far better job of leading the vast majority to meet grade-level standards. The key is using the statistical tools to create teams (teachers & students, teachers and principals, site staff, and district office staff) that are working together to create all-time-bests in every aspect of schooling. The key is using the statistical tools to create teams (teachers & students, teachers and principals, site staff, and district office staff) that are working together to create all-time-bests in every aspect of schooling.
 that are working together to create all-time-bests in every aspect of schooling. The key is using the statistical tools to create teams (teachers & students, teachers and principals, site staff, and district office staff) that are working together to create all-time-bests in every aspect of schooling..")
48
Data analysis provides: Insight and Questions

49
Adapted from Getting Excited About Data, Edie Holcomb www.corwinpress.com What question are we trying to answer? What can we tell from the data? What can we NOT tell from the data? What else might we want to know? What good news is here for us to celebrate? What opportunities for improvement are suggested by the data? Questions to Ponder…

50
Action Answers! Provides

51
What information have I gained from my data? What interventions can I put In place? Implement the plan. Analyze the results. Make improvements. Steps to Improvement PLAN DO STUDY ACT

52
Personal Action Plan What data can I access? What tools can I use to help me monitor progress toward our class goals? What/who else do I need to help me? What is my start date? How will I evaluate the results? P D S A

Similar presentations