Download presentation
Presentation is loading. Please wait.

1
Phosphorous Loading in the Blackstone Watershed Where does it come from And What can we do about it? Blackstone River User’s Conference September 18, 2012 Peter Coffin, Coordinator, Blackstone River Coalition

6
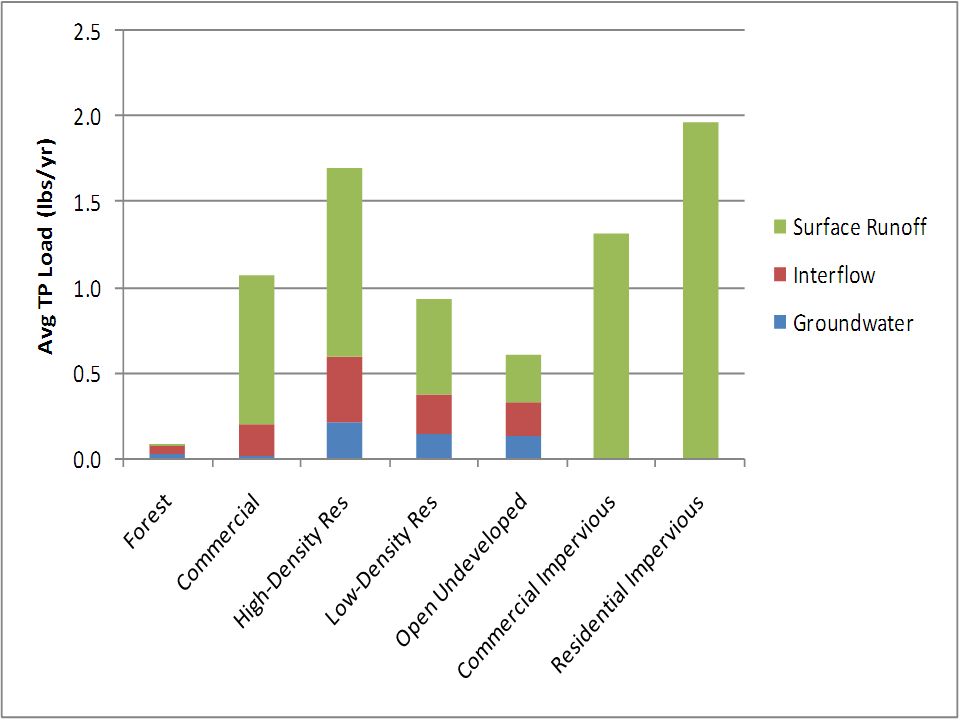
MAMADEPCWMHSPF LU CodeDescription PPP 3Forest 0.0950.040.10 10Res MultiMulti-family Residential3.091.97 11Res High Den High Density Residential (< 0.25 acre lots) 2.410.261.71 13Res Low Den Low Density Residential (> 0.5 acre lots) 1.570.320.94 15CommercialGeneral Urban, Shopping Center1.691.08 17Urban Open Parks, Cemeteries, Undeveloped Open Land 0.810.61 18Transport Airports, Docks, Divided Highways, Freight, Railroads 2.721.32 Regional and model export coefficient comparison for phosphorus in lbs/acre/year
 Res Low Den Low Density Residential (> 0.5 acre lots) CommercialGeneral Urban, Shopping Center Urban Open Parks, Cemeteries, Undeveloped Open Land Transport Airports, Docks, Divided Highways, Freight, Railroads Regional and model export coefficient comparison for phosphorus in lbs/acre/year")
7
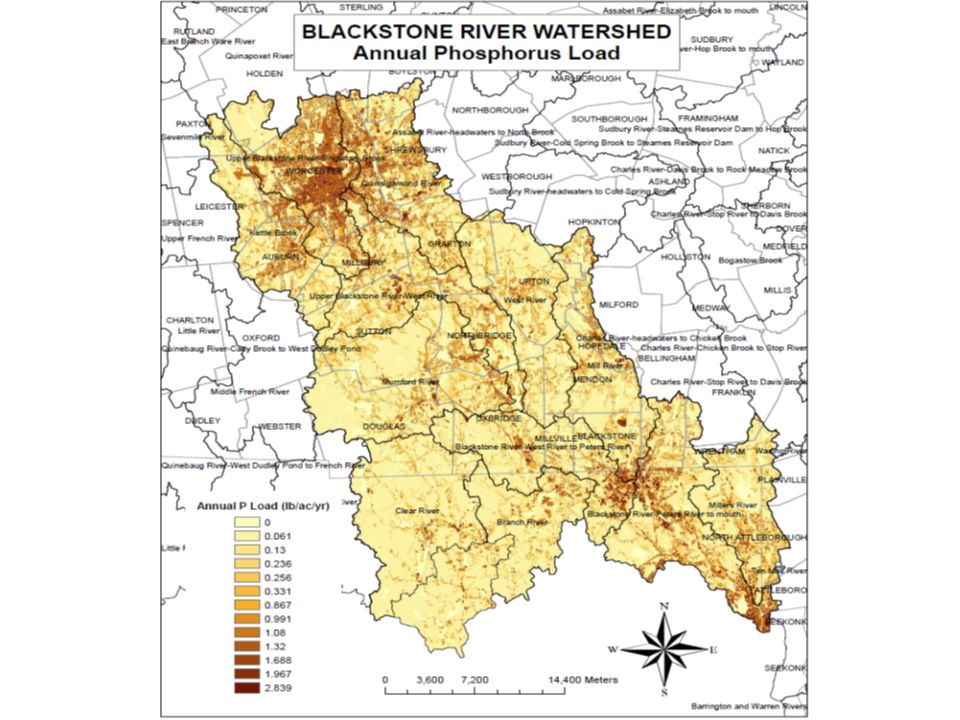
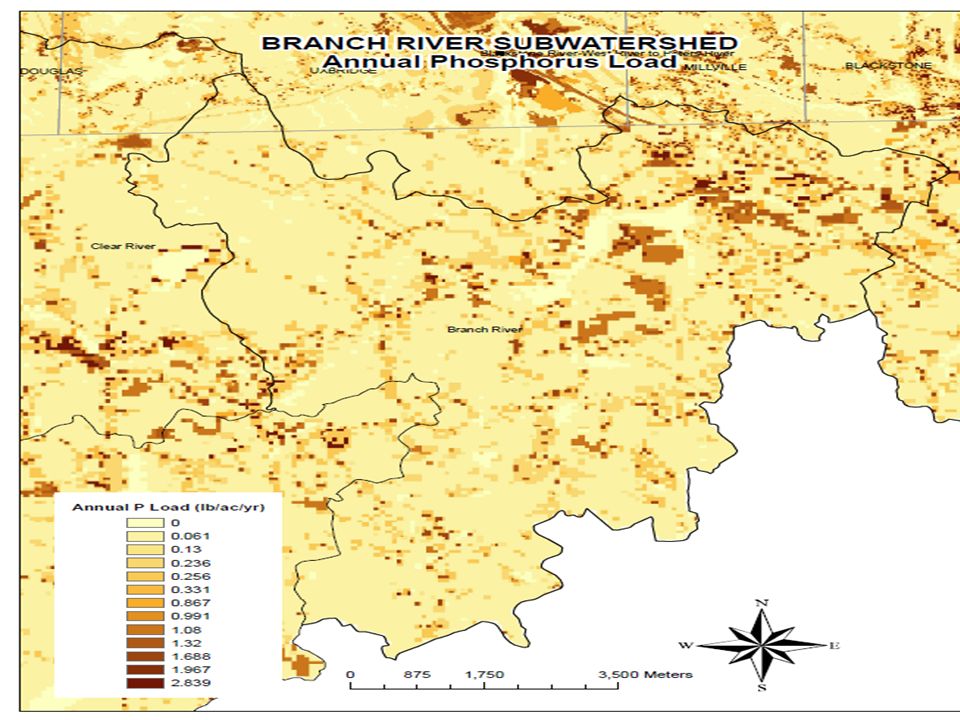
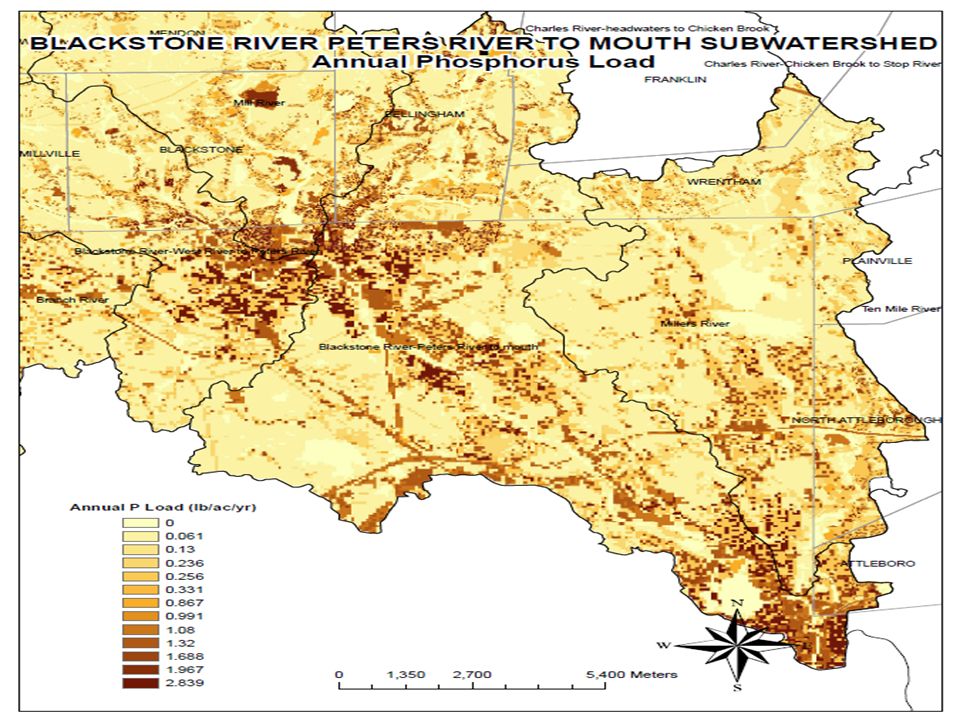
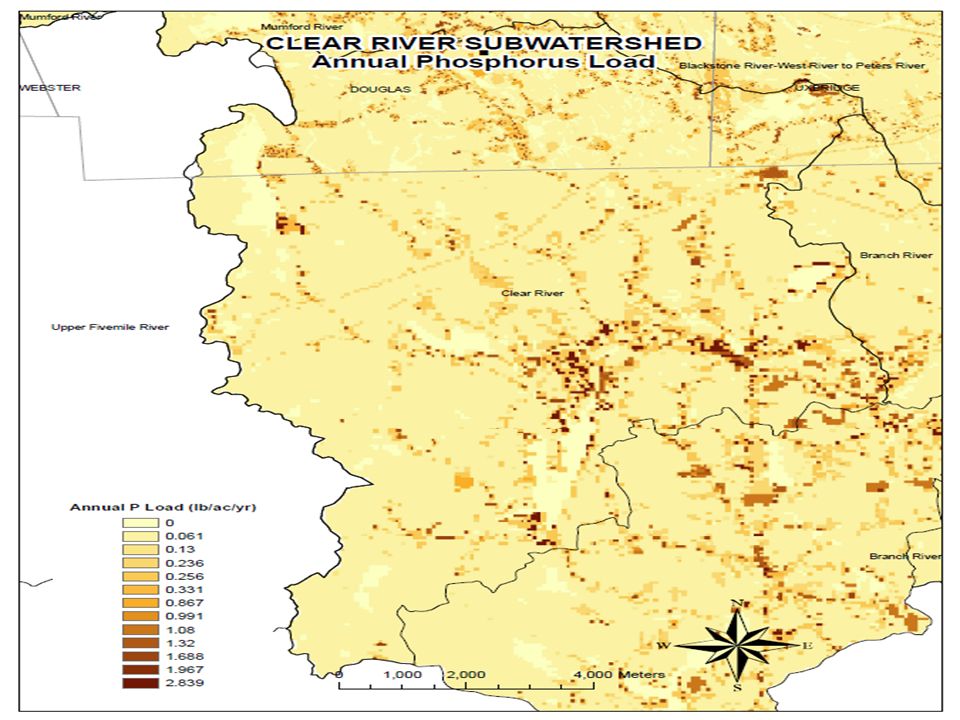
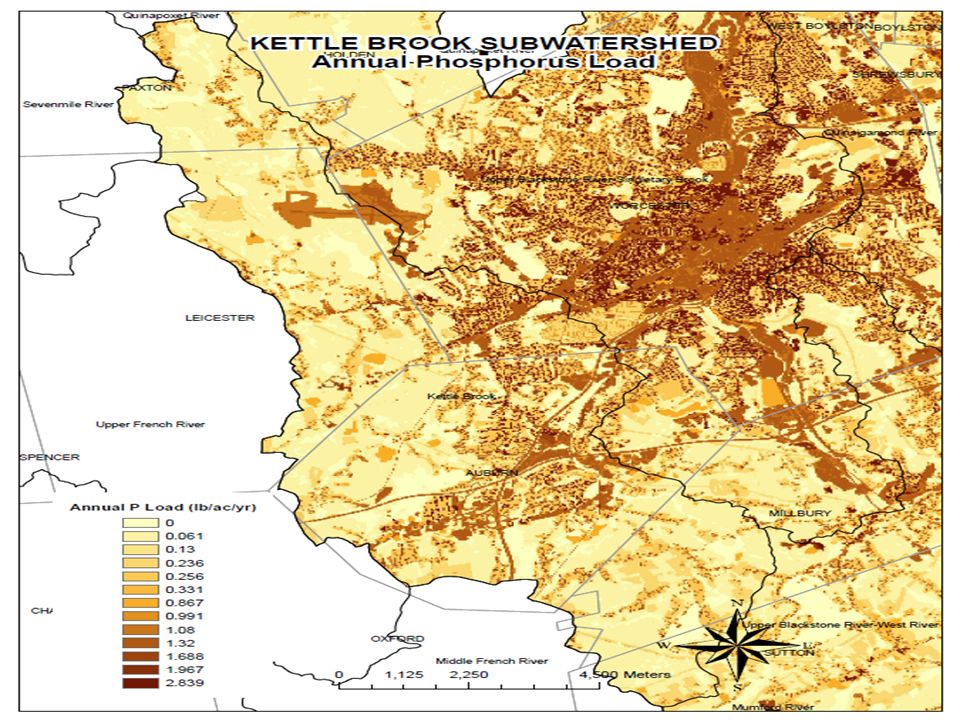
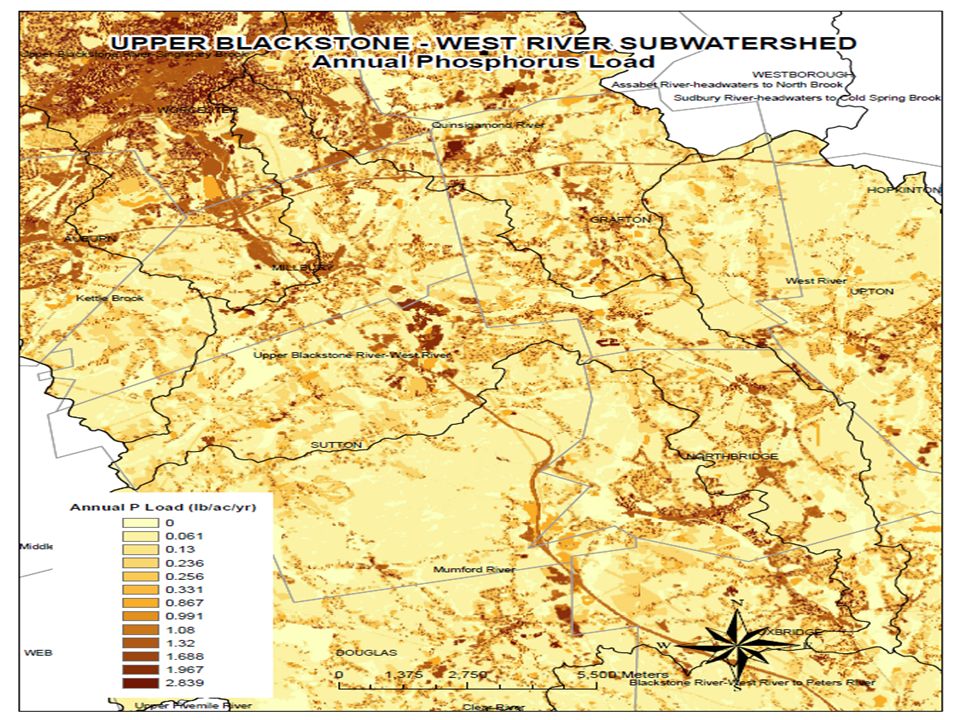
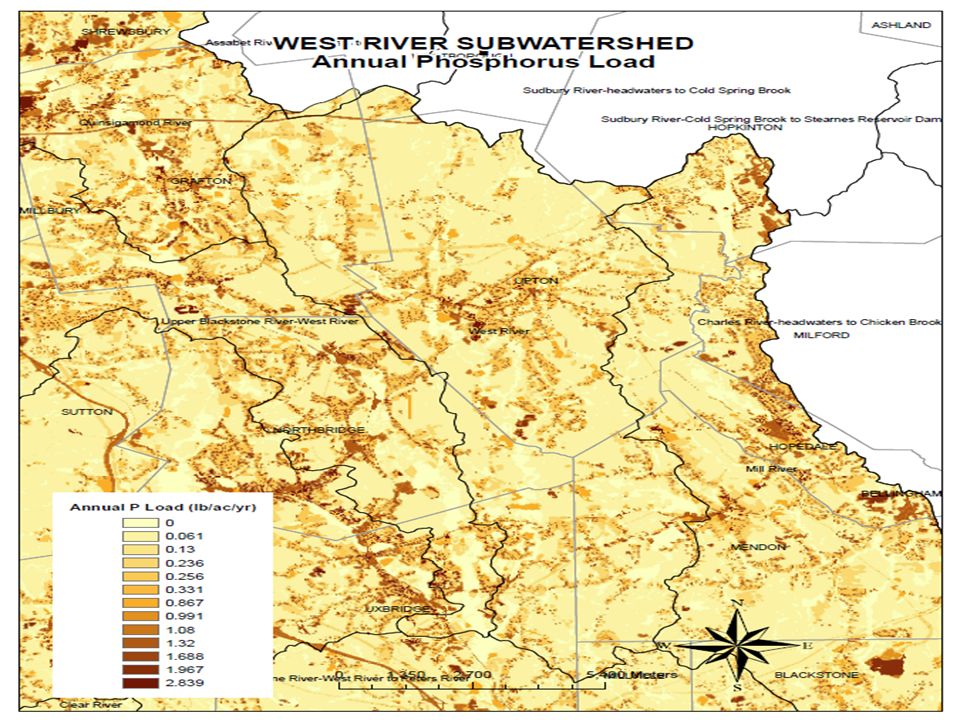
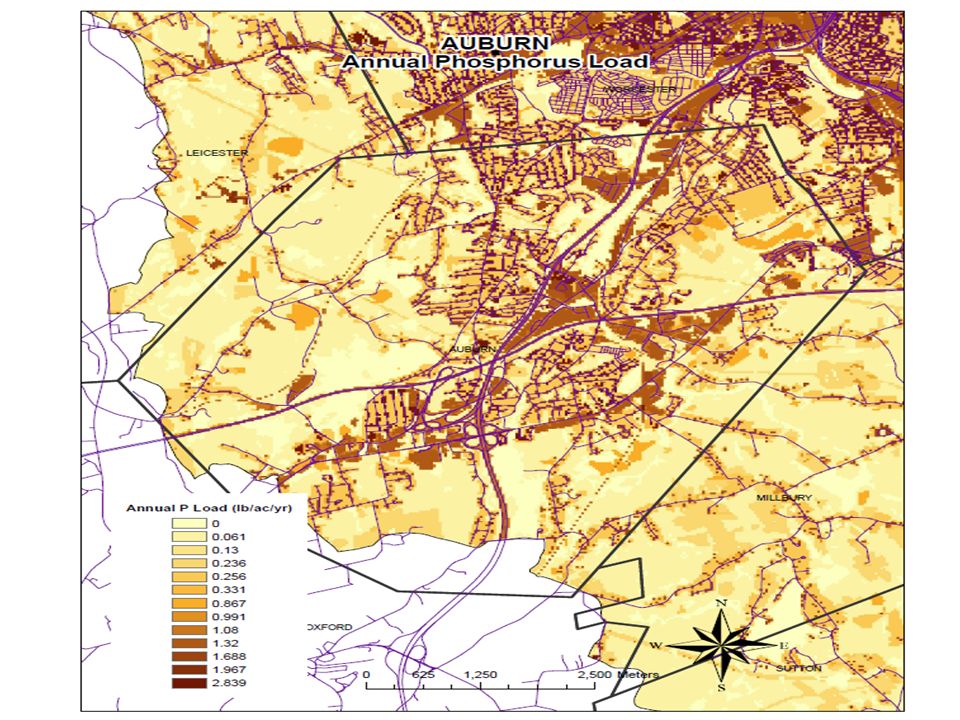
Land Use Code*Land UsePerviousImpervious 1Cropland0.2360.991 2Pasture0.2360.991 3Forest0.0610.13 4Non-Forested Wetland00 5Mining1.081.967 6Open Land0.867 7Participation Recreation0.2361.32 8Spectator Recreation0.2562.839 9Water-Based Recreation00 10Multi-Family Residential0.2562.839 11High Density Residential0.2562.839 12Medium Density Residential0.2561.688 13Low Density Residential0.2561.688 14Saltwater Wetland00 15Commercial1.081.32 16Industrial1.081.32 17Transitional0.2561.688 18Transportation1.081.32 19Waste Disposal1.081.32 20Water00 23Cranberry bog00 24Powerline/Utility0.2360.991 25Saltwater Sandy Beach00 26Golf Course0.2561.688 29Marina00 31Urban Public/Institutional0.3312.839 34Cemetery0.2360.991 35Orchard0.0610.13 36Nursery0.2561.688 37Forested Wetland00 38Very Low Density Residential0.2561.688 39Junkyard1.081.32 40Brushland/Successional0.2360.991 Phosphorus Load (lb./ac/year) in Blackstone River Watershed from HSPF Model
 in Blackstone River Watershed from HSPF Model")
15
Overlay Phosporous Load Map on to Google Earth 30 meter pixels highlight Phosphorous Loads

17
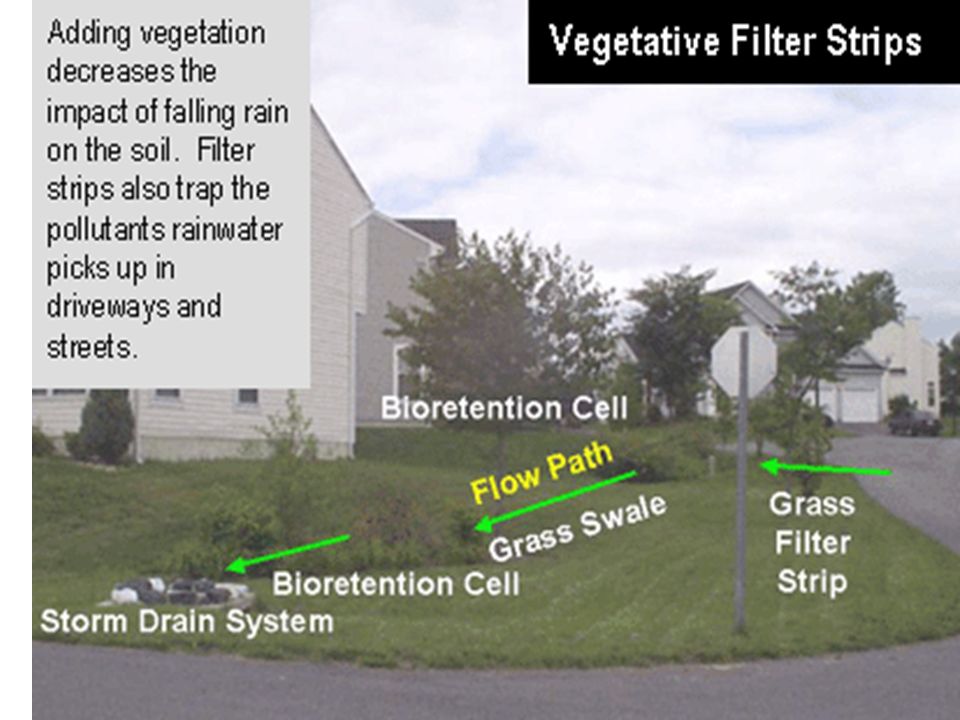
Bioretention and rain gardens use plant and microbes in the practices to treat pollutant loads. These can range in removal efficiency of 30% to 90% (MA DEP).
..")
18
Water Quality Swale (Image Source: Portland Bureau of Environmental Services) These are vegetated open channels to treat 10-year storms (MADEP). Pollutant removal efficiency is 20% to 90% for phosphorus.

Similar presentations


 APPROACH TO INDUSTRIAL ECOLOGY Presented by Berna Yenice-Ay, Ph.D. March 12,>")


>")
. WHERE’S MEGALOPOLIS?>")


