Download presentation
Presentation is loading. Please wait.

1
Assessing Information from Multilevel and Continuous Tests Likelihood Ratios for results other than “+” or “-” Michael A. Kohn, MD, MPP 10/13/2011

2
Four Main Points 1) Making a multi-level test dichotomous by choosing a fixed cutpoint reduces the value of the test. 2) The ROC curve summarizes the ability of the test to differentiate between D+ and D- individuals. 3) LR(result) = P(result|D+)/P(result|D-) = slope of ROC curve. (NOTE: Do not calculate an LR(+) or LR(-) for a multilevel test.) 4) Pre-Test Odds x LR(result) = Post-Test Odds
 The ROC curve summarizes the ability of the test to differentiate between D+ and D- individuals. 3) LR(result) = P(result|D+)/P(result|D-) = slope of ROC curve. (NOTE: Do not calculate an LR(+) or LR(-) for a multilevel test.) 4) Pre-Test Odds x LR(result) = Post-Test Odds.")
3
NOTE Do not calculate an LR(+) or LR(-) for a test with more than two possible results.
 or LR(-) for a test with more than two possible results.")
4
Additional Topics Walking Man Weird ROC Curves

5
Example from Chapter 3 65-year-old woman with mammogram suspicious for malignancy Pre-test probability ≈ 0.015 LR(“suspicious for malignancy”) ≈ 100 Post-test probability = ?
 ≈ 100 Post-test probability =")
6
Update Pre-Test Probability Using LR(test result) 1) Convert pre-test probability (P) to pre- test odds. Pre-Test Odds = P/(1-P) 2) Calculate LR. P(result|D+)/P(result|D-). 3) Post-Test Odds = Pre-Test Odds × LR 4) Convert post-test odds to post-test probability. Prob = Odds/(1+Odds)
 2) Calculate LR. P(result|D+)/P(result|D-). 3) Post-Test Odds = Pre-Test Odds × LR 4) Convert post-test odds to post-test probability. Prob = Odds/(1+Odds).")
7
Update Pre-Test Probability Using LR(test result) 1) Pre-test probability P = 0.015 Pre-test odds = P/(1-P) ≈ 0.015 2) LR(“Suspicious for Malignancy”) = 100 3) Post-Test Odds = 0.015 × 100 = 1.5 4) Post-test probability = Odds/(1+Odds) = 1.5/2.5 = 0.60
 1) Pre-test probability P = Pre-test odds = P/(1-P) ≈ ) LR( Suspicious for Malignancy ) = 100 3) Post-Test Odds = × 100 = 1.5 4) Post-test probability = Odds/(1+Odds) = 1.5/2.5 = 0.60")
8
Can Use Slide Rule

9
Can Use Excel

10
Can Use Web-Based Calculator We will come back to this (This ends the example for Chapter 3.)
")
11
Evaluating the Test --Test Characteristics For dichotomous tests, we discussed sensitivity P(+|D+) and specificity P(-|D-) For multi-level and continuous tests, we will discuss the Receiver Operating Characteristic (ROC) curve
 and specificity P(-|D-) For multi-level and continuous tests, we will discuss the Receiver Operating Characteristic (ROC) curve")
12
Using the Test Result to Make Decisions about a Patient For dichotomous tests, we use the LR(+) if the test is positive and the LR(-) if the test is negative For multilevel and continuous tests, we use the LR(r), where r is the result of the test
 if the test is positive and the LR(-) if the test is negative For multilevel and continuous tests, we use the LR(r), where r is the result of the test")
13
Septic Arthritis Bacterial infection in a joint.

14
Clinical Scenario Does this Adult Patient Have Septic Arthritis?

15
A 48-year-old woman with a history of rheumatoid arthritis who has been treated with long-term, low-dose prednisone presents to the emergency department with a 2-day history of a red, swollen right knee that is painful to touch. She reports no prior knee swelling and no recent trauma or knee surgery, illegal drug use, rash, uveitis, or risky sexual behavior. On examination, she is afebrile and has a right knee effusion. Her peripheral white blood cell (WBC) count is 11 000/µL and her erythrocyte sedimentation rate (ESR) is 55 mm/h. An arthrocentesis is performed, and the initial Gram stain is negative. Margaretten, M. E., J. Kohlwes, et al. (2007). Jama 297(13): 1478-88. You have the synovial white blood cell (WBC) count.
 count is /µL and her erythrocyte sedimentation rate (ESR) is 55 mm/h. An arthrocentesis is performed, and the initial Gram stain is negative. Margaretten, M. E., J. Kohlwes, et al. (2007). Jama 297(13): You have the synovial white blood cell (WBC) count..")
16
Clinical Scenario Does this Adult Patient Have Septic Arthritis? Assume pre-test probability of septic arthritis is 0.38. How do you use the synovial WBC result to determine the likelihood of septic arthritis? Margaretten, M. E., J. Kohlwes, et al. (2007). Jama 297(13): 1478-88.
. Jama 297(13):")
17
Why Not Make It a Dichotomous Test? SynovialSeptic Arthritis WBC Count YesNo >25,000 77% 27% ≤ 25,000 23% 73% TOTAL*100%100% *Note that these could have come from a study where the patients with septic arthritis (D+ patients) were sampled separately from those without (D- patients). Margaretten, M. E., J. Kohlwes, et al. (2007). Jama 297(13): 1478-88.
 were sampled separately from those without (D- patients). Margaretten, M. E., J. Kohlwes, et al. (2007). Jama 297(13):")
18
Why Not Make It a Dichotomous Test? Sensitivity = 77% Specificity = 73% LR(+) = 0.77/(1 - 0.73) = 2.9 LR(-) = (1 - 0.77)/0.73 = 0.32 “+” = > 25,000/uL “-” = ≤ 25,000/uL
 = 0.77/( ) = 2.9 LR(-) = ( )/0.73 = = > 25,000/uL - = ≤ 25,000/uL.")
19
Clinical Scenario Synovial WBC = 48,000/mL Pre-test prob: 0.38 LR(+) = 2.9 Post-Test prob = ?
 = 2.9 Post-Test prob =")
20
Clinical Scenario Synovial WBC = 48,000/mL Pre-test prob: 0.38 Pre-test odds: 0.38/0.62 = 0.61 LR(+) = 2.9 Post-Test Odds = Pre-Test Odds x LR(+) = 0.61 x 2.9 = 1.75 Post-Test prob = 1.75/(1.75+1) = 0.64
 = 2.9 Post-Test Odds = Pre-Test Odds x LR(+) = 0.61 x 2.9 = 1.75 Post-Test prob = 1.75/(1.75+1) = 0.64")
21
Clinical Scenario Synovial WBC = 48,000/mL Slide Rule Pre-test prob: 0.38 LR(+) = 2.9 Post-Test prob = (Demonstrate Slide Rule)
 = 2.9 Post-Test prob = (Demonstrate Slide Rule)")
22
Can Use Excel Pre-test prob: 0.38 LR(+) = 2.9 Post-Test prob =
 = 2.9 Post-Test prob =")
23
Can Use Web-Based Calculator http://www.quesgen.com/PostProbofDise ase.php P(+|D+) = Sensitivity = 77% P(+|D-) = 1 - Specificity = 1 - 73% = 27%
 = Sensitivity = 77% P(+|D-) = 1 - Specificity = % = 27%")
24
Clinical Scenario Synovial WBC = 128,000/mL Pre-test prob: 0.38 LR = ? Post-Test prob =?

25
Clinical Scenario Synovial WBC = 128,000/mL Pre-test prob: 0.38 Pre-test odds: 0.38/0.62 = 0.61 LR = 2.9 (same as for WBC=48,000!) Post-Test Odds = Pre-Test Odds x LR(+) = 0.61 x 2.9 = 1.75 Post-Test prob = 1.75/(1.75+1) =.64
 Post-Test Odds = Pre-Test Odds x LR(+) = 0.61 x 2.9 = 1.75 Post-Test prob = 1.75/(1.75+1) =.64")
26
Why Not Make It a Dichotomous Test? Because you lose information. The risk associated with a synovial WBC=48,000 is equated with the risk associated with WBC=128,000. Choosing a fixed cutpoint to dichotomize a multi- level or continuous test throws away information and reduces the value of the test.

27
Main Point 1: Avoid Making Multilevel Tests Dichotomous Dichotomizing a multi-level or continuous test by choosing a fixed cutpoint reduces the value of the test

28
WBC (/uL) Interval % of Septic Arthritis % of No Septic Arthritis >100,00029%1% 50,001-100,00033%7% 25,001-50,00015%19% 0 - 25,00023%73% TOTAL100%
 Interval % of Septic Arthritis % of No Septic Arthritis >100,00029%1% 50, ,00033%7% 25,001-50,00015%19% ,00023%73% TOTAL100%")
29
Test Result % of D+% of D- Most Abnormal29%1% Next Most Abnormal33%7% Next Most Normal15%19% Most Normal23%73% TOTAL100% “LR Table” Used to create a histogram like the next slide.

30
Synovial Fluid WBC Count

31
Histogram Does not reflect prevalence of D+ (Dark D+ columns add to 100%, Open D- columns add to 100%) Sensitivity and specificity depend on the cutpoint chosen to separate “positives” from “negatives” The ROC curve is drawn by serially lowering the cutpoint from highest (most abnormal) to lowest (least abnormal).* * Just said that choosing a fixed cutpoint reduces the value of the test. The key issues are 1) the ROC curve is for evaluating the test, not the patient, and 2) drawing the ROC curve requires varying the cutpoint, not choosing a fixed cutpoint.
 the ROC curve is for evaluating the test, not the patient, and 2) drawing the ROC curve requires varying the cutpoint, not choosing a fixed cutpoint..")
37
WBC Count (x1000/uL) Sensitivity1 - Specificity > ∞ 0% > 10029%1% > 5062%8% > 2577%27% ≥ 0100% Margaretten, M. E., J. Kohlwes, et al. (2007). Jama 297(13): 1478-88. ROC Table
. Jama 297(13): ROC Table.")
38
WBC Count (x1000/uL) Sensitivity1 - Specificity > ∞ 0% > 10029%1% > 5062%8% > 2577%27% ≥ 0100% ROC Table
 Sensitivity1 - Specificity > ∞ 0% > 10029%1% > 5062%8% > 2577%27% ≥ 0100% ROC Table")
39
WBC Count (x1000/uL) Sensitivity1 - Specificity > 10029%1% > 5062%8% > 2577%27% ROC Table
 Sensitivity1 - Specificity > 10029%1% > 5062%8% > 2577%27% ROC Table")
40
Threshold for “+” Sensitivity1 - Specificity High Positive29%1% Medium Positive62%8% Low Positive77%27% Normal ROC Table ROC Table -- thresholds not results; sensitivity and 1 - specificity not proportions; columns don’t sum to 100%. Compare to LR Table on next slide.

41
Test Result % of D+% of D- Most Abnormal29%1% Next Most Abnormal33%7% Next Most Normal15%19% Most Normal23%73% TOTAL100% LR Table -- test results not thresholds; proportions not sensitivities or 1 - specificity; columns total to 100%)
")
42
WBC Count (x1000/uL) Sensitivity1 - Specificity > 10029%1% > 5062%8% > 2577%27% ROC Table used to create an ROC curve like the one on the next slide.
 Sensitivity1 - Specificity > 10029%1% > 5062%8% > 2577%27% ROC Table used to create an ROC curve like the one on the next slide.")
43
Cutoff > ∞ Cutoff > 100k Cutoff > 50k Cutoff > 25k Cutoff ≥ 0

48
Test Discriminates Fairly Well Between D+ and D- Test Result D- D+

49
Test Discriminates Well Between D+ and D-

50
Test Discriminates Poorly Between D+ and D- Test Result D- D+

51
Test Discriminates Poorly Between D+ and D-

52
Cutoff > ∞ Cutoff > 100k Cutoff > 50k Cutoff > 25k Cutoff ≥ 0 Area Under Curve = 0.8114 Area Under ROC Curve

53
Summary measure of test’s discriminatory ability Probability that a randomly chosen D+ individual will have a more positive test result than a randomly chosen D- individual

54
Area Under ROC Curve Corresponds to the Mann-Whitney U Test Statistic (same P value as Wilcoxon Rank Sum), which is the non-parametric equivalent of Student’s t test. Also corresponds to the “c statistic” reported in logistic regression models

55
Main Point 2 ROC Curve Describes the Test, Not the Patient Describes the test’s ability to discriminate between D+ and D- individuals Not particularly useful in interpreting a test result for a given patient

56
ROC Curve Describes the Test, Not the Patient Clinical Scenario Synovial WBC count = 48,000 Synovial WBC count = 128,000

57
Synovial WBC count = 48,000

58
Cutoff > ∞ Cutoff > 100k Cutoff > 50k Cutoff > 25k Cutoff ≥ 0

59
Sensitivity, Specificity, LR(+), and LR(-) of the Synovial Fluid WBC Count for Septic Arthritis at 3 Different Cutoffs WBC (/uL)SensitivitySpecificityLR+LR- >100,00029%99%29.00.7 >50,00062%92%7.80.4 >25,00077%73%2.90.3 Synovial WBC Count = 48,000/uL Which LR should we use?
, and LR(-) of the Synovial Fluid WBC Count for Septic Arthritis at 3 Different Cutoffs WBC (/uL)SensitivitySpecificityLR+LR- >100,00029%99% >50,00062%92% >25,00077%73% Synovial WBC Count = 48,000/uL Which LR should we use")
60
Sensitivity, Specificity, LR(+), and LR(-) of the Synovial Fluid WBC Count for Septic Arthritis at 3 Different Cutoffs WBC (/uL)SensitivitySpecificityLR+LR- >100,00029%99%29.00.7 >50,00062%92%7.80.4 >25,00077%73%2.90.3 Synovial WBC Count = 48,000/uL Which LR should we use? NONE of THESE!

61
Do not calculate LR(+) and LR(-) for tests with more than 2 results. Do not report LRs (or PVs) in an ROC table. Report LRs in an LR table.
 in an ROC table. Report LRs in an LR table..")
62
Find a recent paper in your area that presents an ROC table with calculated LR(+) and LR(-) or PPV and NPV. Write a final exam problem and maybe a letter to the editor. Problem-Writing Assignment?

63
Likelihood Ratios LR(result) = P(result|D+)/P(result|D-) P(Result) in patients WITH disease ---------------------------------------------------- P(Result) in patients WITHOUT disease
 = P(result|D+)/P(result|D-) P(Result) in patients WITH disease P(Result) in patients WITHOUT disease")
64
WOWO With Over WithOut

65
Likelihood Ratios The ratio of the height of the D+ distribution to the height of the D- distribution 15% 19% LR = 15%/19% = 0.8

66
> 50k > 25k 15% 19% Slope = 15%/19% =0.8

67
Likelihood Ratio WBC (/uL) Interval % of D+% of D- Interval LR >100,00029%1%29.0 50,001-100,00033%7%4.7 25,001-50,00015%19%0.8 0 - 25,00023%73%0.3
 Interval % of D+% of D- Interval LR >100,00029%1% , ,00033%7%4.7 25,001-50,00015%19% ,00023%73%0.3")
68
Common Mistake When given an “ROC Table,” it is tempting to calculate an LR(+) or LR(-) as if the test were “dichotomized” at a particular cutoff. Example: LR(+,25,000) = 77%/27% = 2.9 This is NOT the LR of a particular result (e.g. WBC >25,000 and ≤ 50,000); it is the LR(+) if you divide “+” from “-” at 25,000.
 = 77%/27% = 2.9 This is NOT the LR of a particular result (e.g. WBC >25,000 and ≤ 50,000); it is the LR(+) if you divide + from - at 25,000..")
69
WBC (/uL)SensitivitySpecificityLR+LR- >100,00029%99%29.00.7 >50,00062%92%7.80.4 >25,00077%73%2.90.3 Common Mistake
SensitivitySpecificityLR+LR- >100,00029%99% >50,00062%92% >25,00077%73% Common Mistake")
70
27% 77% > 25,000 Common Mistake

71
From JAMA paper: “Her synovial WBC count of 48,000/µL increases the probability from 38% to 64%.” (Used LR = 2.9) Correct calculation: Her synovial WBC count of 48,000/µL decreases the probability from 38% to 33%.” (Used LR = 0.8)
 Correct calculation: Her synovial WBC count of 48,000/µL decreases the probability from 38% to 33%. (Used LR = 0.8)")
72
Main Point 3 Likelihood Ratio P(Result) in patients WITH disease ------------------------------------------------------ P(Result) in patients WITHOUT disease Slope of ROC Curve Do not calculate an LR(+) or LR(-) for a multilevel test.
 in patients WITH disease P(Result) in patients WITHOUT disease Slope of ROC Curve Do not calculate an LR(+) or LR(-) for a multilevel test.")
73
Clinical Scenario Synovial WBC = 48,000/uL* Pre-test prob: 0.38 Pre-test odds: 0.38/0.62 = 0.61 LR(WBC btw 25,000 and 50,000) = 0.8 Post-Test Odds = Pre-Test Odds x LR(48) = 0.61 x 0.8 = 0.49 Post-Test prob = 0.49/(0.49+1) = 0.33 *Can use slide rule, Excel, or web page
 = 0.8 Post-Test Odds = Pre-Test Odds x LR(48) = 0.61 x 0.8 = 0.49 Post-Test prob = 0.49/(0.49+1) = 0.33 *Can use slide rule, Excel, or web page")
74
Clinical Scenario Synovial WBC = 128,000/uL* Pre-test prob: 0.38 Pre-test odds: 0.38/0.62 = 0.61 LR(128,000/uL) = 29 Post-Test Odds = Pre-Test Odds x LR(128) = 0.61 x 29 = 17.8 Post-Test prob = 17.8/(17.8+1) = 0.95 *Can use slide rule, Excel, or web page
 = 29 Post-Test Odds = Pre-Test Odds x LR(128) = 0.61 x 29 = 17.8 Post-Test prob = 17.8/(17.8+1) = 0.95 *Can use slide rule, Excel, or web page")
75
Clinical Scenario WBC = 48,000/uL Post-Test Prob = 0.33 WBC = 128,000/uL Post-Test Prob = 0.95 (Recall that dichotomizing the WBC with a fixed cutpoint of 25,000/uL meant that WBC = 48,000/uL would be treated the same as WBC = 128,000/uL and post-test prob = 0.64)
")
76
Main Point 4 Bayes’s Rule Pre-Test Odds x LR(result) = Post-Test Odds What you knew before + What you learned = What you know now
 = Post-Test Odds What you knew before + What you learned = What you know now")
77
Conforms to Clinical Intuition

78
Synovial WBC for Septic Arthritis WBC < 2000 very reassuring WBC 2000 – 25,000 somewhat reassuring WBC 25,000 – 50,000 indeterminate WBC 50,000 – 100,000 worrisome WBC > 100,000 very worrisome

79
Summary 1) Dichotomizing a multi-level test by choosing a fixed cutpoint reduces the value of the test. 2) The ROC curve summarizes the discriminatory ability of the test. 3) LR(result) = P(result|D+)/P(result|D-) = Slope of ROC Curve (NOTE: Do not calculate an LR(+) or LR(-) for a multilevel test.) 4) Pre-Test Odds x LR(result) = Post-Test Odds
 The ROC curve summarizes the discriminatory ability of the test. 3) LR(result) = P(result|D+)/P(result|D-) = Slope of ROC Curve (NOTE: Do not calculate an LR(+) or LR(-) for a multilevel test.) 4) Pre-Test Odds x LR(result) = Post-Test Odds.")
80
Additional Topics Walking Man Weird ROC Curves (WBC in febrile newborns)
")
81
THE WALKING MAN OR …

82
… WHAT CAN YOU LEARN FROM ROC CURVES LIKE THESE? Bonsu, B. K. and M. B. Harper (2003). "Utility of the peripheral blood white blood cell count for identifying sick young infants who need lumbar puncture." Ann Emerg Med 41(2): 206-14.
. Utility of the peripheral blood white blood cell count for identifying sick young infants who need lumbar puncture. Ann Emerg Med 41(2):")
83
“Walking Man” Approach to ROC Curves Divide vertical axis into d steps, where d is the number of D+ individuals Divide horizontal axis into n steps, where n is the number of D- individuals Sort individuals from most to least abnormal test result Moving from the first individual (with the most abnormal test result) to the last (with the least abnormal test result)…
 to the last (with the least abnormal test result)…")
84
“Walking Man” (continued) …call out “D” if the individual is D+ and “N” if the individual is D- Let the walking man know when you reach a new value of the test The walking man takes a step up every time he hears “D” and a step to the right every time he hears “N” When you reach a new value of the test, he drops a stone.
 …call out D if the individual is D+ and N if the individual is D- Let the walking man know when you reach a new value of the test The walking man takes a step up every time he hears D and a step to the right every time he hears N When you reach a new value of the test, he drops a stone.")
85
Synovial WBC Count in 5 Patients with Septic Arthritis Patient WBC Count (x 1000/uL) D1128 D292 D364 D437 D524
 D1128 D292 D364 D437 D524")
86
Synovial WBC Count in 10 Patients Without Septic Arthritis PatientWBC Count (x 1000) N171 N248 N337 N423 N512 N612 N78 N87 N96 N100
 N171 N248 N337 N423 N512 N612 N78 N87 N96 N100")
87
Septic ArthritisNo Septic Arthritis 128 92 71 64 48 37 24 23 12 8 7 6 0

88
DDNDN(DN)DN(NN)NNNN
DN(NN)NNNN")
91
… WHAT CAN YOU LEARN FROM ROC CURVES LIKE THESE?

92
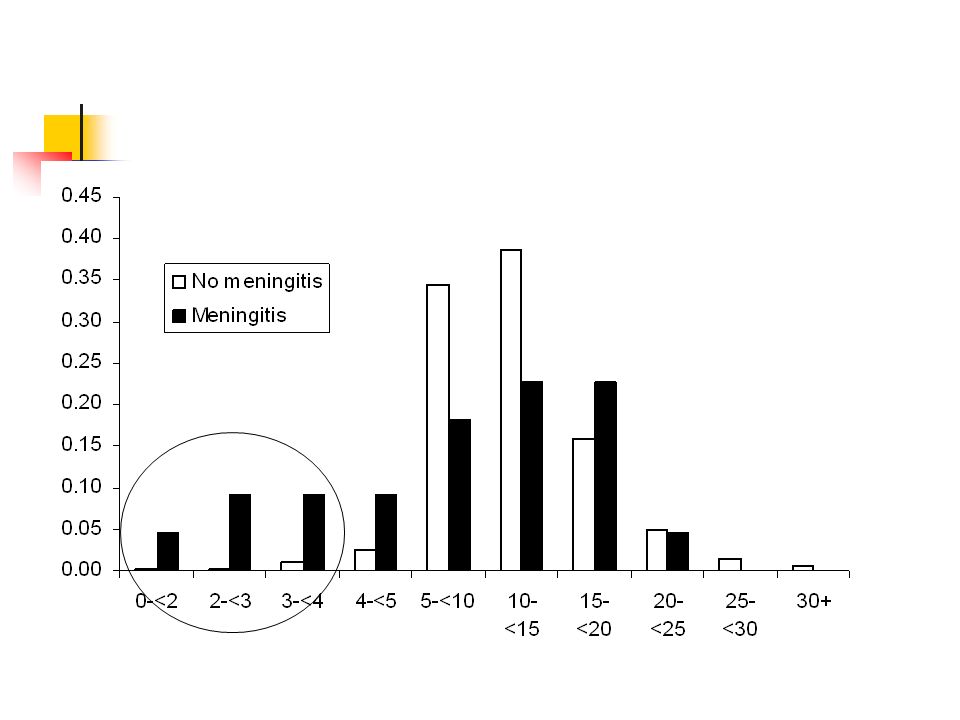
Peripheral WBC Count as Test for Bacterial Meningitis Cross sectional study of test accuracy Index test: peripheral WBC count Reference Standard: CSF culture Population: Infants 3-89 days old evaluated in a pediatric ED for serious bacterial infection. Ann Emerg Med. 2003;41:206-214.

97
Overall meningitis 22/5353 = 4.1 /1000 If WBC < 4k, 5/88 = 57 /1000 LR(WBC < 4k) ≈ 15
 ≈ 15")
98
Decisions to perform or withhold lumbar puncture should not be based on prevailing interpretations of the total peripheral blood WBC counts to maximize detection of bacterial meningitis in young infants. [Ann Emerg Med. 2003;41:206-214.] Authors’ Conclusion

99
EBD Conclusion? While the total peripheral blood WBC count is not often helpful in identifying bacterial meningitis, young infants with very low WBC counts (e.g. < 4k) are at high risk and should definitely receive an aggressive workup including lumbar puncture.
 are at high risk and should definitely receive an aggressive workup including lumbar puncture..")
Similar presentations


. Their results change the probability of disease Negative testPositive test Reassurance Treatment Order a Test A good test moves.>")
 Multilevel Tests (Michael) Likelihood ratios for results other than + or ->")


 and Continuous Tests ROC curves and Likelihood Ratios for results other than “+” or “-” Michael A. Kohn,>")

 Curves>")


>")


