Download presentation
Presentation is loading. Please wait.

1
Lecture 3 Validity of screening and diagnostic tests
Reliability: kappa coefficient Criterion validity: “Gold” or criterion/reference standard Sensitivity, specificity, predictive value Relationship to prevalence Likelihood ratio ROC curve Diagnostic odds ratio Lecture 3 (Sept 7)
")
2
Clinical/public health applications
screening: for asymptomatic disease (e.g., Pap test, mammography) for risk (e.g., family history of breast cancer case-finding: testing of patients for diseases unrelated to their complaint diagnostic: to help make diagnosis in symptomatic disease or to follow-up on screening test
 for risk (e.g., family history of breast cancer. case-finding: testing of patients for diseases unrelated to their complaint. diagnostic: to help make diagnosis in symptomatic disease or to follow-up on screening test.")
3
Evaluation of screening and diagnostic tests
Performance characteristics test alone Effectiveness (on outcomes of disease): test + intervention
: test + intervention.")
4
Criteria for test selection
Reliability Validity Feasibility Simplicity Cost Acceptability

5
Measures of inter- and intra-rater reliability: categorical data
Percent agreement limitation: value is affected by prevalence - higher if very low or very high prevalence Kappa statistic takes chance agreement into account defined as fraction of observed agreement not due to chance

6
Kappa statistic Kappa = p(obs) - p(exp) 1 - p(exp)
p(obs): proportion of observed agreement p(exp): proportion of agreement expected by chance
: proportion of observed agreement. p(exp): proportion of agreement expected by chance.")
8
Interpretation of kappa
Various suggested interpretations Example: Lanis & Koch, Fleiss excellent: over 0.75 fair to good: poor: less than 0.40

9
Validity (accuracy) of screening/diagnostic tests
Face validity, content validity: judgement of the appropriateness of content of measurement Criterion validity concurrent predictive

10
Normal vs abnormal Statistical definition Clinical definition
“Gaussian” or “normal” distribution Clinical definition using criterion

15
Selection of criterion (“gold” or criterion standard)
Concurrent salivary screening test for HIV history of cough more than 2 weeks (for TB) Predictive APACHE (acute physiology and chronic disease evaluation) instrument for ICU patients blood lipid level maternal height
 Predictive. APACHE (acute physiology and chronic disease evaluation) instrument for ICU patients. blood lipid level. maternal height.")
16
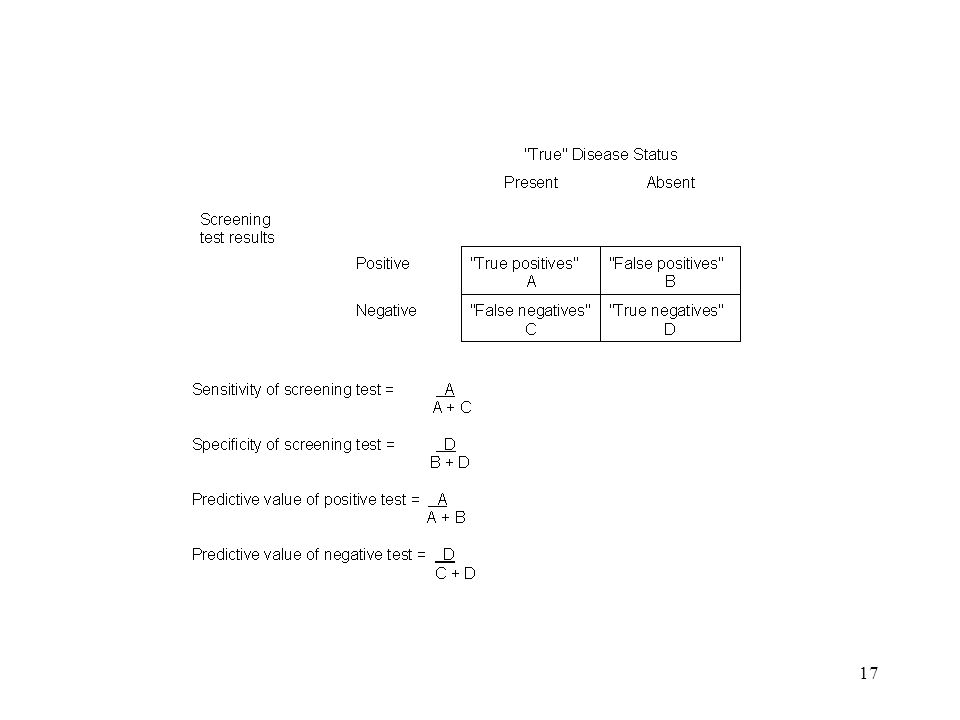
Sensitivity and specificity
Assess correct classification of: People with the disease (sensitivity) People without the disease (specificity)
 People without the disease (specificity)")
18
Predictive value More relevant to clinicians and patients
Affected by prevalence

19
Choice of cut-point If higher score increases probability of disease
Lower cut-point: increases sensitivity, reduces specificity Higher cut-point: reduces sensitivity, increases specificity

20
Considerations in selection of cut-point
Implications of false positive results burden on follow-up services labelling effect Implications of false negative results Failure to intervene

21
Receiver operating characteristic (ROC) curve
Evaluates test over range of cut-points Plot of sensitivity against 1-specificity Area under curve (AUC) summarizes performance: AUC of 0.5 = no better than chance
 summarizes performance: AUC of 0.5 = no better than chance.")
23
Likelihood ratio Likelihood ratio (LR) = sensitivity 1-specificity
Used to compute post-test odds of disease from pre-test odds: post-test odds = pre-test odds x LR pre-test odds derived from prevalence post-test odds can be converted to predictive value of positive test

24
Example of LR prevalence of disease in a population is 25%
sensitivity is 80% specificity is 90%, pre-test odds = = 1/3 likelihood ratio = = 8 1-0.90

25
Example of LR (cont) If prevalence of disease in a population is 25%
pre-test odds = = 1/3 post-test odds = 1/3 x 8 = 8/3 predictive value of positive result = 8/3+8 = 8/11 = 73%

26
Diagnostic odds ratio Ratio of odds of positive test in diseased vs odds of negative test in non-diseased: a.d b.c From previous example: OR = 8 x 27 = 36 2 x 3

27
Summary: LR and DPR Values: Relationship to prevalence?
1 indicates that test performs no better than chance >1 indicates better than chance <1 indicates worse than chance Relationship to prevalence?

28
Applications of LR and DOR
Likelihood ratio: Primarily in clinical context, when interest is in how much the likelihood of disease is increased by use of a particular test Diagnostic odds ratio Primarily in research, when interest is in factors that are associated with test performance (e.g., using logistic regression)
")
Similar presentations