Download presentation
Presentation is loading. Please wait.

1
Presentation to National Campus Compensation & Benefits Study Results of Stages One & Two September 2010 College of Micronesia-FSM

2
Background Overview

3
COM’s current compensation model has four classifications of employees : Classified, Professional, Management and Faculty. Since their adoption in 1996 the classifications have not been adjusted to reflect appropriate labor markets and relevant economic standards. Background Overview

4
In brief, the study is to address the following areas: a) accurate classifications and compensation b) sustainable and competitive pay schedules c) incentive program(s) linking directly to pay schedules d) investigate duplicate and nonessential services Background Overview
 accurate classifications and compensation b) sustainable and competitive pay schedules c) incentive program(s) linking directly to pay schedules d) investigate duplicate and nonessential services Background Overview")
5
Project Overview

6
Stage 2 : External Analysis Stage 1 : Internal Analysis (including Streamlining Supp. Projects : Performance Management Stage 3 : Implementation Project Overview Committee Results / Instructional Master Plan)
.")
7
a) Current Compensation b) Job Evaluation c) Regression Analysis (Internal) Stage One : Internal Analysis d) Job Audit / Streamlining Results
 Current Compensation b) Job Evaluation c) Regression Analysis (Internal) Stage One : Internal Analysis d) Job Audit / Streamlining Results")
8
a) Current Compensation
 Current Compensation")
9
Base Salary5,893,634 69.7 Sp. Contract Services935,640 11.0 Housing822,000 9.7 Social Security379,737 4.5 Health198,669 2.3 Retirement175,583 2.0 Life40,073 0.4 8,445,336100.0 $ % a) Current Compensation Budget - F/Y10
 Current Compensation Budget - F/Y10.")
10
Instructional Affairs2,660,647 44.4 Administration1,752,563 29.3 Student Services954,917 16.9 CRE519,610 9.7 Presidents Office100,776 2.7 5,988,513 100.0 $ % a) Current Compensation Departments - as at 4/7/10
 Current Compensation Departments - as at 4/7/10")
11
National2,788,258 47.6 Pohnpei1,044,568 17.4 Chuuk789,416 13.2 Kosrae577,552 9.6 Yap518,761 8.7 FMI269,958 4.5 5,988,513100.0 $ % a) Current Compensation Campuses - as at 4/7/10
 Current Compensation Campuses - as at 4/7/10")
12
Sp. Service Contracts - Budget (F/Y09)864,198 Sp. Service Contracts - Budget (F/Y10)935,640 $ a) Current Compensation Special Service Contracts
935,640 $ a) Current Compensation Special Service Contracts.")
13
Sp. Service Contracts - Budget (F/Y09)864,198 Sp. Service Contracts - Budget (F/Y10)935,640 Sp. Service Contracts - YTD (F/Y10) - six months782,179 $ a) Current Compensation Special Service Contracts
935,640 Sp. Service Contracts - YTD (F/Y10) - six months782,179 $ a) Current Compensation Special Service Contracts.")
14
Sp. Service Contracts - Budget (F/Y09)864,198 Sp. Service Contracts - Budget (F/Y10)935,640 Sp. Service Contracts - YTD (F/Y10) - six months782,179 Sp. Service Contracts - YTD less UB & TSP695,048 $ a) Current Compensation Special Service Contracts
935,640 Sp. Service Contracts - YTD (F/Y10) - six months782,179 Sp. Service Contracts - YTD less UB & TSP695,048 $ a) Current Compensation Special Service Contracts.")
15
Sp. Service Contracts - Budget (F/Y09)864,198 Sp. Service Contracts - Budget (F/Y10)935,640 Sp. Service Contracts - YTD (F/Y10) - six months782,179 Sp. Service Contracts - YTD less UB & TSP695,048 $ a) Current Compensation Special Service Contracts
935,640 Sp. Service Contracts - YTD (F/Y10) - six months782,179 Sp. Service Contracts - YTD less UB & TSP695,048 $ a) Current Compensation Special Service Contracts.")
16
Instructional Affairs385,63649.3 Administrative Services300,26638.4 Student Services75,3819.6 CRE20,8962.7 TOTAL782,179100.0 $ a) Current Compensation Special Service Contracts %
 Current Compensation Special Service Contracts %")
17
Instructional Affairs385,63649.3 Administrative Services300,26638.4 Student Services75,3819.6 CRE20,8962.7 TOTAL782,179100.0 $ a) Current Compensation Special Service Contracts %
 Current Compensation Special Service Contracts %")
18
Instructional Affairs385,63649.3 Administrative Services300,26638.4 Student Services75,3819.6 CRE20,8962.7 TOTAL782,179100.0 $ a) Current Compensation Special Service Contracts % Sp. Service Contracts held by full-time employees (29%)227,533
227,533.")
19
Instructional Affairs202,313 89.0 Administration21,674 9.5 Student Services1,816 0.8 CRE1,730 0.7 227,533 100.0 $ % a) Current Compensation Special Service Contracts
 Current Compensation Special Service Contracts")
20
b) Job Evaluation
 Job Evaluation")
21
Job evaluation is a process that re-examines the internal equity of all positions based on job size b) Job Evaluation
 Job Evaluation")
22
It achieves this by assessing the ‘job size’ of individual positions within an organization using a number of measurement factors b) Job Evaluation
 Job Evaluation")
23
Each factor provides a point value with their sum representing the total “points” value of the job b) Job Evaluation
 Job Evaluation")
24
Education Experience Complexity Scope of Work Problem Solving Supervision Received Work Environment Physical Demands Authority Exercised Results of Decisions Contacts Sup. & Man. Resp. b) Job Evaluation Criteria
 Job Evaluation Criteria.")
25
147 Positions Evaluated b) Job Evaluation Results
 Job Evaluation Results")
26
Range Max Range Min 1600 - 198 - Job Evaluation Points Average Median 638 - 589 - b) Job Evaluation Results
 Job Evaluation Results")
27
c) Regression Analysis
 Regression Analysis")
28
Company Regression Analysis (Base Salary) c) Regression Analysis Exponential Regression e.g. Position X = 450 JE points

29
Company Regression Analysis (Base Salary) c) Regression Analysis Exponential Regression e.g. Position X = 450 JE points Plot the base salary of all employees with the job title of Position X against 450 JE points

30
Company Regression Analysis (Base Salary) c) Regression Analysis Exponential Regression e.g. Position X = 450 JE points Plot the base salary of all employees with the job title of Position X against 450 JE points

31
COM-FSM c) Regression Analysis
 Regression Analysis")
32
Regression Analysis COM-FSM

33
Regression Analysis Student Services Instructional Affairs Administration Services CRE

34
Regression Analysis FMI Campus Chuuk Campus Pohnpei Campus National Campus Yap Campus Kosrae Campus

35
Regression Analysis Food Services Maintenance Bookstore Accounting Information Technology Human Resources IRPO Dev. & Comm. Relations

36
Regression Analysis LRC Agriculture Maths & Science Education Hotel Management Vocational Education Business Academic Programs Social Science Language & Literature

37
Regression Analysis Peer Counseling SSSP FAO Sports & Recreation ARO Student Life Counseling Dispensary (Plots Only)
")
38
d) Job Audit / Streamlining Results This stage also provided the ideal opportunity to collectively review the organizational structure of the College.
 Job Audit / Streamlining Results This stage also provided the ideal opportunity to collectively review the organizational structure of the College.")
39
The focus here was : a) to investigate duplicate and non-essential services b) to integrate results with the work being undertaken by the College’s Streamlining Committee d) Job Audit / Streamlining Results
 to investigate duplicate and non-essential services b) to integrate results with the work being undertaken by the College’s Streamlining Committee d) Job Audit / Streamlining Results")
40
e) Cost Reduction / Management a) Stakeholder Management d) Master Plan(s) c.f. Instructional Programs f) Performance Management c) Centralization of Supp. Services (where possible) b) Optimization of Regional Campuses Summary of Key Issues
 Performance Management c) Centralization of Supp. Services (where possible) b) Optimization of Regional Campuses Summary of Key Issues.")
41
Demographics COM-FSM

42
Fall Enrollment 2004 - 2009

43
Demographics COM-FSM Average Credits per Site

44
Demographics COM-FSM New Full Time Students Fall 2004 - 2009

45
Demographics COM-FSM Program Completers by School Year / Site

46
Demographics COM-FSM Program Completers by Degree Type

47
Demographics COM-FSM % Students in Good Academic Standing

48
Management Structure Current

49
Management Structure Current Vice President Administration President Vice President Stud. Services Vice President CRE Vice President Inst. Affairs Exec. Director Land Grant

50
Management Structure Current Campus Director Pohnpei Campus Director Chuuk Campus Director Kosrae Campus Director Yap Campus Director FMI Vice President Administration President Vice President Stud. Services Vice President CRE Vice President Inst. Affairs Nat. Campus Exec. Director Land Grant

51
Management Structure Current Campus Director Pohnpei Campus Director Chuuk Campus Director Kosrae Campus Director Yap Campus Director FMI Vice President Administration President Vice President Stud. Services Vice President CRE Vice President Inst. Affairs Prog’s / Services CRE Co-ord.S.S. Co-ord.Inst. Co-ord. Nat. Campus Exec. Director Land Grant

52
- increased confidence in COM-FSM Stakeholder Management - development of partnership(s) c.f. industry - closer relationships / improved communication - collective needs assessment /continuous improvement - greater student focus / preparation / opportunities / jobs - business development / vocational awareness / education

53
Management Structure Proposed Ext. Center Pohnpei Ext. Center Chuuk Ext. Center Kosrae Ext. Center Yap Ext. Center FMI ? Vice President Administration President Vice President Stud. Services Vice President CRE Vice President Inst. Affairs Nat. Campus Exec. Director Land Grant Creation of State Extension Centers

54
Management Structure Proposed Ext. C. Director Pohnpei Ext. C. Director Chuuk Ext. C. Director Kosrae Ext. C. Director Yap Ext. C. Director FMI Vice President Administration President Vice President Stud. Services Vice President CRE Vice President Inst. Affairs Nat. Campus Exec. Director Land Grant

55
Management Structure Proposed Vice President Administration President Vice President Stud. Services Vice President CRE Vice President Inst. Affairs Prog’s / Services CRE Co-ord.Nat. DirectorsInst. Co-ord. Nat. Campus Exec. Director Land Grant Ext. C. Director Pohnpei Ext. C. Director Chuuk Ext. C. Director Kosrae Ext. C. Director Yap Ext. C. Director FMI Nat. Directors

56
Ext. C. Director Pohnpei Ext. C. Director Chuuk Ext. C. Director Kosrae Ext. C. Director Yap Ext. C. Director FMI ? President’s Office Proposed Vice President Administration President Vice President Stud. Services Vice President CRE Vice President Inst. Affairs Exec. Director Land Grant Executive Secretary Receptionist / Telephonist

57
Ext. C. Director Pohnpei Ext. C. Director Chuuk Ext. C. Director Kosrae Ext. C. Director Yap Ext. C. Director FMI ? Vice President Administration President Vice President Stud. Services Vice President CRE Vice President Inst. Affairs Exec. Director Land Grant President’s Office Proposed Director IRPO Director DCR Executive Secretary Receptionist / Telephonist

58
- integrated approach to program development / delivery Instructional Master Plan - balanced mix of quality academic and voc. programs - collective needs assessment /continuous improvement - enhanced program evaluation / assessment / delivery - improved performance management (faculty)
.")
59
Instructional Affairs Proposed Director Voc. Programs Vice President Inst. Affairs Director LRC Coordinator Assessment Director Acad. Programs Coordinator Distance Learn. Secretary

60
Instructional Affairs Academic Programs - Proposed Director Acad. Programs National Campus - Academic Divisional Chairs National Campus - Academic Faculty Acad. Coord. Chuuk E.C. Acad. Coord. Kosrae E.C. Acad. Coord. Yap E.C. 1 x Acad. Chair Faculty 1 x Acad. Chair Faculty 1 x Acad. Chair Faculty COM Academic Programs Note : Pohnpei Academic programs transferred to Nat. Campus

61
Director Voc. Programs National Campus - Vocational Divisional Chairs National Campus - Vocational Faculty Voc. Coord. Chuuk E.C. Voc. Coord. Kosrae E.C. Voc.Coord. Yap E.C. 1 x Voc. Chair Faculty 1 x Voc. Chair Faculty 1 x Voc. Chair Faculty COM Vocational Programs Voc.Coord. FMI E.C. 1 x Voc. Chair Faculty Voc. Coord. Pohnpei E.C. 1 x Voc. Chair Faculty Instructional Affairs Vocational Programs - Proposed

62
Director LRC Librarian III Patron Services Librarian III Tech. Services Coordinator MITC Secretarial Support LRC Proposed Library Staff Tech. Services Patron ServicesMITC

63
- centralized support services (where possible) Extension Centers - increased enrollment / increased revenue - improved operational efficiency - wider curriculum (academic / voc. programs) - optimization of infrastructure / resources
 - optimization of infrastructure / resources.")
64
Centralized Support Services - consistency of service delivery (current) - improved operational efficiency - optimization of resources - coordinated development of new services - timely procurement / delivery of resource materials (special focus)
 - improved operational efficiency - optimization of resources - coordinated development of new services - timely procurement / delivery of resource materials (special focus)")
65
Administrative Services Proposed

66
Director Hum. Resources Vice President Administration Director Info. Tech. Director Maintenance Director Procurement Administrative Services Proposed Internal Service Providers / Centralized Services Comptroller Business Office Secretary

67
Accountant Tres/Budget/SP Accountant Gen.Ledger/LG Accountant Ext. Centers Accountant Payroll Administrative Services Business Office - Proposed Comptroller Business Office Payroll Clerk Accountant Account Clerk Accountant Account Tech. Account Clerk Fiscal Officer / Bookstore Fiscal Officer / Bookstore Fiscal Officer Bookstore Clerk Chuuk Ext.C.Kosrae Ext.C.Yap Ext.C. Note : Pohnpei Ext. Center Business Office services centralized at Nat. Campus Note : Food Services and Bookstore transferred to other National Directors

68
HR. Man. Specialist Administrative Specialist Director Human. Res. Chuuk Ext.C.Kosrae Ext.C.Yap Ext.C. Note : Pohnpei Ext. Center HR services centralized at Nat. Campus Administrative Services Human Resources - Proposed HR. Man. Spec. HR. Man. Specialist

69
Systems Administrator Information Systems Spec. Information Systems Spec. Information Systems Spec. Director Info. Tech. Administrative Services Information Technology - Proposed Chuuk Ext.C.Kosrae Ext.C.Yap Ext.C. Note : Pohnpei Ext. Center IT services centralized at Nat. Campus Info. Sys. Spec. Programmer Information Systems Spec. Administration Assistant

70
Journey Worker Electrician Director Maintenance Administrative Services Maintenance - Proposed 1 x Main. Wkr Equip. Maint. Journey Worker Electrician 2 x Main. Wkrs Elect. / Refrig. Journey Worker Plumber 2 x Main. Wkrs Water / W.Water Journey Worker Carpenter 3 x Main. Wkrs Buildings Grounds Main. Leader 3 x Main. Wkrs Grounds Continued Project Manager

71
Security / Safety Supervisor Director Maintenance Administrative Services Maintenance - Proposed 2 x Shift Sup. Security / Safety Administrative Assistant 1 x Clerk Admin/Mail Chuuk Ext.C.Kosrae Ext.C.Yap Ext.C. Note : Pohnpei Extension Center Maintenance services centralized at National Campus Program Specialist 13 x Guards (SC) 3 x Main. Wkrs Program Specialist 2 x Main. Wkrs Program Specialist 2 x Main. Wkrs
 3 x Main. Wkrs Program Specialist 2 x Main. Wkrs Program Specialist 2 x Main. Wkrs.")
72
Procurement Officer Procurement Officer Clerk Administrative Services Procurement - Proposed Director Procurement Fiscal Officer / Bookstore Fiscal Officer / Bookstore Bookstore Clerk Chuuk Ext.C.Kosrae Ext.C.Yap Ext.C. Note : Pohnpei Ext. Center Bookstore services centralized at Nat. Campus

73
Student Services Proposed

74
Director Financial Aid Vice President Student Services Director Student Life Prog. Director SSSP Prog. Director Peer Counseling Registrar Secretary Student Services Proposed Director Counseling Director Food Services

75
Data Processing Assistant Data Processing Assistant Data Processing Assistant Administrative Services Admissions & Records - Proposed Registrar Student Services Specialist Student Services Specialist Kosrae Ext.C.Yap Ext.C. Note : Pohnpei Ext. Center Admissions & Records services centralized at Nat. Campus Clerk / Typist Student Services Specialist Chuuk Ext.C. Duties consolidated with Financial Aid

76
Work Study Coordinator Financial Aid Coordinator Financial Aid Coordinator Administrative Services Financial Aid - Proposed Director Financial Aid Student Services Specialist Student Services Specialist Kosrae Ext.C.Yap Ext.C. Note : Pohnpei Ext. Center Financial Aid services centralized at Nat. Campus Clerk Student Services Specialist Chuuk Ext.C. Duties consolidated with A&R Financial Aid Coordinator

77
Tutoring Prog. Coordinator Prog. Coordinator Prog. Administrative Services Counseling - Proposed Director Counseling Student Services Specialist Student Services Specialist Kosrae Ext.C.Yap Ext.C. Note : Pohnpei Ext. Center Counseling services centralized at Nat. Campus Student Services Specialist ? Student Services Specialist Chuuk Ext.C. Sp. Contract x ?

78
Administrative Services Student Life - Proposed Director Student Life Student Services Specialist (S&R) Student Services Specialist (S&R) Kosrae Ext.C.Yap Ext.C. Note : Pohnpei Ext. Center Student Life services centralized at Nat. Campus Student Services Specialist (S&R) Chuuk Ext.C. Male Dorm College Nurse 4 x Dorm Ass. ? Female Dorm 4 x Dorm Ass. ? Sports & Rec. 4 x S. S. Spec’s Sports & Rec. College Nurse Health Assistant
 Chuuk Ext.C. Male Dorm College Nurse 4 x Dorm Ass. Female Dorm 4 x Dorm Ass. Sports & Rec. 4 x S. S. Spec’s Sports & Rec. College Nurse Health Assistant.")
79
1 x Cook III Administrative Services Food Services - Proposed Director Food Services 1 x Cook II7 x Cook I Ass. Director Food Services

80
Education Specialist Student Services Specialist Student Services Specialist Administrative Services SSSP - Proposed Prog. Director SSSP Tutoring Prog. Sp. Contract x ? Administrative Assistant

81
Peer Educator Peer Educator Clerk / Typist Administrative Services Peer Counseling - Proposed Prog. Director Peer Counseling Peer Educator Peer Educator Kosrae Ext.C.Yap Ext.C. Note : Pohnpei Ext. Center Peer Counseling services centralized at Nat. Campus Peer Educator Chuuk Ext.C.

82
CRE Proposed

83
CRE Coord. Chuuk Ext. C. Vice President CRE CRE Coord. Kosrae Ext. C. CRE Coord. Yap Ext. C. CRE Coord. Pohnpei Ext.C. Clerk / Typist CRE Proposed Administrative Assistant Program Coordinator Res / Ext. Agents

84
Pohnpei Extension Center

85
Program/ServicesProsConsRecommendationComments All Tech/Voc Programs Existing shop facilities are in good condition. Moving to Palikir would require construction of new facilities. Dorm student transportation All T/V programs at PEC will be maintained at upper site Replacement for existing tech classroom is still necessary. Hospitality & Tourism Management Closer to town for student internship Dorm student transportation Maintain at PEC not necessarily at lower site Program might be up for re-design CA in Agriculture Space availability. Sharing resources with the AS program. No food processing facilities at NC. Adjunct Staff availability Relocate to NC CA in Secretarial Science Staff availability. Utilize availability of resources. Relocate to NC under Business Div or complete redesign of program. Very young group. Limited current workforce in the program. Cohort or short term training program.

86
Pohnpei Extension Center Program/ServicesProsConsRecommendationComments Development Ed. (ACE) Achieving College Excellence Immerse more into college level academic environment. Availability of resources. More courses. Relocate to NC. Combine with other programs would require construction of a classroom building at NC. Law Enforcement Revamp the program and determine the location Short Term Training In town closer to the clientele. Organizational structure in place. Keep at PEC Public Health Access to health facilities. Access to clientele. Transportation for the Dorm students Move to PEC Need for regular dependable shuttle service for all programs. Nursing Access to health facilities. Access to clientele. Transportation for the Dorm students Move to PEC Need for regular dependable shuttle service for all programs.
 Achieving College Excellence Immerse more into college level academic environment. Availability of resources. More courses. Relocate to NC. Combine with other programs would require construction of a classroom building at NC. Law Enforcement Revamp the program and determine the location Short Term Training In town closer to the clientele. Organizational structure in place. Keep at PEC Public Health Access to health facilities. Access to clientele. Transportation for the Dorm students Move to PEC Need for regular dependable shuttle service for all programs. Nursing Access to health facilities. Access to clientele. Transportation for the Dorm students Move to PEC Need for regular dependable shuttle service for all programs..")
87
Pohnpei Extension Center Program/ServicesProsConsRecommendationComments Community Health Assistant Program Access to health facilities. Access to clientele. Transportation for the Dorm students Keep at PEC Need for regular dependable shuttle service for all programs. TRIO Programs Access to clientele. Keep at PEC Financial Aid Availability of resources. Administrative functions transferred to NC During peak times during the semester send a personnel as needed. Admissions & Records Availability of resources. Administrative functions transferred to NC During peak times during the semester send a personnel as needed. Counseling/Tutoring/ Advising Retain 2 x counselors to provide counseling/tutoring/ service at PEC Business Office Availability of resources. Administrative functions transferred to NC During peak times during the semester send a personnel as needed.

88
Pohnpei Extension Center Program/ServicesProsConsRecommendationComments Recreation/ActivitiesAvailability of facilities. Retain 1 x personnel to run the sports/recreation programs at PEC Dispensary Availability of resources. Administrative functions transferred to NC During peak times during the semester send a personnel as needed. LibraryNeeded services Keep as extension targeted to the curriculum at PEC Bookstore Availability of recourses. Move Bookstore to NC

89
Cost Reduction / Management - improved fiscal management - improved operational efficiency - optimization of resources - improved budgeting process

90
- greater accountability / managed expectations Performance Management - enhanced work planning - provision of constructive feedback mechanism - link to performance pay - link to training and development

91
Obtaining and analyzing market compensation data Stage 2 Compensation Structuring

92
Market Data - Sources

93
1. Regional Comparisons Guam Community College Palau Community College College of the Marshall Islands American Samoa Community College Northern Marianas College (unable to participate)
.")
94
a) National Faculty Survey 2007 - 2008 (CUPA) b) Community College Faculty Survey 2007 - 2008 (CUPA) c) Mid Level Admin & Professional Survey 2007 - 2008 (CUPA) d) Administrative Compensation Survey 2007 - 2008 (CUPA) 2. U.S. Comparisons (GCC Report) Market Data - Sources
 Market Data - Sources.")
95
Regional Market Percentiles 5 th - 95 th Market Data

96
Regression Analysis 50th 25th 5th 75th 95th

97
Regression Analysis 50th 25th 5th 75th 95th 15th 10th 5th

98
Regression Analysis 50th 25th 5th 75th 95th

99
In developing a revised compensation model : KEY QUESTION Where in the market “should we / can we” position the College to be more externally competitive i.e. in attracting and retaining employees ? Stage 2 Compensation Structuring

100
Regression Analysis 50th 25th 5th 75th 95th

101
Structural Adjustment Cost

102
Current Base Salary Total Increase to 10 th Market Percentile New Base Salary Total Estimated Adjustment Cost (10 th Market Percentile - Region) $ 5,988,513 $ 79,991 $ 6,068,504 Current Total Compensation Increase to 10 th Market Percentile New Total Compensation $ 7,630,563 $ 101,925 $ 7,732,488 (1.3%)
 $ 5,988,513 $ 79,991 $ 6,068,504 Current Total Compensation Increase to 10 th Market Percentile New Total Compensation $ 7,630,563 $ 101,925 $ 7,732,488 (1.3%)")
103
Number of Employees (< 10 th ) Total Full-Time Employees Number of Employees (> 10 th ) 43 (11.8%) 320 (88.2%) 363 (100.0%) Estimated Adjustment (10 th Market Percentile - Region)
 Total Full-Time Employees Number of Employees (> 10 th ) 43 (11.8%) 320 (88.2%) 363 (100.0%) Estimated Adjustment (10 th Market Percentile - Region)")
104
Current Base Salary Total Increase to 20 th Market Percentile New Base Salary Total Estimated Adjustment Cost (20 th Market Percentile - Region) $ 5,988,513 $ 204,272 $ 6,192,785 Current Total Compensation Increase to 20 th Market Percentile New Total Compensation $ 7,630,563 $ 260,283 $ 7,890,847 (3.4%)
 $ 5,988,513 $ 204,272 $ 6,192,785 Current Total Compensation Increase to 20 th Market Percentile New Total Compensation $ 7,630,563 $ 260,283 $ 7,890,847 (3.4%)")
105
Number of Employees (< 20 th ) Total Full-Time Employees Number of Employees (> 20 th ) 103 (28.4%) 260 (71.6%) 363 (100.0%) Estimated Adjustment (20 th Market Percentile - Region)
 Total Full-Time Employees Number of Employees (> 20 th ) 103 (28.4%) 260 (71.6%) 363 (100.0%) Estimated Adjustment (20 th Market Percentile - Region)")
106
Current Base Salary Total Increase to 30 th Market Percentile New Base Salary Total Estimated Adjustment Cost (30 th Market Percentile - Region) $ 5,988,513 $ 464,105 $ 6,452,618 Current Total Compensation Increase to 30 th Market Percentile New Total Compensation $ 7,630,563 $ 591,363 $ 8,221,926 (7.7%)
 $ 5,988,513 $ 464,105 $ 6,452,618 Current Total Compensation Increase to 30 th Market Percentile New Total Compensation $ 7,630,563 $ 591,363 $ 8,221,926 (7.7%)")
107
Number of Employees (< 30 th ) Total Full-Time Employees Number of Employees (> 30 th ) 185 (51.0%) 178 (49.0%) 363 (100.0%) Estimated Adjustment (30 th Market Percentile - Region)
 Total Full-Time Employees Number of Employees (> 30 th ) 185 (51.0%) 178 (49.0%) 363 (100.0%) Estimated Adjustment (30 th Market Percentile - Region)")
108
Current Base Salary Total Increase to 40 th Market Percentile New Base Salary Total Estimated Adjustment Cost (40 th Market Percentile - Region) $ 5,988,513 $ 871,158 $ 6,859,671 Current Total Compensation Increase to 40 th Market Percentile New Total Compensation $ 7,630,563 $ 1,110,030 $ 8,740,593 (14.5%)
 $ 5,988,513 $ 871,158 $ 6,859,671 Current Total Compensation Increase to 40 th Market Percentile New Total Compensation $ 7,630,563 $ 1,110,030 $ 8,740,593 (14.5%)")
109
Number of Employees (< 40 th ) Total Full-Time Employees Number of Employees (> 40 th ) 243 (66.9%) 120 (33.1%) 363 (100.0%) Estimated Adjustment (40 th Market Percentile - Region)
 Total Full-Time Employees Number of Employees (> 40 th ) 243 (66.9%) 120 (33.1%) 363 (100.0%) Estimated Adjustment (40 th Market Percentile - Region)")
110
Current Base Salary Total Increase to 50 th Market Percentile New Base Salary Total Estimated Adjustment Cost (50 th Market Percentile - Region) $ 5,988,513 $ 1,400,322 $ 7,388,835 Current Total Compensation Increase to 50 th Market Percentile New Total Compensation $ 7,630,563 $ 1,784,290 $ 9,414,853 (23.3%)
 $ 5,988,513 $ 1,400,322 $ 7,388,835 Current Total Compensation Increase to 50 th Market Percentile New Total Compensation $ 7,630,563 $ 1,784,290 $ 9,414,853 (23.3%)")
111
Number of Employees (< 50 th ) Total Full-Time Employees Number of Employees (> 50 th ) 303 (83.5%) 60 (16.5%) 363 (100.0%) Estimated Adjustment (50 th Market Percentile - Region)
 Total Full-Time Employees Number of Employees (> 50 th ) 303 (83.5%) 60 (16.5%) 363 (100.0%) Estimated Adjustment (50 th Market Percentile - Region)")
112
Note : the transition to a more competitive market position may take over a number of years e.g. FY11 - 10 th market percentile FY12 - 15 th market percentile FY13 - 20 th market percentile FY14 - 25 th market percentile Option 1

113
Note : the transition to a more competitive market position may take over a number of years e.g. FY11 - 10 th market percentile FY12 - standard increment FY13 - 15 th market percentile FY14 - standard increment Option 2

114
COM-FSM (full-time employees)No% Base Salary Increase Administration Employees < 10th Market Percentile215.830,803 Administration Employees > 10th Market Percentile10629.27,886 Instructional Affairs Employees < 10th Market Percentile133.614,274 Instructional Affairs Employees > 10th Market Percentile11832.512,427 Student Services Employees < 10th Market Percentile61.73,903 Student Services Employees > 10th Market Percentile6317.44,572 CRE Employees < 10th Market Percentile20.6342 CRE Employees > 10th Market Percentile308.32,541 Presidents Office Employees < 10th Market Percentile10.32,977 Presidents Office Employees > 10th Market Percentile30.8266 TOTAL363100.079,991 Target a Specific Group for an Initial Adjustment e.g. Option 3

115
Stage 3 : Implementation

116
New Pay Schedule Options Stage 3 : Implementation

117
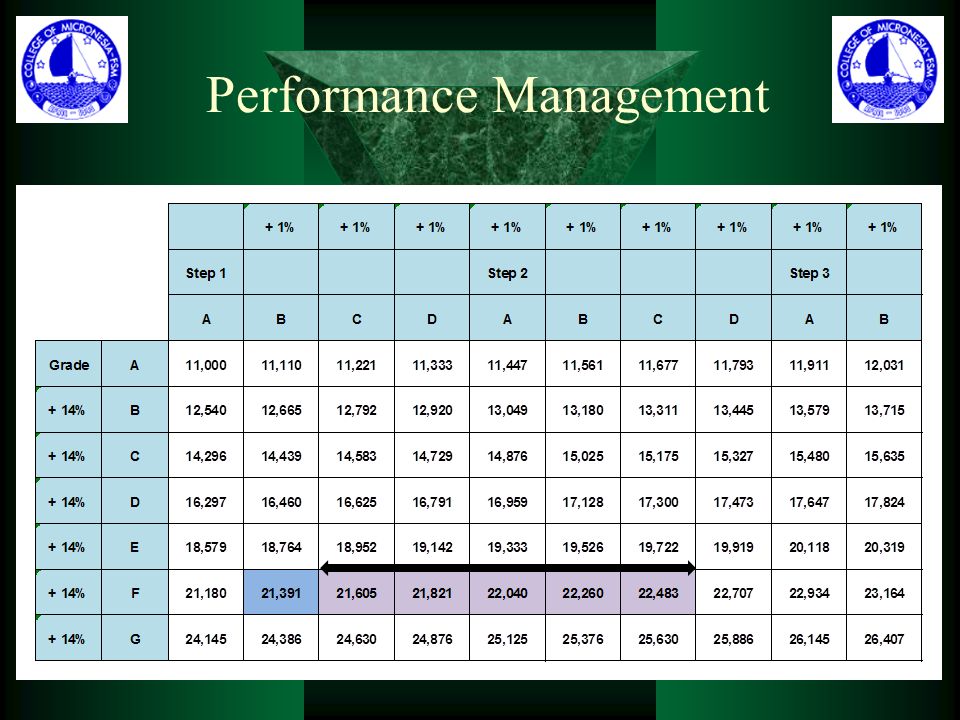
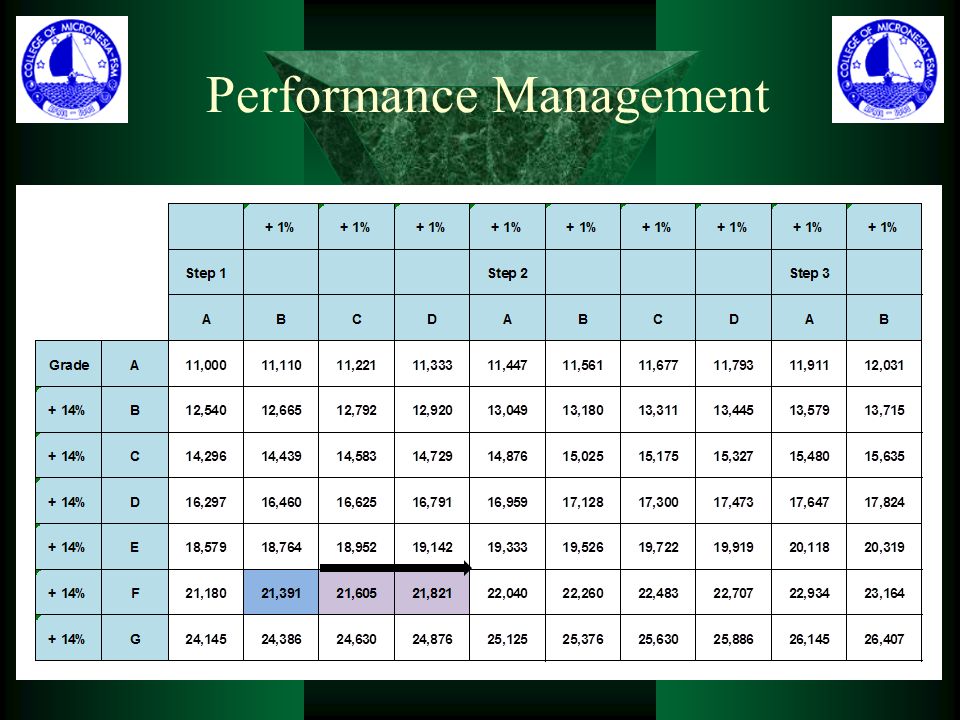
Pay Schedule Option 6.2%5.8%5.5%5.2%4.0%3.8%3.7%3.5% GradeStep 1Step 2Step 3Step 4Step 5Step 6Step 7Step 8 3.8%A$13,990$14,865$15,739$16.614$17,488$18,188$18,887$19,587 4.1%B$14,534$15,443$16,351$17,260$18,168$18,895$19,621$20,348 4.6%C$15,133$16,079$17,024$17,970$18,916$19,673$20,429$21,186 5.1%D$15,840$16,830$17,820$18,810$19,800$20,592$21,384$22,176 5.8%E$16,656$17,697$18,738$19,779$20,820$21,653$22,486$23,318 (Traditional Approach)
")
118
Pay Schedule Option (New Approach)
")
119
Every employee would have a : grade, step and sub-step e.g. Employee X Grade I, Step 6, Sub-step B Pay Schedule Options

120
Transition Process to New Compensation Model Stage 3 : Implementation

121
Competitor’s Approach

122
600 JE Points 500 JE Points Competitor’s Approach

123
600 JE Points (20 Positions) 500 JE Points Competitor’s Approach
 500 JE Points Competitor’s Approach")
124
600 JE Points (20 Positions) e.g. Grade K (Step 1) 500 JE Points Competitor’s Approach
 e.g. Grade K (Step 1) 500 JE Points Competitor’s Approach")
125
600 JE Points (20 Positions) e.g. Grade K (Step 1) 500 JE Points 505 JE Points 595 JE Points Competitor’s Approach
 500 JE Points 505 JE Points 595 JE Points Competitor’s Approach.")
126
600 JE Points (20 Positions) e.g. Grade K (Step 1) 500 JE Points 505 JE Points 595 JE Points 605 JE Points e.g. Grade L (Step 1) Competitor’s Approach 700 JE Points
 500 JE Points 505 JE Points 595 JE Points 605 JE Points e.g. Grade L (Step 1) Competitor’s Approach 700 JE Points.")
127
Our Approach

128
600 JE Points (20 Positions) 500 JE Points Our Approach
 500 JE Points Our Approach")
129
600 JE Points (20 Positions) 500 JE Points 505 JE Points 595 JE Points Our Approach
 500 JE Points 505 JE Points 595 JE Points Our Approach")
130
600 JE Points (20 Positions) 500 JE Points 505 JE Points 595 JE Pointse.g. Grade K (Step 5) e.g. Grade K (Step 2) Our Approach
 e.g. Grade K (Step 2) Our Approach.")
131
Let’s look at the mechanics of this process (Two Step Process) Our Approach
 Our Approach")
132
Step 1 - Identification of an implementation range Step 2 - Migrate all employees into the new model Our Approach

133
Regression Analysis 50th 25th 5th 75th 95th

134
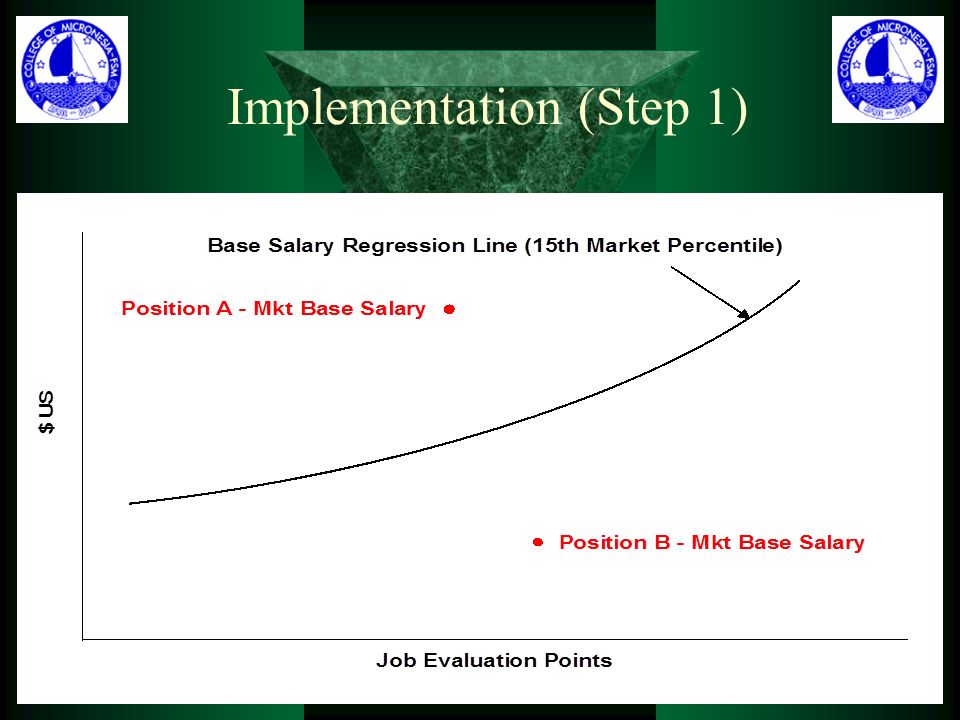
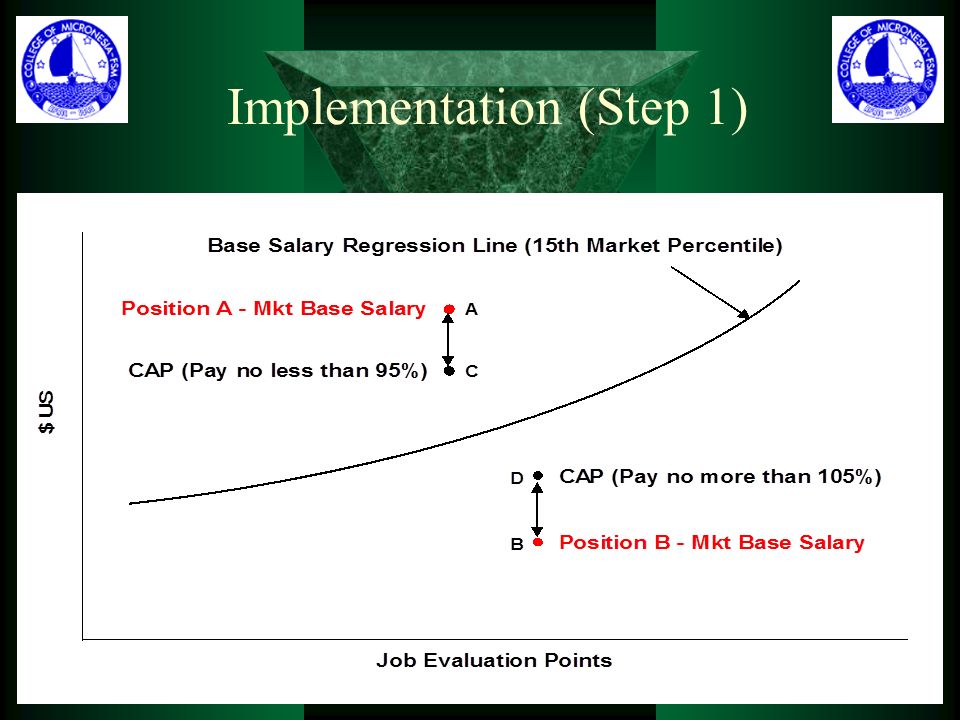
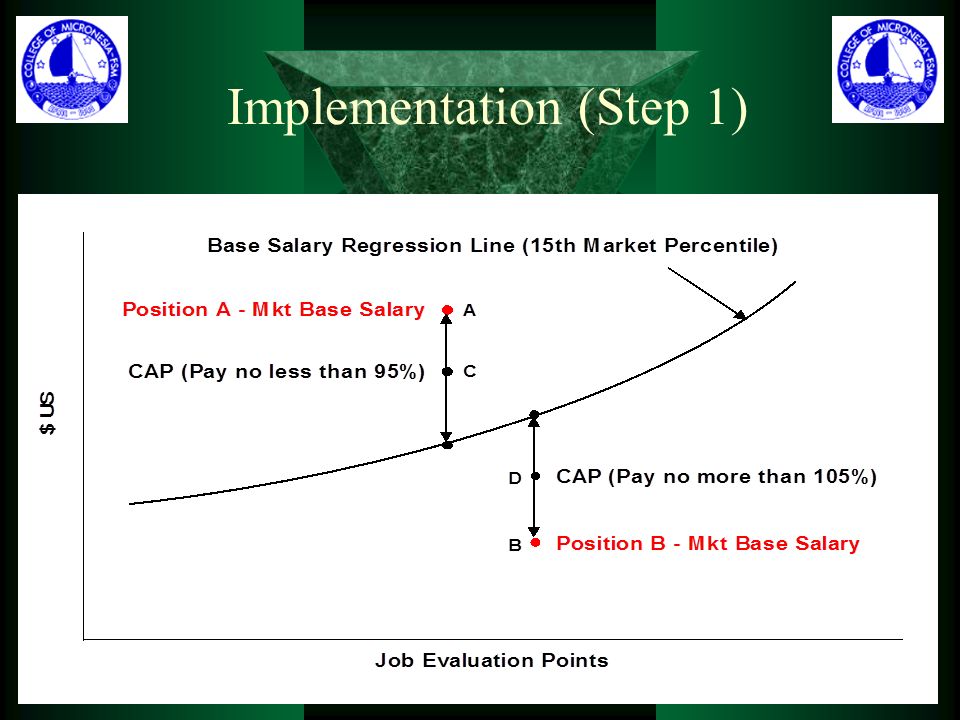
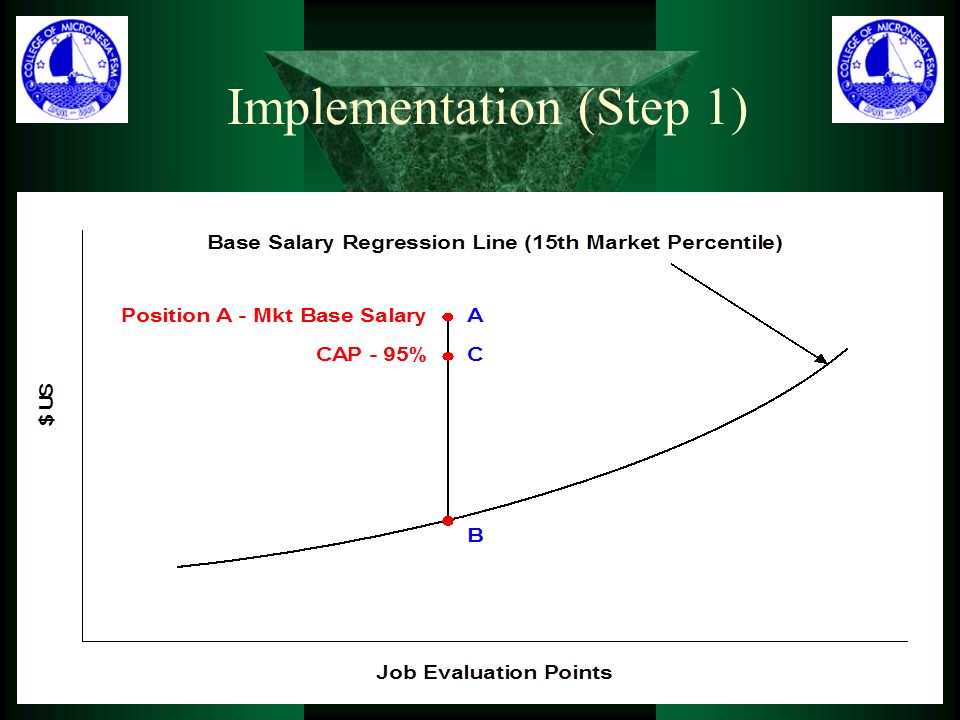
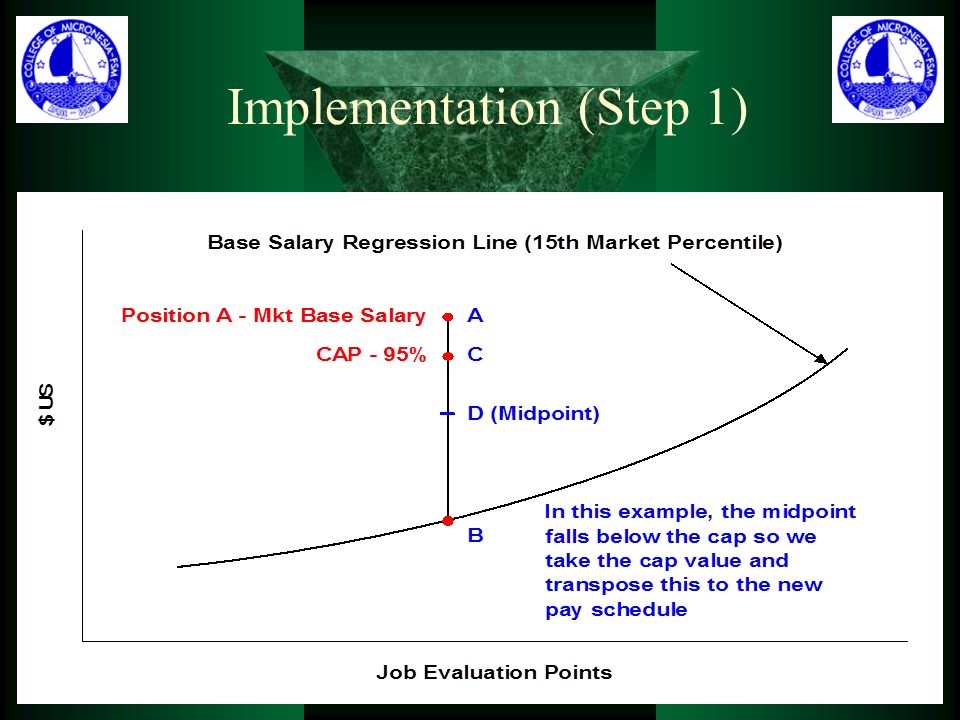
Implementation (Step 1)
")
141
We next identify a base salary value (for each position) that we can then transpose to the new pay schedule in order to identify the upper end of an implementation range We do this by initially identifying the midpoint Implementation (Step 1)
 that we can then transpose to the new pay schedule in order to identify the upper end of an implementation range We do this by initially identifying the midpoint Implementation (Step 1)")
146
Conversion Process Example

147
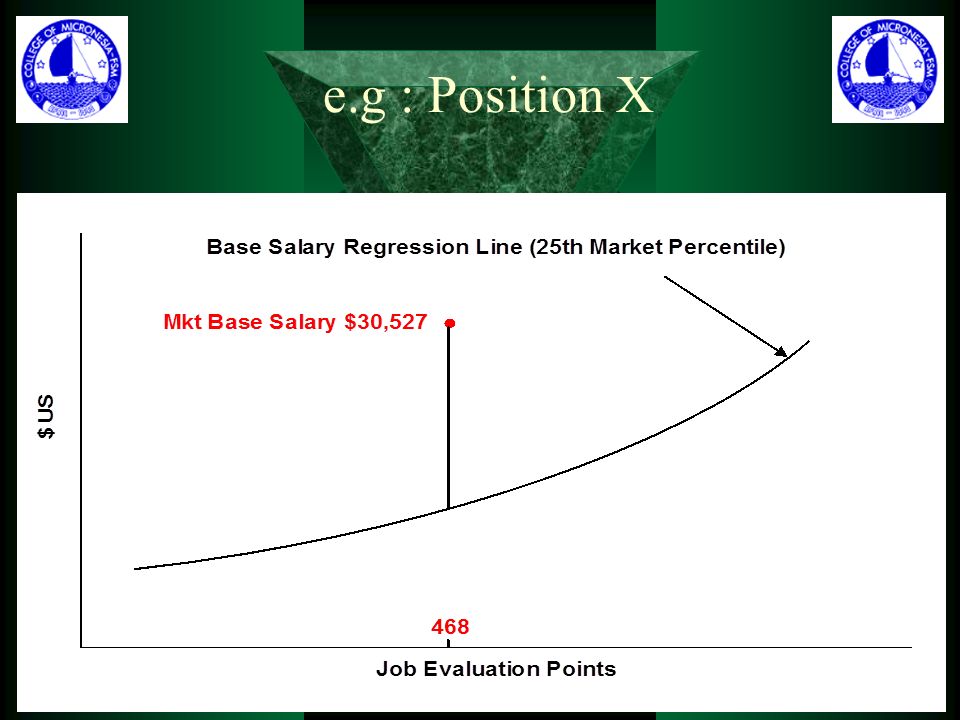
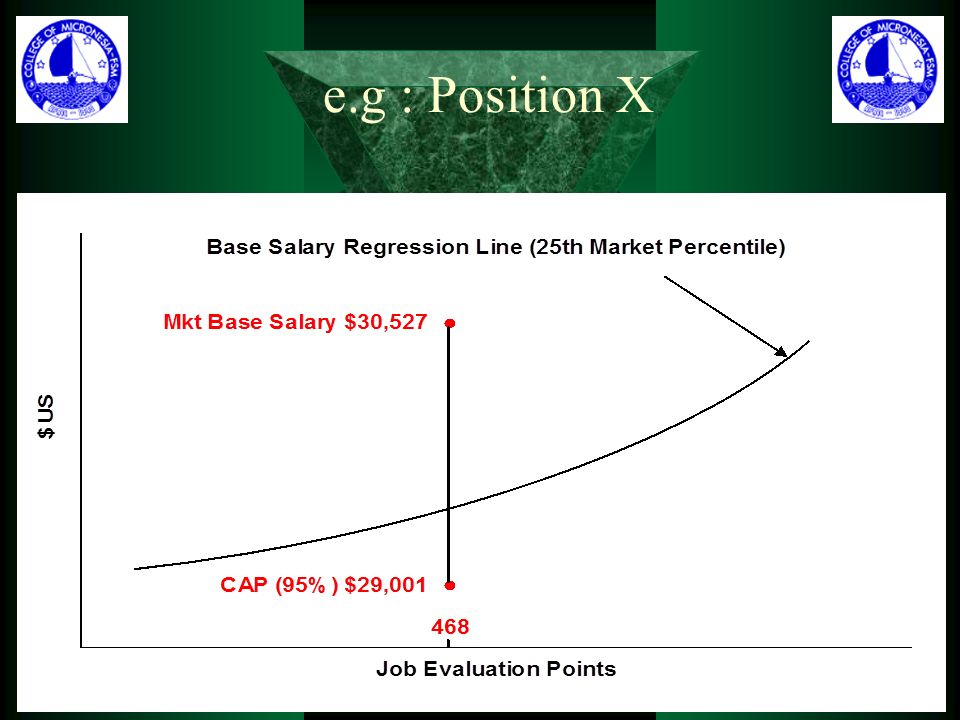
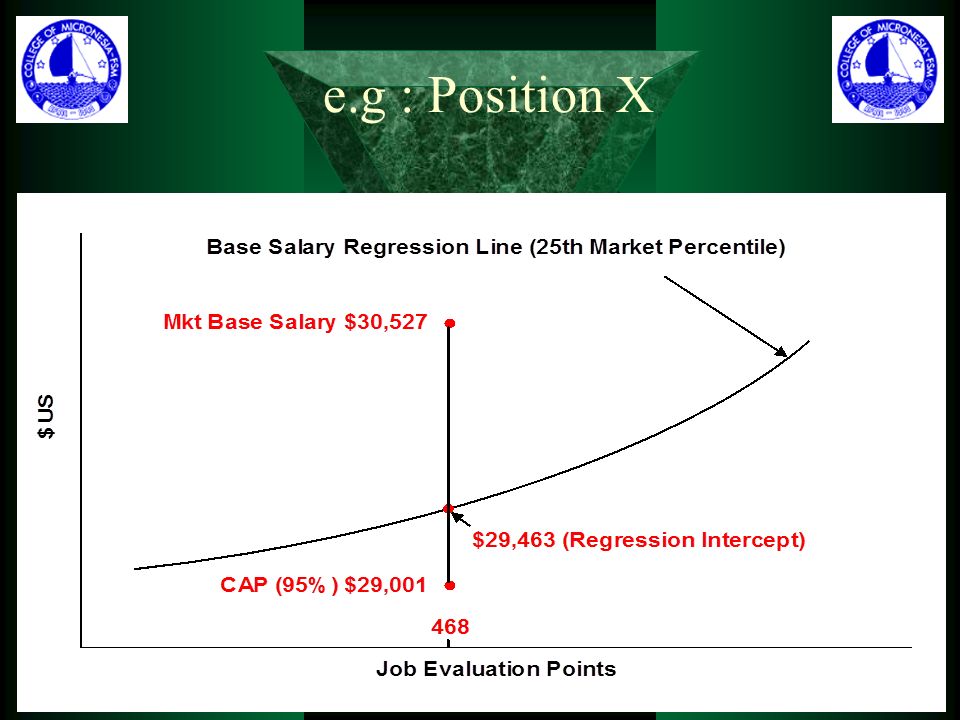
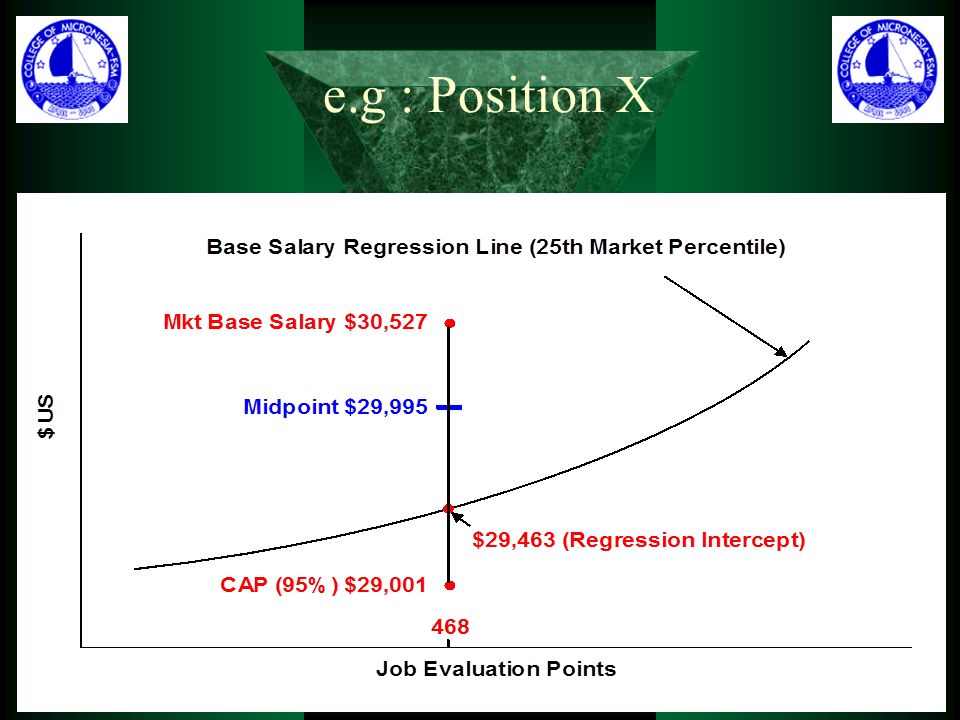
e.g : Position X

152
We transpose $29,995 to the new Pay Schedule e.g : Position X

153
Using the new Pay Schedule identify the closest base salary sub-step (on the lower side) e.g : Position X
 e.g : Position X")
154
Note : this forms the high end of the implementation range (25 th Market Percentile) e.g : Position X
 e.g : Position X")
155
The low end of the implementation range is 16 sub-steps from the high end e.g : Position X

156
$29,756 (Grade G, Step 6, Sub-Step B) - Range Max $25,630 (Grade G, Step 2, Sub-Step C) - Range Min Implementation Range
 - Range Max $25,630 (Grade G, Step 2, Sub-Step C) - Range Min Implementation Range")
157
Now that we have an implementation range for each unique position the final step is to migrate all employees into the new compensation model Implementation

158
1. Performance8 Points50% 2. Education5 Points31% 3. Experience3 Points19% TOTAL16 Points100% Implementation Criteria

159
1. Performance8 Points50% 2. Education5 Points31% 3. Experience3 Points19% TOTAL16 Points100% This corresponds to the implementation range Implementation Criteria

160
1. Performance9 Points8 Points 2. Education4 Points 3. Experience3 Points TOTAL16 Points15 Points Employee e.g : Position X

161
Finally, in comparing this to the employee’s current salary there are two scenarios : Score of 15 = $29,461

162
e.g : Position X Score of 15 = $29,461 1.Where the employee’s current base salary is below this amount

163
e.g : Position X Score of 15 = $29,461 Emp X : Current Base Salary = $26,000

164
e.g : Position X Score of 15 = $29,461 Emp X : Current Base Salary = $26,000 Emp X : New Base Salary = $29,461 (13% inc) Grade G, 6, A
 Grade G, 6, A")
165
2.Where the employee’s current base salary is above this amount Score of 15 = $29,461 e.g : Position X

166
Emp X : Current Base Salary = $31,500 Score of 15 = $29,461

167
e.g : Position X Emp X : Current Base Salary = $31,500 Score of 15 = $29,461 Emp X : New Base Salary = $31,586 (0.3% inc) Grade G, 7, D
 Grade G, 7, D")
168
Stage 2 : External Analysis Stage 1 : Internal Analysis Supp. Projects : Performance Management / (optional) Development of Pay Incentives Stage 3 : Implementation Typical Project Overview
 Development of Pay Incentives Stage 3 : Implementation Typical Project Overview.")
169
Stage 2 : External Analysis Stage 1 : Internal Analysis Supp. Projects : Performance Management / (optional) Development of Pay Incentives Stage 3 : Implementation Typical Project Overview
 Development of Pay Incentives Stage 3 : Implementation Typical Project Overview.")
170
Integrated Performance Management System

171
Review Performance PayTraining Work Planning Integrated Performance Management System

172
10 + Steps 7 - 9 Steps 1 - 6 Steps Performance Management e.g. Guam Community College e.g. GCC under previous compensation model - 24 months - 18 months - 12 months

173
10 + Steps 7 - 9 Steps 1 - 6 Steps Old Compensation Model - 24 months - 18 months - 12 months New Model Everyone will be reviewed annually Performance Management e.g. Guam Community College

174
Three new performance management tools are being implemented : a) Academic Administrators b) Faculty c) Staff (classified positions) Performance Management e.g. Guam Community College

175
One of the benefits of the new pay schedule is that a performance range is made available i.e. as a performance incentive on an annual basis Performance Management e.g. Guam Community College

176
Performance Management

180
Thank You / Questions

Similar presentations