Download presentation
Presentation is loading. Please wait.

1
How can I use models/data/infographics to explain that climate change is real and affected by human activity? Fitting the pieces together

2
Outline What changes climate? Is it real? How do we know? Why should we care? How sure are scientists? What next—what can we do?

3
What changes climate? Changes in: – Sun’s output – Earth’s orbit – Drifting continents – Volcanic eruptions – Greenhouse gases

4
“Greenhouse effect” Increasing greenhouse gases trap more heat

5
Greenhouse gases Nitrous oxide Water Carbon dioxide Methane Sulfur hexafluoride

7
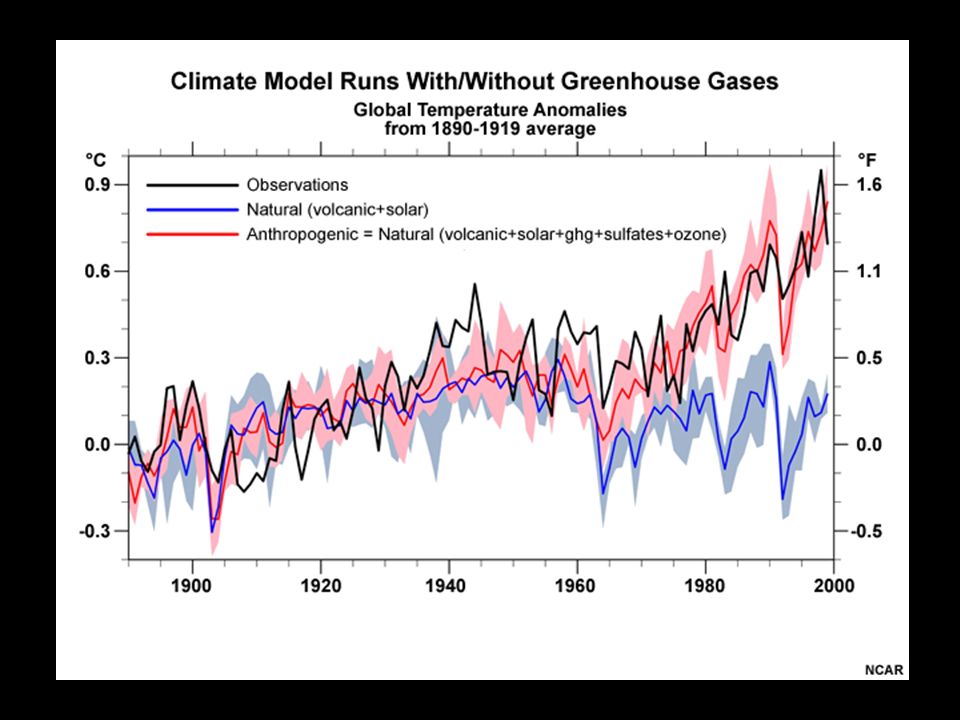
Could the warming be natural?

8
TASK: Research to find the “puzzle pieces” we need to complete our project. TOPIC--Search for Signs and Symptoms of climate change. What EVIDENCE-data/observations -are scientists collecting? timertimer WRITE YOUR LAPTOP # ON YOUR PAPER List TOP 3 TOPICS for Infographic Project! Is it real? What are the signs, symptoms, evidence?

9
EXAMPLE Topic: Effects on Precipitation Evidence: US map- Corn Areas experiencing drought http://arstechnica.com/science/2013/11/impacts-of-climate- change-observed-in-global-precipitation-patterns/ graphic US & World precipitation anomalies data/graph http://www.epa.gov/climatechange/science/indicators/weath er-climate/precipitation.html

10
Is it real?

11
Effects: Snow and ice Grinnell Glacier, Glacier National Park 1900 and 2008

12
Effects on precipitation

13
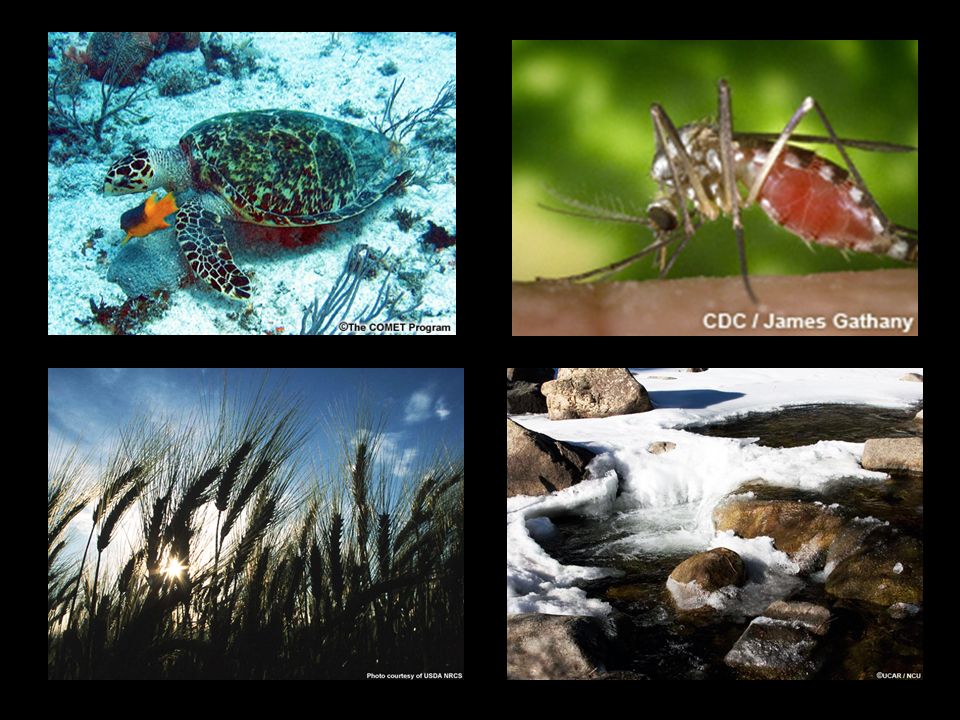
Effects on ecosystems

14
How do we know?

15
Present day observations

16
Computer models

17
Aspen, CO Forecast: Partly cloudy today High : 28°F Low: 13°F Increasing clouds over night. Colder tomorrow.

19
Why should we care?

20
2003 European Heat Wave Germany: Lowest river levels this century Switzerland: Melting glaciers, avalanches France: >14,000 deaths Portugal: Forest fires U.K.: Train rails buckle

21
Sea-level rise projections : a few inches to a few feet 2 ft: U.S. would lose 10,000 square miles 3 ft: Would inundate Miami Affects erosion, loss of wetlands, freshwater supplies Half of the world’s population lives along coasts Big question: Ice sheets

23
How sure are scientists? What don’t we know? Is there some critical piece of the about climate process we don’t understand? How and when will our fossil fuel use change? Will future, yet-to-be-discovered technologies mitigate the problem? How will changing economics, global population, and political processes affect our ability to tackle the problem?

24
The IPCC

25
2007 Conclusions Warming of the climate system is unequivocal Very high confidence that global average net effect of human activities since 1750 one of warming Human-caused warming over last 30 years has likely had a visible influence on many physical and biological systems Continued GHG emissions at or above current rates would cause further warming and induce many changes in the global climate system during the 21 st century that would very likely be larger than those observed during the 20 th century.”

26
Consensus? Do we know enough about the drivers of climate to know what causes change? Are we underestimating the Earth system’s complexity ? Can models accurately simulate the complex climate system? Are there processes that will limit warming naturally?

27
On the other hand… Arctic sea ice melting faster than predicted. Fossil fuel emissions exceeded most IPCC projections. Are assumptions about global energy use are too optimistic? How quickly can developing countries reduce GHG emissions? Calculations don’t include unexpected melting in Greenland and Antarctica.

28
What do climate scientists really think?

29
Be an educated consumer IPCC AR4 Synthesis Report (http://www.ipcc.ch/ipccreports/ar4-syr.htm)http://www.ipcc.ch/ipccreports/ar4-syr.htm Other organizations: – NAS (http://dels.nas.edu/climatechange/)http://dels.nas.edu/climatechange/ – US CCSP (http://www.climatescience.gov/)http://www.climatescience.gov/ Look for contrasting opinions Evaluate the source

30
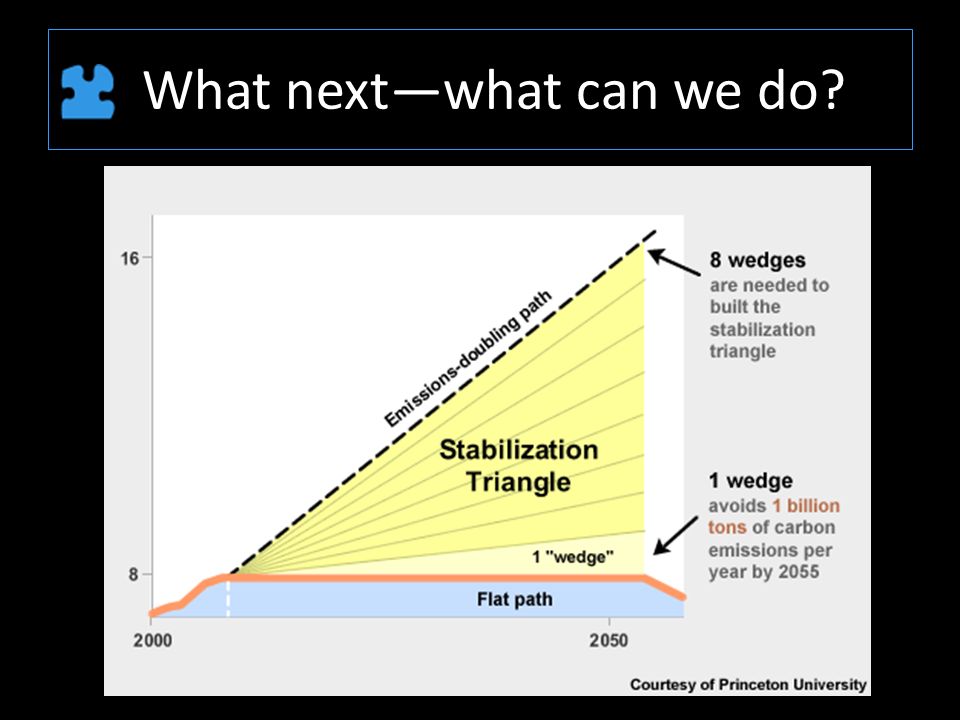
What next—what can we do?

32
Produce more fuel-efficient vehicles Reduce vehicle use Improve energy-efficiency in buildings Develop carbon capture and storage processes Triple nuclear power Increase solar power Decrease deforestation/plant forests Improve soil carbon management strategies

33
Individual actions Use mass transit, bike, walk, roller skate Tune up your furnace Unplug appliances or plug into a power strip and switch it off Buy water-saving appliances and toilets; installing low-flow shower heads. Caulk, weatherstrip, insulate, and replace old windows Buy products with a U.S. EPA Energy Star label

Similar presentations


>")
