Download presentation
Presentation is loading. Please wait.

1
Atmosphere Layers separated by temperature variations.
Troposphere: km -- where we live -- gets colder as you go up. -- all weather occurs here. -- all water vapor occurs here.

2
Atmosphere Stratosphere: 12-50 km -- ozone layer
-- ozone absorbs short-wave (dangerous) radiation. -- temperature gets warmer as you go up.
 radiation. -- temperature gets warmer as you go up.")
3
Annual Maximum Ozone Hole

4
Atmosphere Mesosphere: 50-80 km -- gets cold again as you go up.
-- air is very thin. Thermosphere: km -- gets warmer as you go up. -- last layer

7
Greenhouse Effect Atmosphere holds in heat radiated from Earth. - keeps Earth warm for us. Greenhouse Gas = chemical compound that allows short-wave radiation in, but, absorbs outgoing long-wave radiation (infrared/heat).
.")
8
Greenhouse Gases Water vapor - most abundant (largest amount).
Carbon dioxide (CO2) - natural (plants) and man-made (oil and gas). Methane (best absorber), CFCs (aerosol sprays…stay 100 years in atmosphere).
 - natural (plants) and man-made (oil and gas). Methane (best absorber), CFCs (aerosol sprays…stay 100 years in atmosphere).")
9
Increasing greenhouse gases trap more heat
“Greenhouse effect” Increasing greenhouse gases trap more heat [Image 1] Earth’s surface absorbs heat from the sun and then re-radiates it back into the atmosphere and to space. [click, Image 2] Much of this heat is absorbed by greenhouse gases, which then send the heat back to the surface, to other greenhouse gas molecules, or out to space. Though only 1% of atmospheric gases are greenhouse gases, they are extremely powerful heat trappers. By burning fossil fuels faster and faster, humans are effectively piling on more blankets, heating the planet so much and so quickly that it’s hard for Mother Nature and human societies to adapt. 9

10
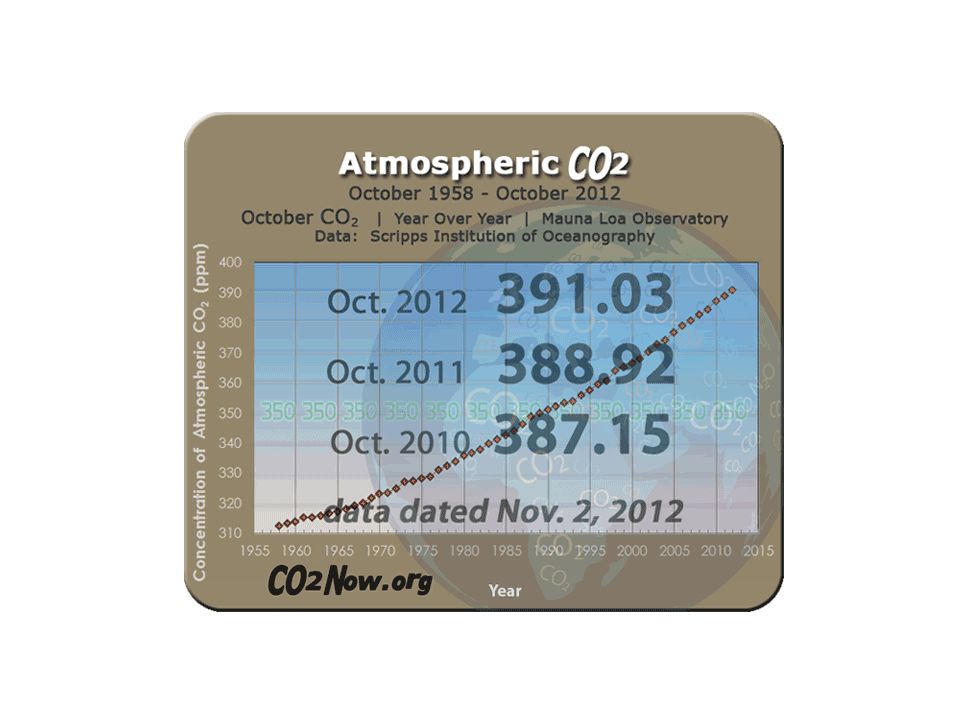
Carbon Dioxide Carbon Dioxide (CO2) levels historically precede and/or follow temperature rises. How do we know? Ice cores from Antarctica… 450,000 year record.

11
Natural CO2 Range

12
Devastating Evidence

15
Computer models [Image 1] The main tool for both past and present climate analyses are computer climate models. Much like the models used to forecast weather, climate models simulate the climate system with a 3-dimensional grid that extends through the land, ocean, and atmosphere. The grid may have 10 to 60 different levels in the atmosphere and surface grid spacings of about 60 by 90 miles (100 by 150 km)—the size of Connecticut. The models perform trillions of calculations that describe changes in many climate factors in the grid. [click, Image 2] The models project possible climates based on scenarios that cover a range of assumptions about global population, greenhouse gas emissions, technologies, fuel sources, etc. The model results provide a range of possible impacts based on these assumptions. 15
—the size of Connecticut. The models perform trillions of calculations that describe changes in many climate factors in the grid. [click, Image 2] The models project possible climates based on scenarios that cover a range of assumptions about global population, greenhouse gas emissions, technologies, fuel sources, etc. The model results provide a range of possible impacts based on these assumptions. 15.")
16
Increasing clouds over night. Colder tomorrow.
Aspen, CO Forecast: Partly cloudy today High : 28°F Low: 13°F Increasing clouds over night. Colder tomorrow. [Image 1] A common critique of climate predictions is, “If weather model forecasts aren’t reliable more than a week out, how can models predict climate decades in the future?” While weather and climate models are based on similar physics, they are not predicting the same thing. Weather forecasts look at the day-to-day changes on a local level, and subtle chaotic atmospheric variations make short-term weather forecasts difficult beyond 8-10 days. [click, Image 2] Climate predictions are focused on longer-term influences of the sun, oceans, land, and ice on the atmosphere. Instead of predicting a temperature at a particular place at a particular hour, climate modules project an average temperature over a year or longer in a large region or over the entire globe. 16

17
Why Should We Care? Global average temperatures are expected to increase by about 2-13°F (1-7°C) by the end of the century. That may not sound like a lot, so what’s the big deal? The problem is that small changes in global average temperature can lead to really large changes in the environment. Let’s look at some of the expected changes. 17
 by the end of the century. That may not sound like a lot, so what’s the big deal The problem is that small changes in global average temperature can lead to really large changes in the environment. Let’s look at some of the expected changes. 17.")
18
Climate Climate = characteristic weather of a region. Ex. 100 year pattern. Major Elements: Temperature Precipitation (Moisture)
")
19
Problems Climate change = warmer, drier, wetter, more extreme weather.
3 to 7 feet rise in sea levels by end of century. Arctic temperature rising faster than others. Glacier melting = too much fresh water.

21
What Do Climate Scientists Think?
[Image 1] A survey conducted in 2007 by George Mason University of U.S. scientists who have expertise in climate science (not just a scientific background) what they think. 97% of the 489 respondents agreed that “global average temperatures have increased” during the past century. That’s up from 60% in 1991. [click, Image 2] 84% believe human activities are causing the warming, and only 5% disagree. So the survey does indicate the bulk of climate scientists—those most knowledgeable about the field—now agree that human activity contributes to global warming. 21
 what they think. 97% of the 489 respondents agreed that global average temperatures have increased during the past century. That’s up from 60% in [click, Image 2] 84% believe human activities are causing the warming, and only 5% disagree. So the survey does indicate the bulk of climate scientists—those most knowledgeable about the field—now agree that human activity contributes to global warming. 21.")
Similar presentations