Download presentation
Presentation is loading. Please wait.

1
AN- NAJAH NATIONAL UNIVERSITY OPTIMUM DESIGN AND PERFORMANCE FOR NABLUS NETWORK Submitted To : Dr. Maher Khammash Prepared By : Haitham Sharaf Ahmad Odeh

2
ABSTRACT Project One was to gather initial data for "Mojair Addin" network and subject it to a load flow study under its normal condition (6.6 kV).
.")
3
ONE LINE DIAGRAM OF NABLUS NETWORK

4
THE FOLLOWING RESULTS WERE OBTAINED: NORMAL CONDITION ( 6.6 KV) : Bus Initial Voltage (KV) Operating Voltage (KV) V% Bus1006.6005.989.4 Bus1026.6005.85388.7 Bus1046.6005.85988.8 Bus1786.6005.80587.9 Bus1796.6005.80788 Bus1856.6005.66785.9 Bus2236.6006.0491.5 Bus2256.6006.00991.1 Bus2306.6006.0892.1 Bus550.4000.36190.3 Bus80.4000.36491 Bus1320.4000.37192.7 Bus1480.4000.34385.7 Bus330.4000.37794.2 Bus790.4000.33984.7 T he following table shows the under voltages on some buses
 : Bus Initial Voltage (KV) Operating Voltage (KV) V% Bus Bus Bus Bus Bus Bus Bus Bus Bus Bus Bus Bus Bus Bus Bus T he following table shows the under voltages on some buses")
5
SOME OF UNDER VOLTAGE BUSES :

6
SUMMARY OF TOTAL GENERATION, LOADING & DEMAND : * Under voltage buses and low power factor are observed

7
PROJECT GOAL For project II, the voltage level is increased from 6.6kV to 11kV and is analyzed under 3 conditions: 1. Max. case. 2. Min. case. 3. Post-fault case.

8
CHANGING THE VOLTAGE LEVEL ( 6.6 -11) KV : after raising the voltage to 11kV, the voltage drop was notably decreased and a slight improvement to the power factor was observed.
 KV : after raising the voltage to 11kV, the voltage drop was notably decreased and a slight improvement to the power factor was observed.")
9
THE FOLLOWING TABLE SHOWS THE UNDER VOLTAGES ON SOME BUSES: Bus Initial Voltage (KV) Operating Voltage (KV) V% Bus10011.0010.24593.1 Bus10211.0010.21792.9 Bus10411.0010.22192.9 Bus17811.0010.1992.6 Bus17911.0010.19192.6 Bus18511.0010.11692 Bus22311.0010.32593.9 Bus22411.0010.32593.9 Bus22511.0010.30893.7 Bus23011.0010.3594.1 Bus80.4000.37593.7 Bus1320.4000.37794.3 Bus1480.4000.36891.9 Bus330.4000.37994.8 Bus790.4000.36691.5
 Operating Voltage (KV) V% Bus Bus Bus Bus Bus Bus Bus Bus Bus Bus Bus Bus Bus Bus Bus")
10
SUMMARY OF TOTAL GENERATION, LOADING & DEMAND :

11
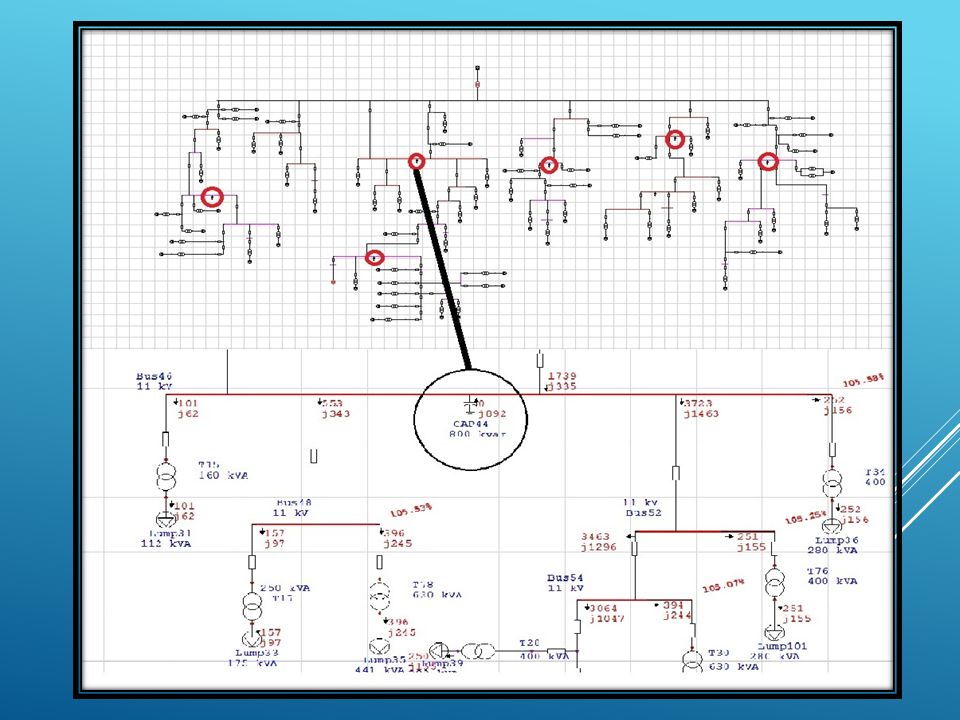
MAXIMUM CASE : The tap changer of the main transformer was increased by 10% and six capacitors were added on the lowest voltage buses of (600, 4x800, 400 kVAr) in order to improve the voltages and the power factor.
 in order to improve the voltages and the power factor.")
13
THE FOLLOWING TABLE SHOWS THE OVER VOLTAGES ON SOME BUSES: Bus Initial Voltage (KV) Operating Voltage (KV) V% Bus10011.0011.531104.8 Bus10211.0011.505104.6 Bus10411.0011.508104.6 Bus17811.0011.478104.3 Bus17911.0011.480104.4 Bus18511.0011.419103.8 Bus22311.0011.579105.3 Bus22411.0011.579105.3 Bus22511.0011.565105.1 Bus23011.0011.613105.6 Bus80.4000.421105.1 Bus1320.4000.423105.7 Bus1480.4000.415103.7 Bus330.4000.424106 Bus790.4000.414103.5
 Operating Voltage (KV) V% Bus Bus Bus Bus Bus Bus Bus Bus Bus Bus Bus Bus Bus Bus Bus")
14
SUMMARY OF TOTAL GENERATION, LOADING & DEMAND :

15
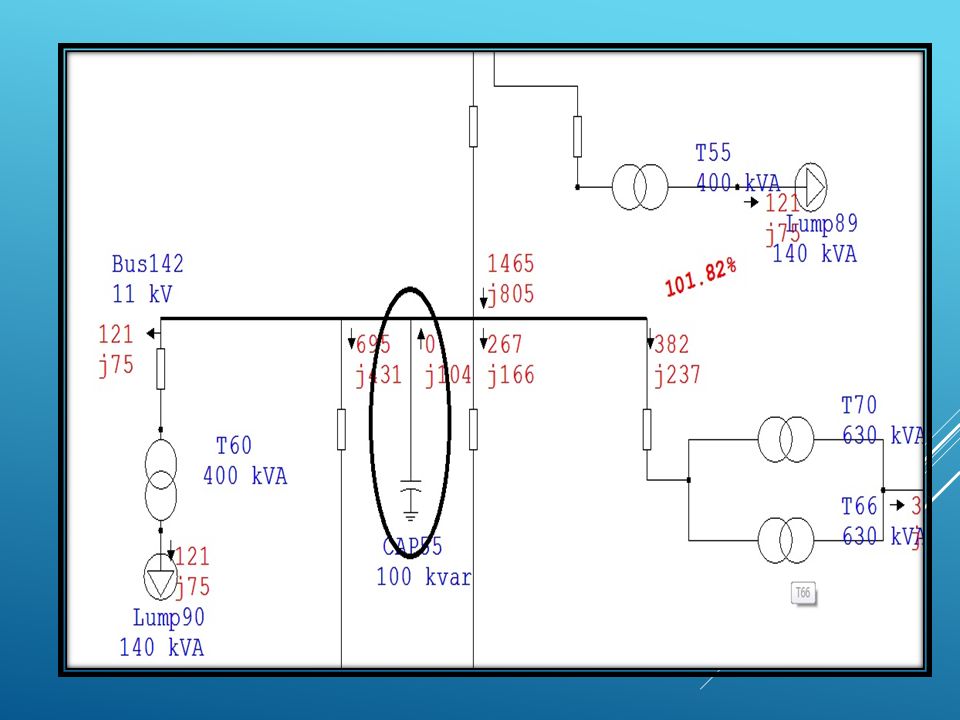
MINIMUM CASE : First, the tap changer was increased by 5% and the loads were halved (decreased by 50%). then, 5 capacitors were added of (200, 800, 2x400, 100 kVAr).
..")
17
THE FOLLOWING TABLE SHOWS THE OVER VOLTAGES ON SOME BUSES: Bus Initial Voltage (KV) Operating Voltage (KV) V% Bus10011.0011.254102.3 Bus10211.0011.241102.2 Bus10411.0011.243102.2 Bus17811.0011.228102.1 Bus17911.0011.229102.1 Bus18511.0011.2101.8 Bus22311.0011.3102.7 Bus22411.0011.299102.7 Bus22511.0011.292102.7 Bus23011.0011.322102.9 Bus80.4000.411102.7 Bus1320.4000.412103 Bus1480.4000.407101.7 Bus330.4000.412103.1 Bus790.4000.407101.8
 Operating Voltage (KV) V% Bus Bus Bus Bus Bus Bus Bus Bus Bus Bus Bus Bus Bus Bus Bus")
18
SUMMARY OF TOTAL GENERATION, LOADING & DEMAND :

19
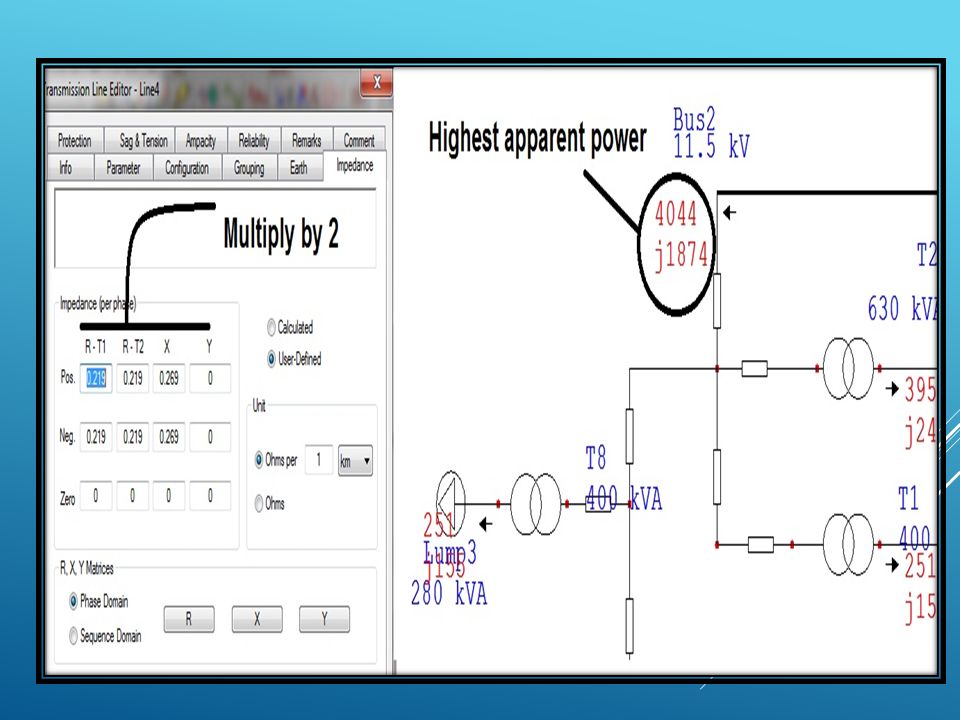
POST-FAULT CASE: In this case, the maximum case was used and the branch with the highest apparent power will have its impedance (R & X) multiplied by 2.
 multiplied by 2.")
21
THE FOLLOWING TABLE SHOWS THE OVER VOLTAGES ON SOME BUSES: Bus Initial Voltage (KV) Operating Voltage (KV) V% Bus10011.0011.53104.8 Bus10211.0011.504104.6 Bus10411.0011.507104.6 Bus17811.0011.477104.3 Bus17911.0011.479104.4 Bus18511.0011.418103.8 Bus22311.0011.471104.3 Bus22411.0011.470104.3 Bus22511.0011.457104.2 Bus23011.0011.612105.6 Bus80.4000.417104.1 Bus1320.4000.423105.8 Bus1480.4000.415103.7 Bus330.4000.424106 Bus790.4000.414103.5
 Operating Voltage (KV) V% Bus Bus Bus Bus Bus Bus Bus Bus Bus Bus Bus Bus Bus Bus Bus")
22
SUMMARY OF TOTAL GENERATION, LOADING & DEMAND :

23
COMPARING BETWEEN THE CASES: Normal case ( 6.6 KV) Changing swing bus (6.6-11) KV Maximum Case Bus Initial Voltage (KV) Operating Voltage (KV) V%Bus Initial Voltage (KV) Operating Voltage (KV)V%Bus Initial Voltage (KV) Operating Voltage (KV) V% Medium voltage Bus1006.6005.989.4Bus10011.0010.24593.1Bus10011.00 11.531104.8 Bus1786.6005.80587.9Bus17811.0010.1992.6Bus17811.00 11.478104.3 Bus1796.6005.80788Bus17911.0010.19192.6Bus17911.00 11.480104.4 Bus1856.6005.66785.9Bus18511.0010.11692Bus18511.00 11.419103.8 Bus2236.6006.0491.5Bus22311.0010.32593.9Bus22311.00 11.579105.3 Bus2246.6006.03891.5Bus22411.0010.32593.9Bus22411.00 11.579105.3 Low Voltage (0.4 KV) Bus1080.4000.35288Bus1080.4000.37192.6Bus1080.400 0.417104.3 Bus1100.4000.35288Bus1100.4000.37192.6Bus1100.400 0.417104.4 Bus1540.4000.34085.1Bus1540.4000.36791.7Bus1540.400 0.414103.5 Bus1560.4000.34084.9Bus1560.4000.36797.6Bus1560.400 0.414103.5 Bus270.4000.35488.5Bus270.4000.37192.8Bus270.400 0.417104.3 Bus600.4000.35588.8Bus600.4000.37293Bus600.400 0.419104.7
 Changing swing bus (6.6-11) KV Maximum Case Bus Initial Voltage (KV) Operating Voltage (KV) V%Bus Initial Voltage (KV) Operating Voltage (KV)V%Bus Initial Voltage (KV) Operating Voltage (KV) V% Medium voltage Bus Bus Bus Bus Bus Bus Bus Bus Bus Bus Bus Bus Bus Bus Bus Bus Bus Bus Low Voltage (0.4 KV) Bus Bus Bus Bus Bus Bus Bus Bus Bus Bus Bus Bus Bus Bus Bus Bus Bus Bus")
24
Minimum CasePost- fault Case Bus Initial Voltage (KV) Operating Voltage (KV) V%Bus Initial Voltage (KV) Operating Voltage (KV) V% Medium voltage Bus10011.0011.254102.3Bus10011.0011.53104.8 Bus17811.0011.228102.1Bus17811.0011.477104.3 Bus17911.0011.229102.1Bus17911.0011.479104.4 Bus18511.0011.2101.8Bus18511.0011.418103.8 Bus22311.0011.3102.7Bus22311.0011.471104.3 Bus22411.0011.299102.7Bus22411.0011.470104.3 Low Voltage (0.4 KV) Bus1080.4000.408102.1Bus1080.4000.417104.3 Bus1100.4000.408102.1Bus1100.4000.417104.3 Bus1540.4000.407101.6Bus1540.4000.414103.5 Bus1560.4000.407101.7Bus1560.4000.414103.5 Bus270.4000.409102.2Bus270.4000.413103.4 Bus600.4000.410102.4Bus600.4000.419104.7
 Operating Voltage (KV) V%Bus Initial Voltage (KV) Operating Voltage (KV) V% Medium voltage Bus Bus Bus Bus Bus Bus Bus Bus Bus Bus Bus Bus Low Voltage (0.4 KV) Bus Bus Bus Bus Bus Bus Bus Bus Bus Bus Bus Bus")
25
The following table shows the apparent losses for these five cases:: Post –fault case Minimum Case Maximum Case Changing swing bus (6.6-11)kV Normal Case (6.6)kV --------------- 0.3620.0850.3340.4171.020 Real Losses ( MW) 2.1160.4942.0812.3553.196 Reactive Losses ( MAvr)
kV Normal Case (6.6)kV Real Losses ( MW) Reactive Losses ( MAvr)")
26
Comparison between the cases considering the power factor: Post –fault case Minimum Case Maximum Case Changing swing bus (6.6-11)kV Normal Case (6.6)kV --------------- 90.70 Lag90.84 Lag90.75 Lag80.76 Lag 79.97 Lag Power Factor Swing Bus
kV Normal Case (6.6)kV Lag90.84 Lag90.75 Lag80.76 Lag Lag Power Factor Swing Bus")
27
Economical Study *Saving in penalties of PF= 79023.69 NIS/year *Saving in losses= 305373.6 NIS/year *Total cost of capacitor banks = (4200 * 15 ) = 63000 NIS *Simple Payback Period= 0.18 year= 2.16 month
 = NIS *Simple Payback Period= 0.18 year= 2.16 month")
28
Industrial Region of Bait- Foureek: The industrial region suggested in bait- Foureek which will be connected to the connection point of Howara at a high voltage of 33 kV, which has an estimated load of 10 MW depending on the information given by Northern Electricity Distribution Company (NEDCO), where a transformer will be used of 33/0.4 kV. No transformer will be used to convert from 33/11 kV and that's due to economical reasons.

29
* SINCE THE INDUSTRIAL REGION IS DIRECTLY CONNECTED TO THE CONNECTION POINT OF HOWARA, THERE'S NO NEED FOR A LOAD FLOW STUDY FOR THE WHOLE NETWORK WHICH IS CONNECTED TO IT.

30
Calculation: Real Power = 10 MW Power Factor = 0.85 Using Transformer of (33-0.4) KV Apparent Power S = ( Real Power / Power Factor) S = ( 10 / 0.85 ) = 11.76 MVA S Rated Transformer = ( S Load / Load Factor) S = ( 11.76 / 0.7 ) = 16.8 MVA
 KV Apparent Power S = ( Real Power / Power Factor) S = ( 10 / 0.85 ) = MVA S Rated Transformer = ( S Load / Load Factor) S = ( / 0.7 ) = 16.8 MVA")
31
CONCLUSION: After subjecting "Mojair Addin" network to a load flow study and improving it, drop voltage was clearly decreased, apparent losses was reduced, and the power factor was improved which will lead to a more efficient and stable system and to economical benefits on both NEDCO company and consumers as well.

32
THANK YOU FOR YOUR ATTENTION

Similar presentations


>")

 Introduced By View Power.>")


