Download presentation
Presentation is loading. Please wait.

1
Load Research Status Presentation to the Load Research/Forecasting Working Group June 3rd, 2010

2
Presentation Format 1. Current status of Load Research at Rocky Mountain Power 2. What is Load Research? 3. Issues to be addressed by the working group Load Research sampling (A Study in Philosophy, Science and Art) Comparison of class load estimates to billing data What do we do with irrigation? Forecasting class loads Weather normalization of class loads The calibration conundrum
 Comparison of class load estimates to billing data What do we do with irrigation. Forecasting class loads Weather normalization of class loads The calibration conundrum.")
3
Status Report

4
Utah DataDesignSampleInstall Class/ScheduleSourceCriteriaSizeDate Sch 001Stratified random sample90/5170October 2008 Sch 006Stratified random sample90/10108January 2009 Sch 023Stratified random sample90/1075October 2008 Sch 010Stratified random sample90/10130May 2006 Sch 008Direct MeasurementCensus Ongoing Sch 009Direct MeasurementCensus Ongoing Sch 021Direct MeasurementCensus Ongoing Sch 031Direct MeasurementCensus Ongoing

5
Load Research Meters MT NV Load Research Meters 226 WA 723 OR 389 WY 435 ID 1,262 UT 19 CA

6
Sample Rotation Schedule

7
Load Research Clients & Activities Support Organizations: Power Delivery Metering & Meter Reading CBS/Information Technology Regulation Commercial & Trading Forecasting Industry Affiliations: Association of Edison Electric Companies (AEIC) Western Load Research Association (WLRA) Client Organizations: Regulation Customer Billing Power Delivery Customer Service Power Supply Transmission/Wholesale Billing Forecasting Engineering Marketing & Demand Side/Strategic Planning Power Delivery Metering
 Western Load Research Association (WLRA) Client Organizations: Regulation Customer Billing Power Delivery Customer Service Power Supply Transmission/Wholesale Billing Forecasting Engineering Marketing & Demand Side/Strategic Planning Power Delivery Metering")
9
What is Load Research?

10
“an activity embracing the measurement and study of the characteristics of electric loads to provide a thorough and reliable knowledge of trends, and the general behavior of load characteristics of the more important services rendered by the electrical utility.” Association of Edison Illuminating Companies 2001

11
Huh? “load research allows utilities to study the ways their customers use electricity, either in total or by individual end uses” Association of Edison Illuminating Companies 2001

12
So… What is it really? The study of how and when our customers use energy so that PacifiCorp can most effectively: Allocate Costs as per Regulatory Mandate Design or Maximize Customer Rates Forecast Loads Service Customer Data Requests Size Transformers & Distribution Circuits Provide Enhanced Customer Service

13
Load Shape Electric usage varies over time and by customer type PacifiCorp is obligated to provide electricity (load) when the customer demands (kW) and for the length of time that the customer needs it (kWh). Load research (interval) data provides an important data input into planning, regulatory and financial decision making processes… 1,000 kWh
 data provides an important data input into planning, regulatory and financial decision making processes… 1,000 kWh.")
14
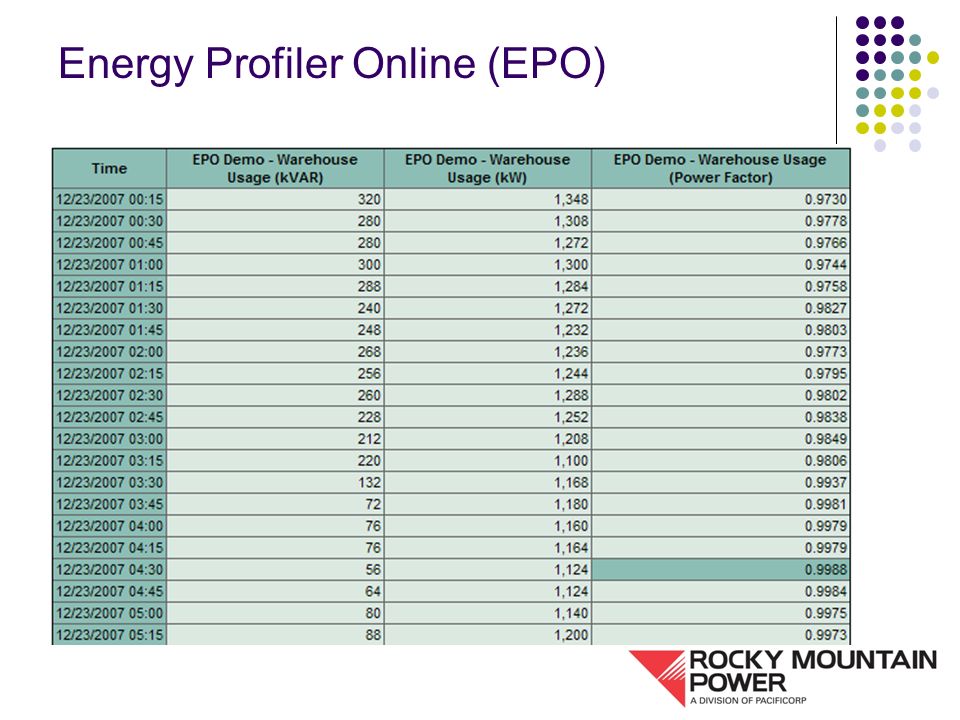
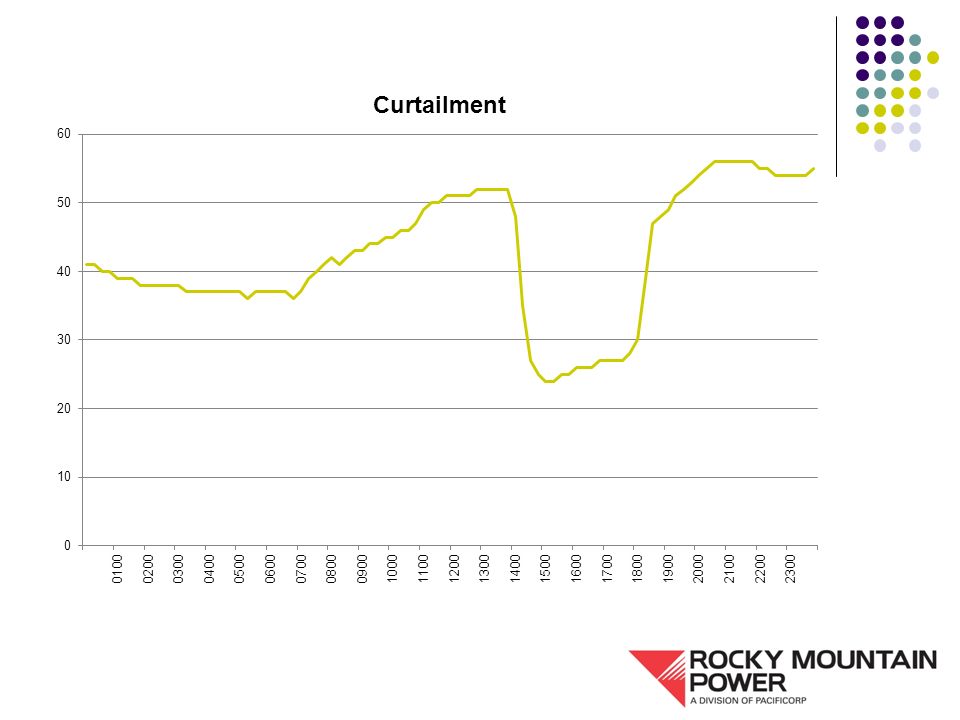
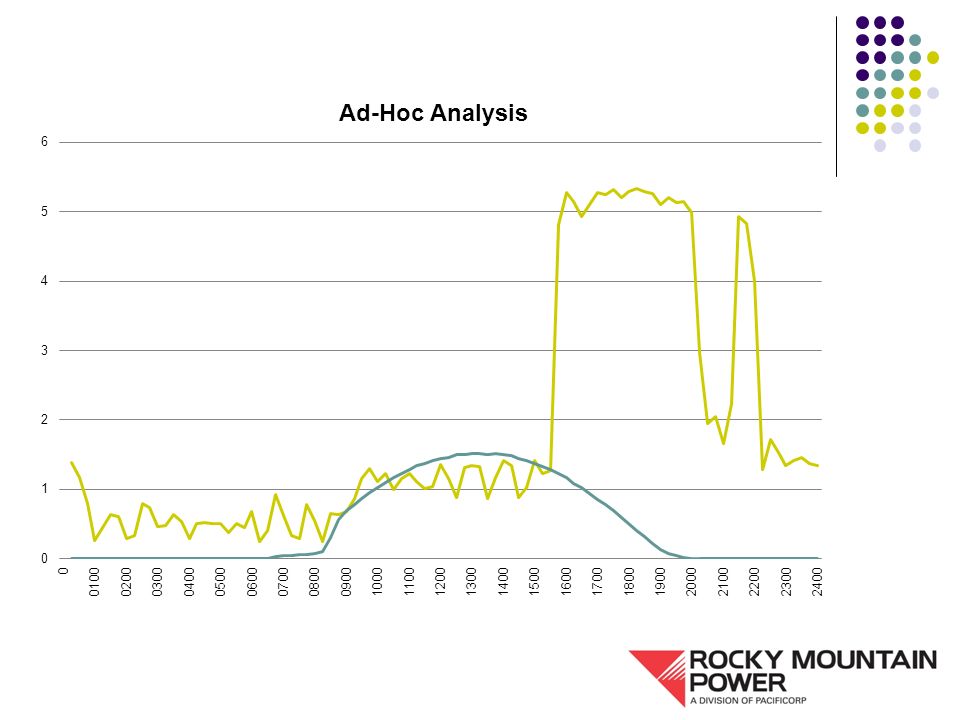
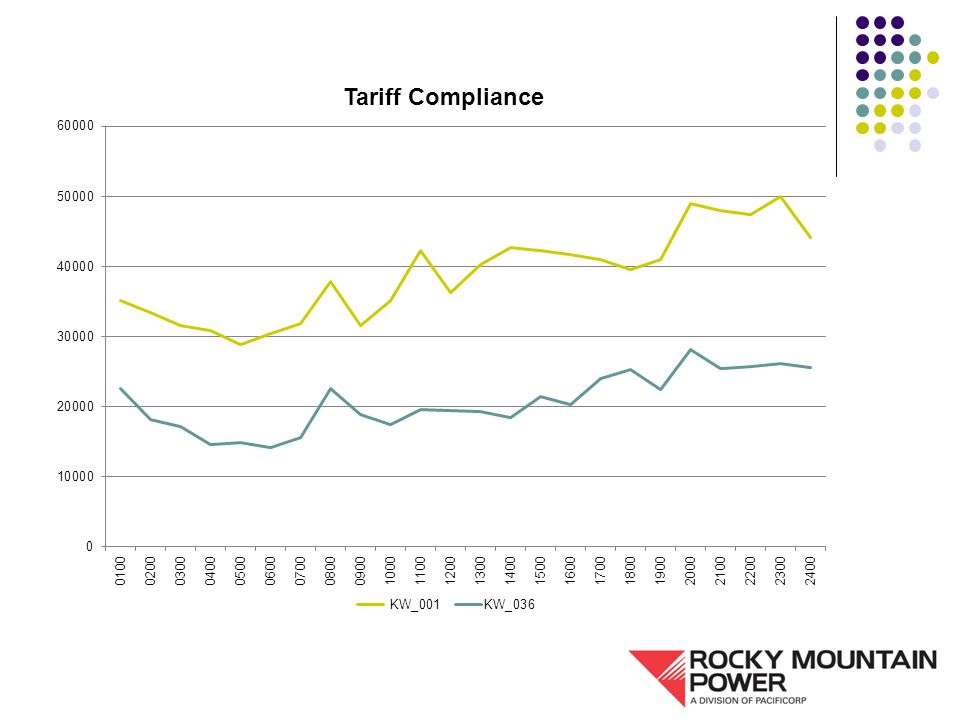
Energy Profiler Online (EPO)
")
19
A brief history………… Some utilities have performed load research since the 1930’s. The AEIC Load Research Committee held it’s first organizational meeting in 1944. In 1978, the Public Utilities Regulatory Policy Act (PURPA) required the utility industry to develop load research programs as a basis for cost-of- service filings with FERC and public utility commissions.
 required the utility industry to develop load research programs as a basis for cost-of- service filings with FERC and public utility commissions..")
20
So, what is a load profiling meter?

21
Load Research Sampling (A Study in Philosophy, Science and Art)
")
23
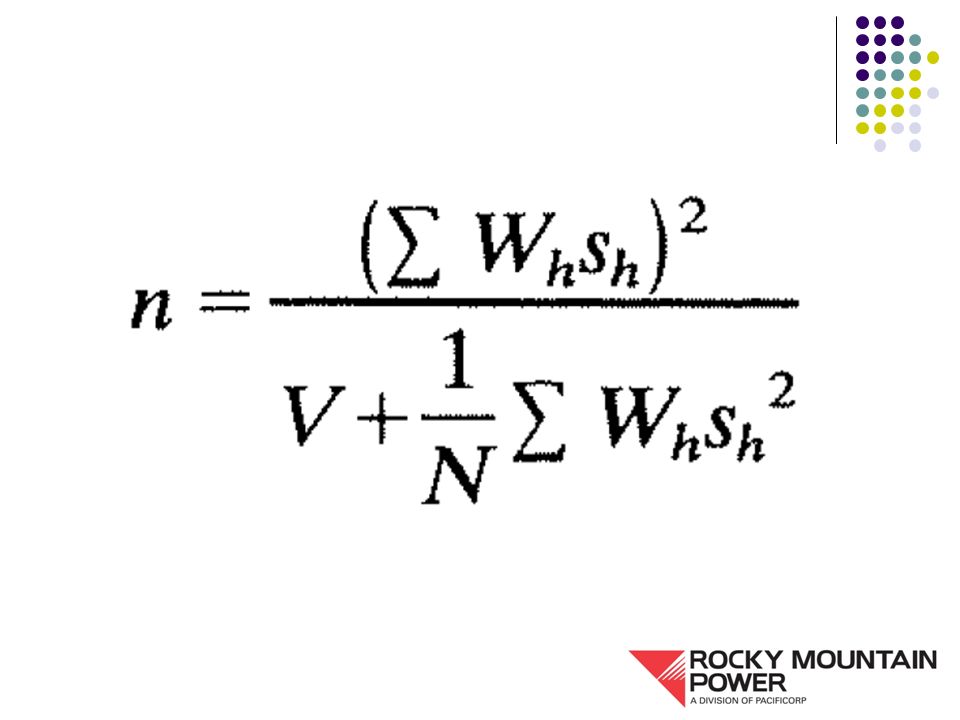
Section 133 of the 1978 Public Utilities Regulatory Policy Act (PURPA), Code of Federal Regulations (CFR), Title 18, Chapter 1, Subchapter K, Part 290.403, Subpart B “Accuracy Level. If sample metering is required, the sampling method and procedures for collecting, processing, and analyzing the sample loads, taken together, shall be designed so as to provide reasonably accurate data consistent with available technology and equipment. An accuracy of plus or minus 10 percent at the 90 percent confidence level shall be used as a target for the measurement of group loads at the time of system and customer group peaks.”

24
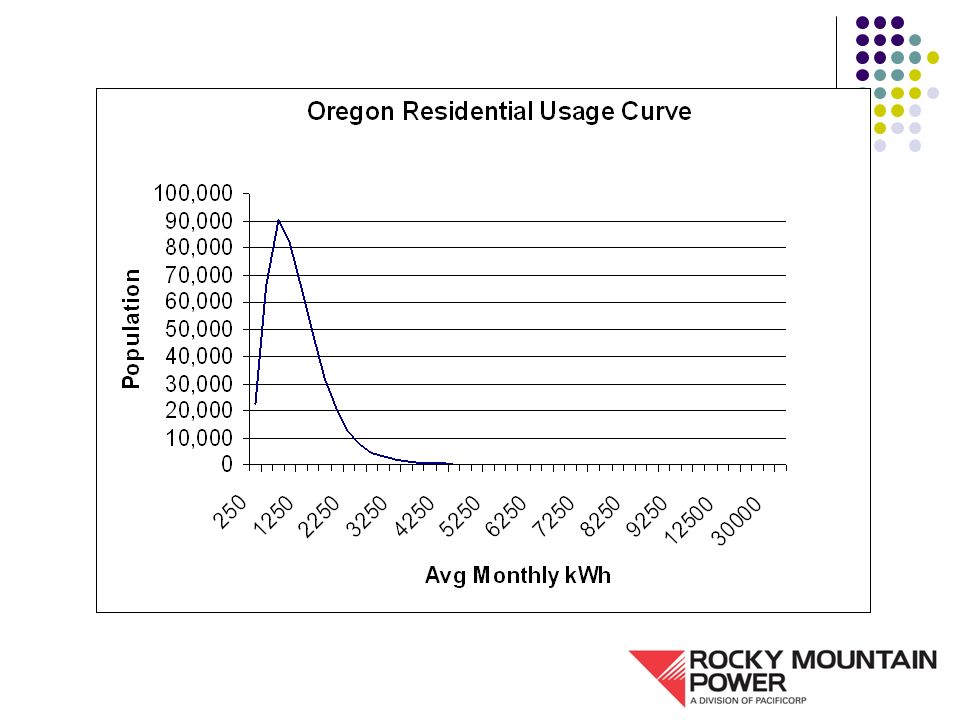
Population kW Demand 75,000 150,000 225,000 300,000 375,000 450,000 510152025303540 An absurdity…. Total Customers = 456,310 Average kW = 1.925 Total Customers = 456,310 Average kW = 1.927

26
Delanius-Hodges Bill Frequency Analysis Summary

27
Sample Design

28
Random Sample Selection

29
Sampling Challenges Voltage level breakouts Requests for load estimates by demand breakouts on non-demand metered customers (OR 23). New tariffs (OR 28 & 30, WY 28) Samples are designed for a specific purpose, which makes their usefulness in other areas very limited
 Samples are designed for a specific purpose, which makes their usefulness in other areas very limited.")
30
Comparison of class load data to billing estimates

31
Load Research Processing Steps 1.)INCLUDE NEW SAMPLE IN LOAD RESEARCH MV90 SYSTEM -Ensure master files are correct -Build summary maps -Add contributors by strata -Input weight factors -Determine statistics to be stored -Input sample size, pop size, thresholds 2.)VERIFY EXISTING SAMPLES VS CSS -Rate change, disconnected, alternates 3.)ENTER SYSTEM PEAK DAY AND TIMES INTO MV90 SYSTEM 4.)DETERMINE 305 DATA BROKEN DOWN BY RATE AND STRATA 5.)CALCULATE USAGE DATA FOR ALL CONTRIBUTORS
INCLUDE NEW SAMPLE IN LOAD RESEARCH MV90 SYSTEM -Ensure master files are correct -Build summary maps -Add contributors by strata -Input weight factors -Determine statistics to be stored -Input sample size, pop size, thresholds 2.)VERIFY EXISTING SAMPLES VS CSS -Rate change, disconnected, alternates 3.)ENTER SYSTEM PEAK DAY AND TIMES INTO MV90 SYSTEM 4.)DETERMINE 305 DATA BROKEN DOWN BY RATE AND STRATA 5.)CALCULATE USAGE DATA FOR ALL CONTRIBUTORS")
32
Load Research Processing Steps 6.)CALCULATE AVERAGE USAGE FOR CLASS AND STRATA 7.)INPUT MONTHLY POPULATIONS AND KWH BY CLASS AND STRATA 8.)TOTALIZE BY STRATA 9.)RUN REPORTS AND GRAPHS -Check for missing data, gaps, outliers -Modify summary map start/stop times -Delete data directory -Delete or Add to calculate usage data files (step 5) -Re-calculate average usage (step 6) -Re-totalize (step 8) -Run reports and graphs (step 9) 10.)VERIFY MV90 SAMPLE AVERAGES ARE COMPLETE
CALCULATE AVERAGE USAGE FOR CLASS AND STRATA 7.)INPUT MONTHLY POPULATIONS AND KWH BY CLASS AND STRATA 8.)TOTALIZE BY STRATA 9.)RUN REPORTS AND GRAPHS -Check for missing data, gaps, outliers -Modify summary map start/stop times -Delete data directory -Delete or Add to calculate usage data files (step 5) -Re-calculate average usage (step 6) -Re-totalize (step 8) -Run reports and graphs (step 9) 10.)VERIFY MV90 SAMPLE AVERAGES ARE COMPLETE")
33
LOAD RESEARCH PROCESSING STEPS 11.)EXPORT MV90 SAMPLE AVERAGES INTO SAS FILES 12.)EXPAND MV90 SAMPLE AVERAGES BY POPULATION 13.)BUILD STREET LIGHTING AND OFF SEASON IRRIGATION SCHEDULES 14.)ADJUST LOAD RESEARCH KWH TO PRICING KWH 15.)DETERMING DISTRIBUTION PEAK DAY AND TIMES 16.)EXTRACT VARIOUS REPORT DATA -System peaks -Distribution peaks -Schedule peaks -Class peaks -etc.
EXPORT MV90 SAMPLE AVERAGES INTO SAS FILES 12.)EXPAND MV90 SAMPLE AVERAGES BY POPULATION 13.)BUILD STREET LIGHTING AND OFF SEASON IRRIGATION SCHEDULES 14.)ADJUST LOAD RESEARCH KWH TO PRICING KWH 15.)DETERMING DISTRIBUTION PEAK DAY AND TIMES 16.)EXTRACT VARIOUS REPORT DATA -System peaks -Distribution peaks -Schedule peaks -Class peaks -etc.")
34
Preparation of Class loads to be used in Rate Filing

35
Annual Summary Report

36
JulyAugust 1234567891011121314151617181920212223242526272829303112345678910111213141516171819202122232425262728293031 Cycle Days

37
Adjust to Pricing Kwh

38
What do we do with irrigation?

39
Issues Associated with Irrigation Samples In 2008, there were 2,695 irrigation customers listed as active in the Company’s billing system. Of that amount: 240 had 0 usage for the season 149 had less that 250 kWh of usage during the season 14% of total active customers had 0 or very low usage for the season In 2009, there were 2,745 irrigation customers listed as active in the Company’s billing system. Of that amount: 230 had 0 usage for the season 160 had less that 250 kWh of usage during the season 14% of total active customers had 0 or very low usage for the season

40
Issues Associated with Irrigation Samples Typically a high variance group There really is no standard irrigation load shape

41
Issues Associated with Irrigation Samples Recommended solution: Structure the sample design and customer selection process such that you have a high probability of selecting customers who are actively irrigating. The purpose of this design philosophy is to construct a load curve which reflects actual active irrigation. Utilization of this philosophy will always provide estimates that exceed billed usage Implementation of this philosophy requires that the load curves provided be adjusted downward to reflect billed energy for the class

42
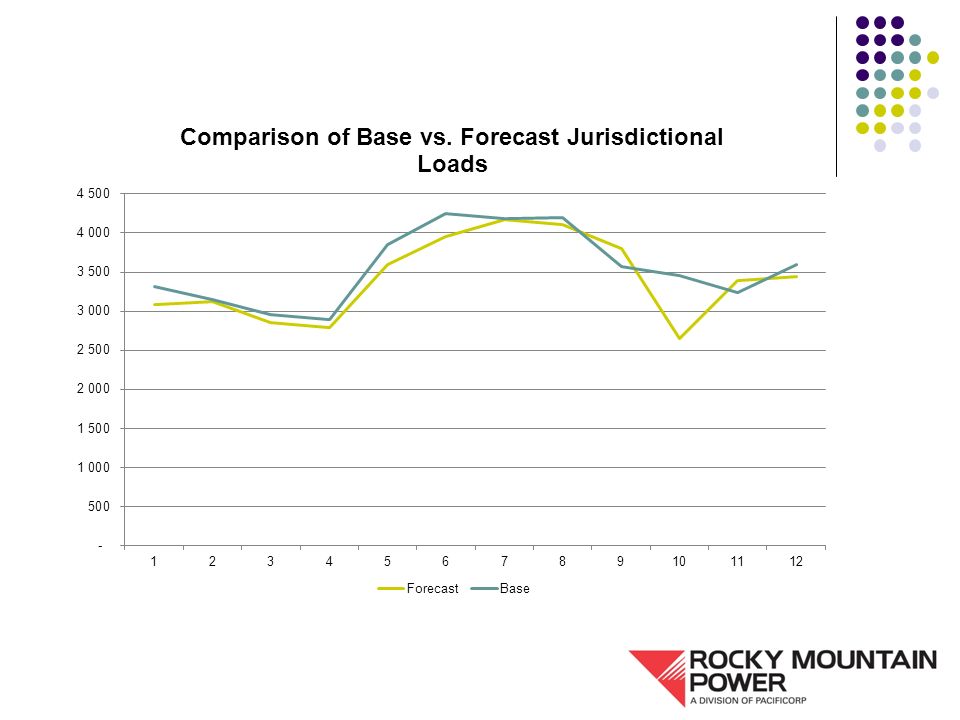
Forecasting class loads

43
Peak Date Alignment

44
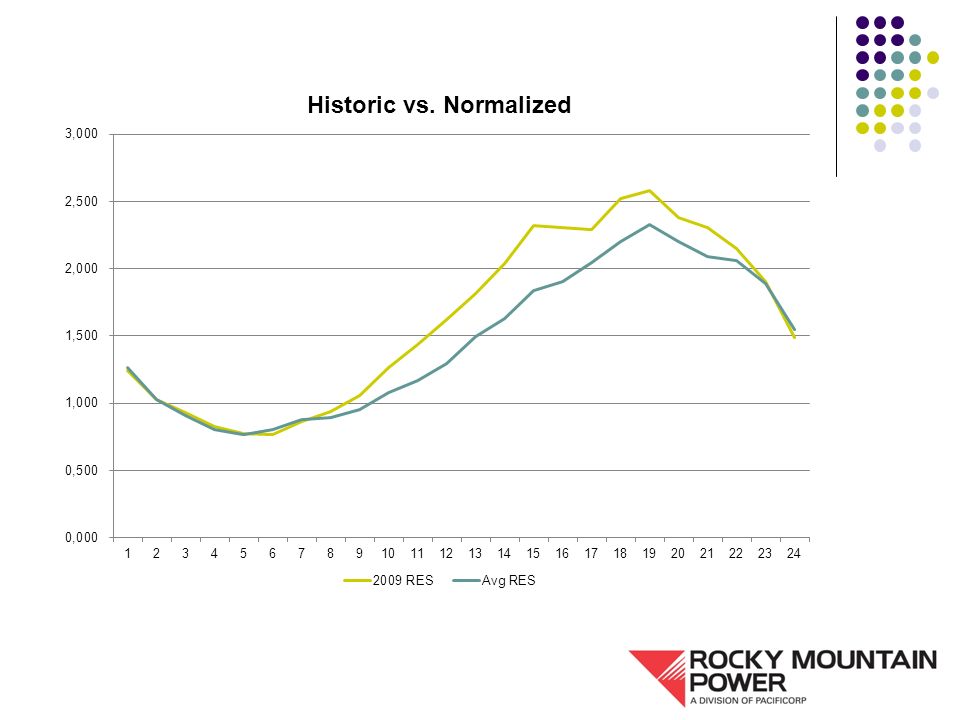
Weather normalization of class loads

46
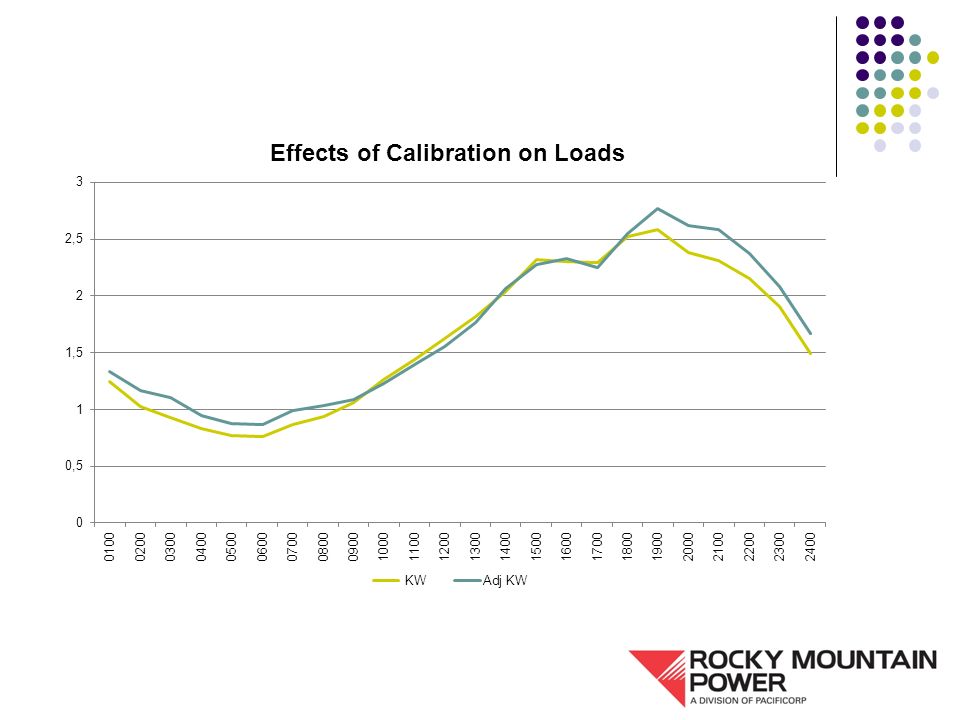
The calibration conundrum

47
Regulatory Support End Use Customer Class Tariff Jurisdiction System Regulatory Analysis Peak Forecasting Loss Analysis Customer Service Retail Access Billing EPO C&T Back Office Load Research

48
The calibration philosophy rests upon a faulty assumption: Any difference between class loads and jurisdictional loads is entirely attributable to sampling error in the sampled classes.

49
Calibration Issues Jurisdictional loads and class loads are not homogeneous Loss Factors Real world vs. the theoretical

52
Questions?

Similar presentations