Download presentation
Presentation is loading. Please wait.

1
Economics of a New Generation of Bioenergy Crops: Implications for Land Use and Greenhouse Gases
Madhu Khanna Department of Agricultural and Consumer Economics University of Illinois, Urbana-Champaign With Hayri Onal, Basanta Dhungana, Michelle Wander and John Clifton-Brown Funding provided by the Illinois CFAR and Dudley Smith Initiative

2
Mitigating Climate Change: Role of Cropland
Renewable Energy Providing biomass: Co-fired with coal in power plants Converted to cellulosic ethanol Ethanol from corn grain Soil Carbon Sequestration

3
Dedicated Energy Crops : Switchgrass and Miscanthus
Adaptable to wide range of growing conditions High yielding perennials Low initial and annual input requirements Compatible with row crop production require conventional equipment; winter harvests

4
Life-Cycle Carbon Emissions

5
Soil Carbon Sequestration
Conservation tillage with corn and soybean: MT/ha/yr Perennial grasses 3 times higher MT/ha/yr Existing Soil Carbon Stocks

6
Policy and Market-Based Incentives
Renewable Portfolio Standards House energy bill: a national standard requiring 15% of electricity to be from renewable sources by 2020 Renewable Fuel Standards Senate Bill: 36 billion-gallon per year biofuel mandate by 2022, up from 8.5 billion gallons in 2008. Pilot carbon credit programs Chicago Climate Exchange Illinois Conservation Climate Initiative Regional Greenhouse Gas Initiative Power plants seeking low cost C offsets 36 Cellulosic 14 Corn Ethanol

7
Research Problem Develop a spatial and dynamic land allocation model to examine (in the context of Illinois ): Allocation of cropland to bioenergy crops for co-firing in coal-based electricity generating plants based on market incentives Implications of co-firing bioenergy for carbon emissions Implications of bioenergy crops for costs of carbon mitigation through sequestration and displacement of coal from power plants Economic viability of cellulosic ethanol and carbon mitigation potential

8
Spatial and Temporal Heterogeneity
Profitability of bioenergy crops varies with heterogeneity in Productivity, costs and prices of row crops Productivity and costs of perennials – age specific Location of end uses (power plants) for bio-energy Carbon mitigation benefits vary spatially and with length of time under a land use Soil carbon sequestration rates Vary across space with existing stocks of carbon already in the soil Diminish over time: Non-linear C accumulation function Upper bound to seq. capacity Reversible and asymmetric Life-Cycle carbon emissions depend on fertilization rates, machinery use, fuel use: yield dependent
 for bio-energy. Carbon mitigation benefits vary spatially and with length of time under a land use. Soil carbon sequestration rates. Vary across space with existing stocks of carbon already in the soil. Diminish over time: Non-linear C accumulation function. Upper bound to seq. capacity. Reversible and asymmetric. Life-Cycle carbon emissions depend on fertilization rates, machinery use, fuel use: yield dependent.")
9
Economic Model Objective: Allocate land among 4 row crops, 3 perennials, 2 tillage choices, 18 rotations to maximize discounted value of profits over a 15 year period Dynamic: Returns and carbon emissions in the next period depend on decisions in this period and with age of perennials Spatial: Returns and carbon emissions/sequestration vary over 102 Illinois counties Constraints on Capacity of power plants for co-firing bio-energy (5-25%) Location of existing coal based power plants Crop rotation possibilities Cropland availability Ease of conversion of land from one use to another Sequestration rates with each land use Carbon emission mitigation rate with each land use
 Location of existing coal based power plants. Crop rotation possibilities. Cropland availability. Ease of conversion of land from one use to another. Sequestration rates with each land use. Carbon emission mitigation rate with each land use.")
10
Data for Illinois Yields
Simulated yield of Miscanthus and Switchgrass Historical climate, soil moisture, solar radiation Historical average yields of conventional crops Costs of production by county, tillage and rotation Revenues for row crops Revenues for energy crops Location of power plants; heat content; cost of coal energy Carbon stocks by county Carbon accumulation functions by land use and by county Conservation tillage, pasture, switchgrass and miscanthus

11
Growing Conditions for Miscanthus in Illinois
Yield of Miscanthus simulated using 30 year climate data on solar radiation, temperature, frost dates, precipitation, soil evaporation and water holding capacity at 2 sq km level Temperature most important factor in leaf expansion with optimal water and nutrients

12
Yield/Hectare and Costs of Production
Actual average yield of Miscanthus(t DM/ha) ( ) Simulated yield of Miscanthus (t DM/ha) Actual average yield of Switchgrass(t/ha) ( ) North (DeKalb) 28.5 30.6 8.1 Central (Champaign) 42.4 35.4 16.8 South (Dixon Spring) 46.0 39.9 8.6 State Average 39.0 35.3 11.2
 ( ) Simulated yield of Miscanthus (t DM/ha) Actual average yield of Switchgrass(t/ha) ( ) North (DeKalb) Central (Champaign) South (Dixon Spring) State Average")
13
Bio-Energy Production with 5% Co-firing Capacity
Bio-Energy Price per MBTU < $2.5 $3.0 $3.4 Land under conservation till (%) 45.07 44.61 44.29 Land under Miscanthus (%) 0.77 1.19 Biomass Supply (MMT with 15% moisture) 1.96 2.94 Electricity generated with bio-energy (%) 2.5 3.8 Maximum distance for transportation of biomass (miles) 32.94 52.32 Carbon Sequestration in 15 years (Million Metric Tons) 15.96 16.86 17.44 By Conservation till (%) 92.95 86.92 82.99 By Miscanthus (%) 0.00 6.37 10.65 Discounted present value of bio-energy subsidy ($M) 496 909 Maximum price a power plant would be willing to pay for biomass based on energy content: $1.185/MBTU
 Land under Miscanthus (%) Biomass Supply (MMT with 15% moisture) Electricity generated with bio-energy (%) Maximum distance for transportation of biomass (miles) Carbon Sequestration in 15 years (Million Metric Tons) By Conservation till (%) By Miscanthus (%) Discounted present value of bio-energy subsidy ($M) Maximum price a power plant would be willing to pay for biomass based on energy content: $1.185/MBTU.")
15
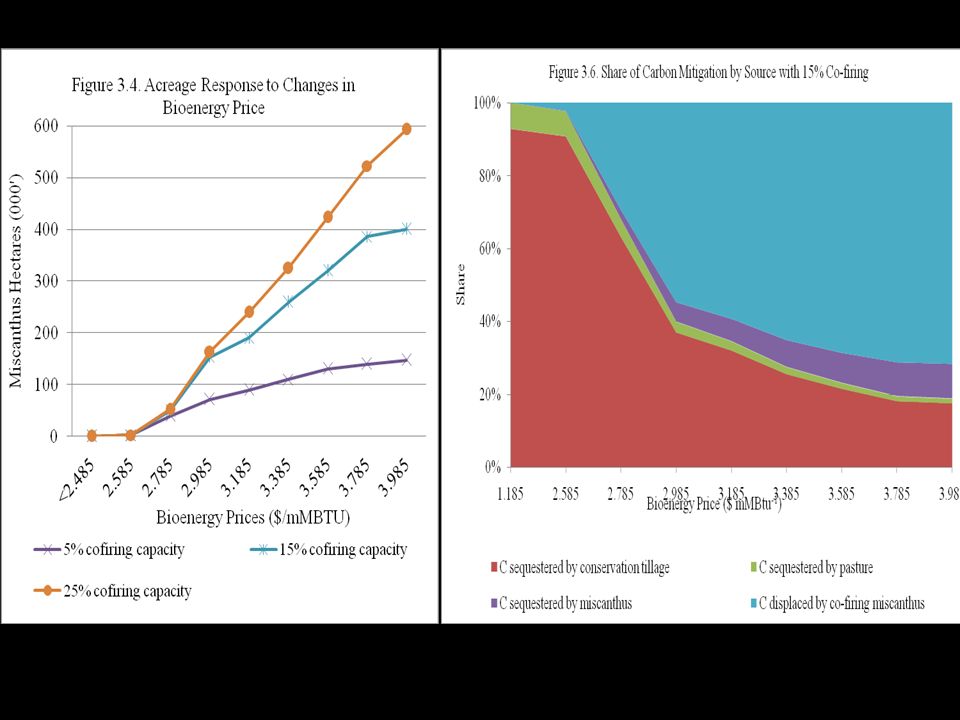
Area under miscanthus at $3 MBtu-1 with 15% co-firing limit
Increase in county share of miscanthus acres with $3.4 MBtu-1 At $3.4 MBTU-1 x x x x x x x x x x x x x x x x x x x x

16
Biomass co-firing capacity (%)
Cost of Carbon Mitigation with Bioenergy Biomass co-firing capacity (%) BAU 15% co-firing capacity Carbon Mitigation (MMT) 0 MMT Carbon Subsidy 10MMT 40MMT Bioenergy Subsidy $2.2/MBTU Land under conservation till (%) 45 53 43 Land under miscanthus (%) 0.4 2.8 Electricity generated with miscanthus (%) 1.1 8.1 9.2 Maximum hauling distance (miles) 26 70 52.32 Number of counties producing miscanthus 24 77 65 Number of power plants co-firing miscanthus 14 23 22 Discounted carbon price ($/MT) 52 78 - Annualized carbon price ($/MT per year) 2 3 C mitigated in 15 years (MMT) -Through displacement -Through sequestration: Conservation tillage Miscanthus 16 5 20 35 19 13 4 % of carbon mitigated in 15 years 7 15 % sulfur displaced in 15 years 0.8 6 Total Subsidy Payment ($M) 246 2706 2173
 BAU. 15% co-firing capacity. Carbon Mitigation (MMT) 0 MMT. Carbon Subsidy. 10MMT 40MMT. Bioenergy Subsidy. $2.2/MBTU. Land under conservation till (%) Land under miscanthus (%) Electricity generated with miscanthus (%) Maximum hauling distance (miles) Number of counties producing miscanthus Number of power plants co-firing miscanthus Discounted carbon price ($/MT) Annualized carbon price ($/MT per year) C mitigated in 15 years (MMT) -Through displacement. -Through sequestration: Conservation tillage. - Miscanthus % of carbon mitigated in 15 years % sulfur displaced in 15 years Total Subsidy Payment ($M)")
17
County Share of Miscanthus Acres with 10MMT C Target
County Share in Increased Miscanthus Acres with 70 MMT C Target Relative to 10 MMT C County Share of Miscanthus Acres with 10MMT C Target 15% Co-firing Constraint

18
Competitiveness of Cellulosic Ethanol

20
Figures above bars represent cost of production net of co-product credit (2003 prices except current energy input costs for corn-ethanol); 40 M gal. corn-ethanol plant and 25 M gal. cellulosic ethanol plant ; Corn price of $3.50/b and Soybean Price $7/b Process for cellulosic ethanol production with mature technology: dilute acid prehydrolysis with enzymatic saccharification of remaining cellulose and co-fermentation of glucose to ethanol (USDA/USDOE, 2005)
")
23
Summary Considerable spatial variability in allocation of land to bioenergy crops and to different types of bioenergy crops Fairly high bioenergy subsidies needed to induce a switch to miscanthus for electricity generation or ethanol production Unless carbon emissions reduction is valued Incentives for bioenergy crops could also come from agro-environmental policy rewarding other soil and water quality benefits from bioenergy crops Need for coordination between energy policy, climate policy and conservation policy

Similar presentations


>")


