Download presentation
Presentation is loading. Please wait.

1
Bhargava Kandala Department of Pharmaceutics College of Pharmacy, UF Design and Analysis of Crossover Study Designs

2
Crossover Study Treatments administered in a sequence to each experimental unit over a set of time periods. Comparison of treatments on a within-subject level. Increased precision of treatment comparisons. A treatment given in one period might influence the response in the following treatment period – residual/carryover effect Baseline values – Can be included as covariates to increase the precision

3
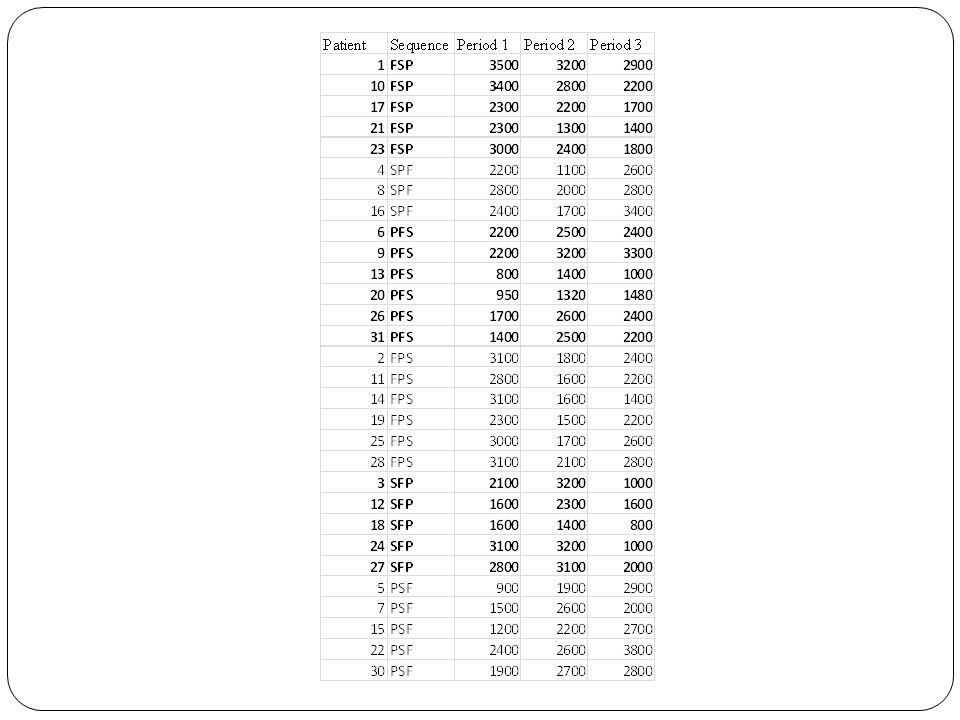
Study Design Single center, double blind, randomized, 3 period, 3 treatment, 3 sequence crossover study Randomization Low Medium High Low Medium High Low Medium High Washout Subjects = 10 Baseline 1 Period 1 (q.d.) Period 2 (q.d.) Period 3 (q.d.) Baseline 2 Baseline 3 PD Measurements 1 Week 5 days
 Period 2 (q.d.) Period 3 (q.d.) Baseline 2 Baseline 3 PD Measurements 1 Week 5 days")
4
Model for Crossover Design Period123456 IABCABC IIBCACAB IIICABBCA

5
proc glm data = allperiodanaly; class sequence subject period trt; model fenoav = sequence subject(sequence) period trt/solution; random subject(sequence); run;
 period trt/solution; random subject(sequence); run;")
6
proc mixed data = allperiodanaly; class sequence subject period trt; model fenoav = sequence period trt; random subject(sequence); lsmeans trt/ pdiff cl; run;
; lsmeans trt/ pdiff cl; run;")
7
Baseline

8
Baseline - Covariate Average baseline values not significantly different Presence of significant carryover effects (p-value < 0.05) No CovariateAnalysis of Covariance (ANCOVA) Baseline – Treatment β = 0β = Model Estimateβ =1 Baseline is not used as a covariate Baseline values are treated as a quantitative variable By taking the simple difference the value of β is forced to be 1
 No CovariateAnalysis of Covariance (ANCOVA) Baseline – Treatment β = 0β = Model Estimateβ =1 Baseline is not used as a covariate Baseline values are treated as a quantitative variable By taking the simple difference the value of β is forced to be 1")
9
Carryover Effect

10
* Covariates tested for carryover; proc mixed data = allperiodanaly; class sequence subject period trt; model fenoav = sequence period fenob trt carry1 carry2; random subject(sequence); lsmeans trt/ pdiff cl e; run;
; lsmeans trt/ pdiff cl e; run;")
11
Results β cannot be forced to be 1 ParameterNo CovariateAnalysis of Covariance (ANCOVA) Baseline – Treatment β 00.381 Residual Variability 85.3967.02180.02 Carryover EffectNot significant (p-value >0.05) Not Significant (p-value>0.05) Significant
 Baseline – Treatment β Residual Variability Carryover EffectNot significant (p-value >0.05) Not Significant (p-value>0.05) Significant")
12
Results ParameterNo CovariateAnalysis of Covariance (ANCOVA) Baseline – Treatment β 00.381 Residual Variability 85.3967.02180.02 Carryover EffectNot significant (p-value >0.05) Not Significant (p-value>0.05) Significant
 Baseline – Treatment β Residual Variability Carryover EffectNot significant (p-value >0.05) Not Significant (p-value>0.05) Significant")
13
Results Reduced impact of the baseline values while using ANCOVA can explain the absence of carryover effects ParameterNo CovariateAnalysis of Covariance (ANCOVA) Baseline – Treatment β 00.381 Residual Variability 85.3967.02180.02 Carryover EffectNot significant (p-value >0.05) Not Significant (p-value>0.05) Significant
 Baseline – Treatment β Residual Variability Carryover EffectNot significant (p-value >0.05) Not Significant (p-value>0.05) Significant")
14
Conclusions Day 5 data suitable for analysis Maximum dose resolution No carryover effect Baseline adjustment Simple difference increases the variability and introduces carryover effects ANCOVA is the preferred method Crossover design model with baseline values as covariates will be used for future simulations

Similar presentations
 on which no variable.>")


 A procedure for comparing treatment means that incorporates information on a quantitative explanatory variable,>")


 Impact Research for Better Schools RMC Corporation.>")