Download presentation
Presentation is loading. Please wait.

1
Gesa-Partner 8 East-Macedonia Thrace – Participants: Prof N Kotsovinos, Prof. C Koutitas,, Prof. V Hrissanthou, and the M.Sci. Eng. A. Georgoulas,A Samaras, A Valsamidis, M. Andredaki During the on going Phase C the GESA research team of the region East -Macedonia Thrace, worked along three particular projects : 1) modelling the turbidity currents generated during floods at the rivers mouth, and examine in particular the importance of the turbidity currents of river Evros in the overall morphodynamics of the continental shelf. 2) to elaborate on the appropriate methodologies in order to calculate the reduction of the sediment yield at the mouth of (big) rivers due to construction of dams 2) detailed simulation of morphodynamic modelling and shoreline changes in the vicinity of the Nestos river Delta, using the software programs CEDAS ( NEMOS, GENESIS) Beachmed_e _GESA TURBIDITY –MONTPELLIER MEETING _ NOV _2008
 modelling the turbidity currents generated during floods at the rivers mouth, and examine in particular the importance of the turbidity currents of river Evros in the overall morphodynamics of the continental shelf. 2) to elaborate on the appropriate methodologies in order to calculate the reduction of the sediment yield at the mouth of (big) rivers due to construction of dams 2) detailed simulation of morphodynamic modelling and shoreline changes in the vicinity of the Nestos river Delta, using the software programs CEDAS ( NEMOS, GENESIS) Beachmed_e _GESA TURBIDITY –MONTPELLIER MEETING _ NOV _2008.")
11
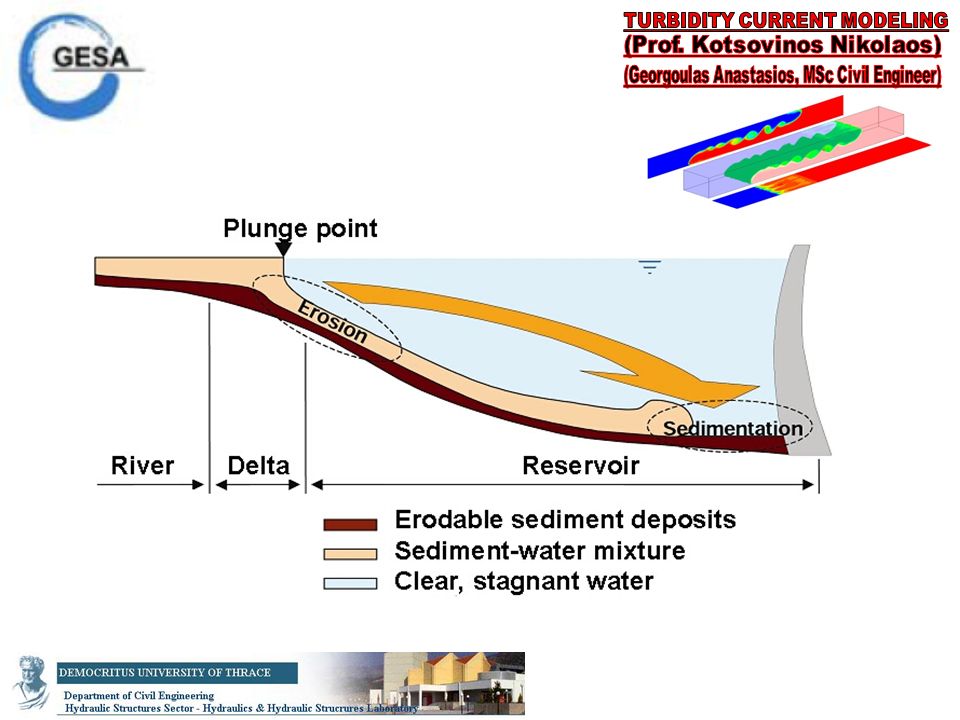
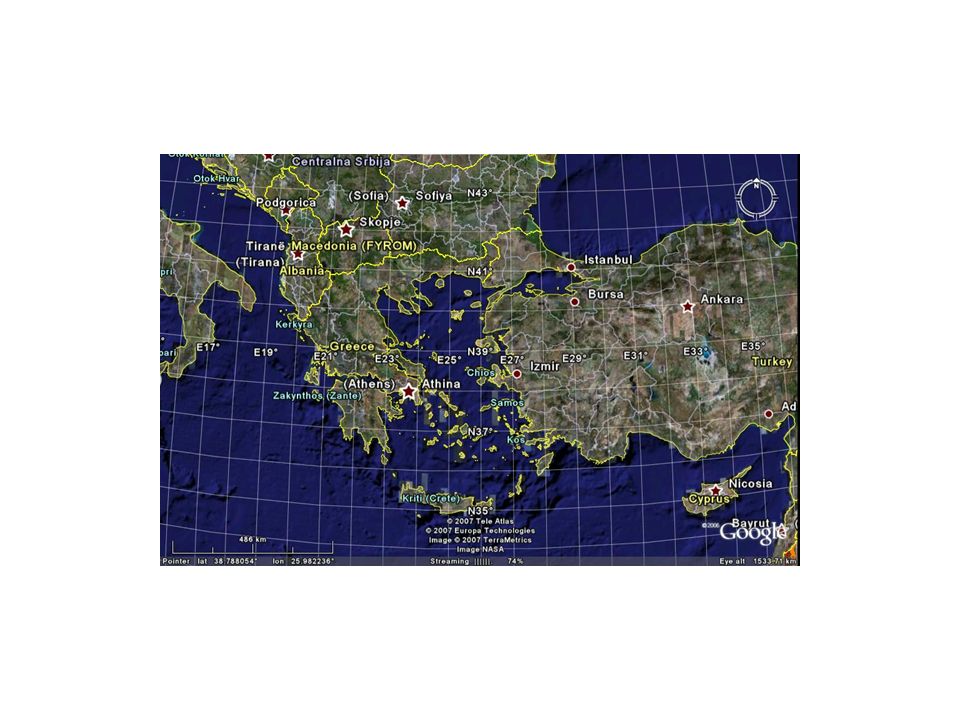
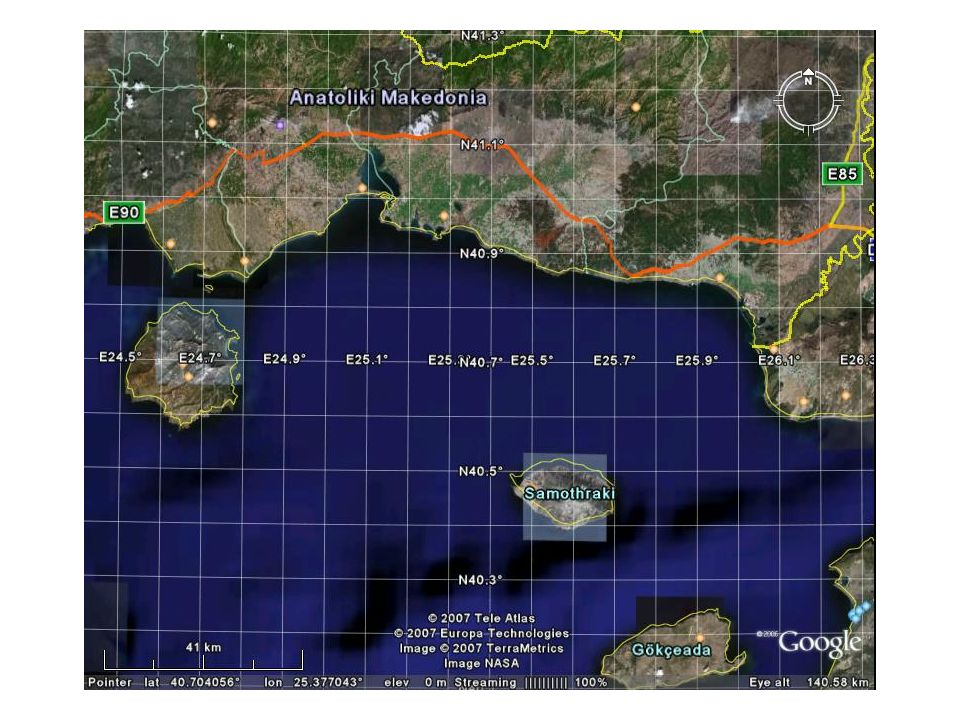
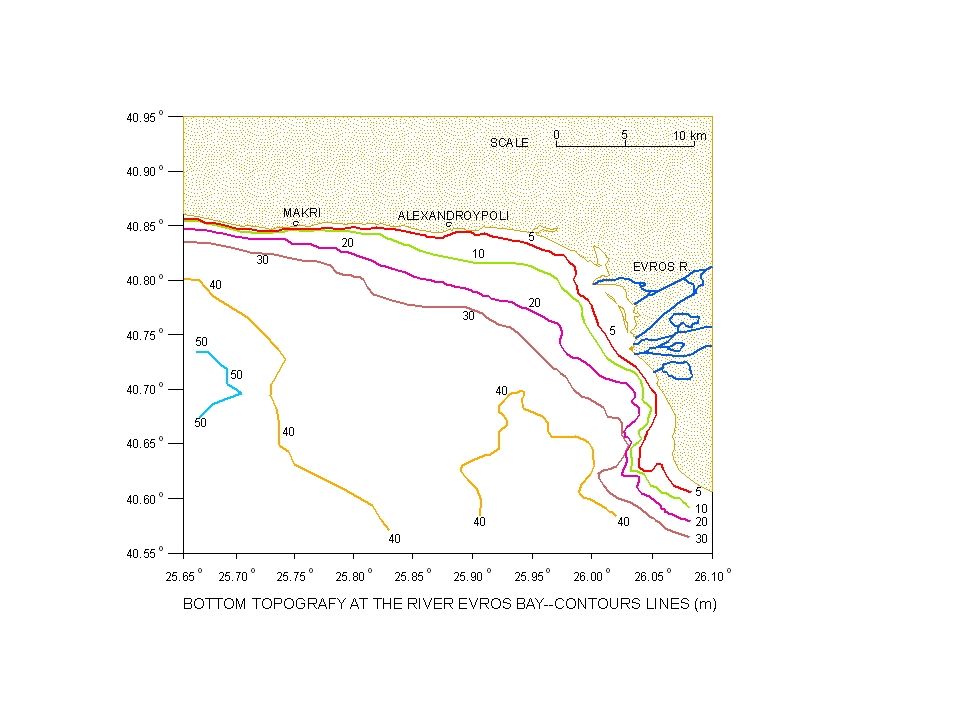
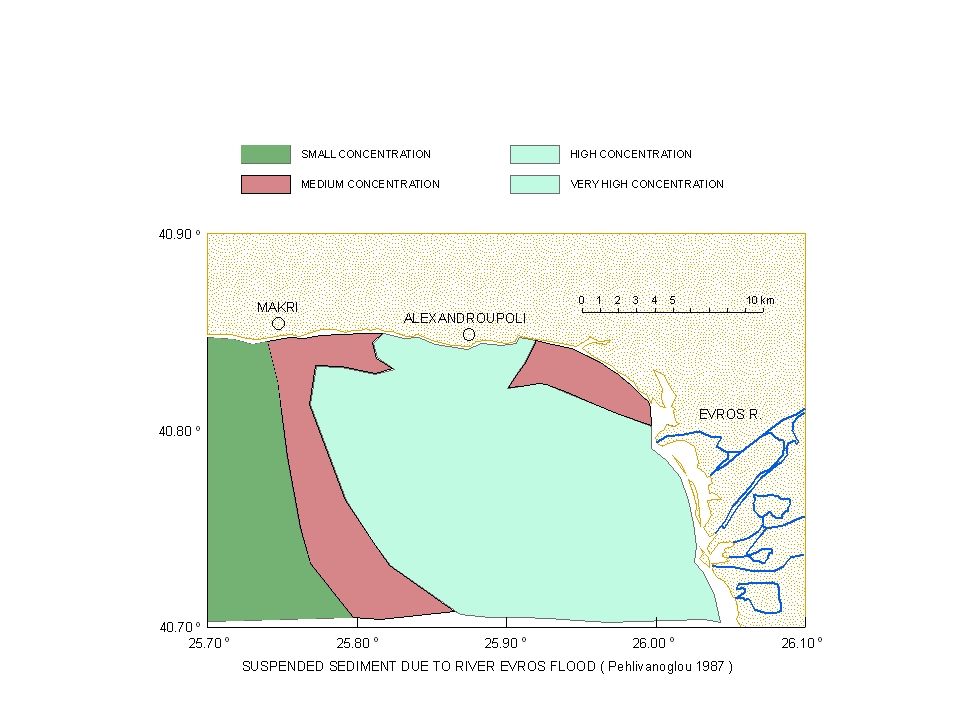
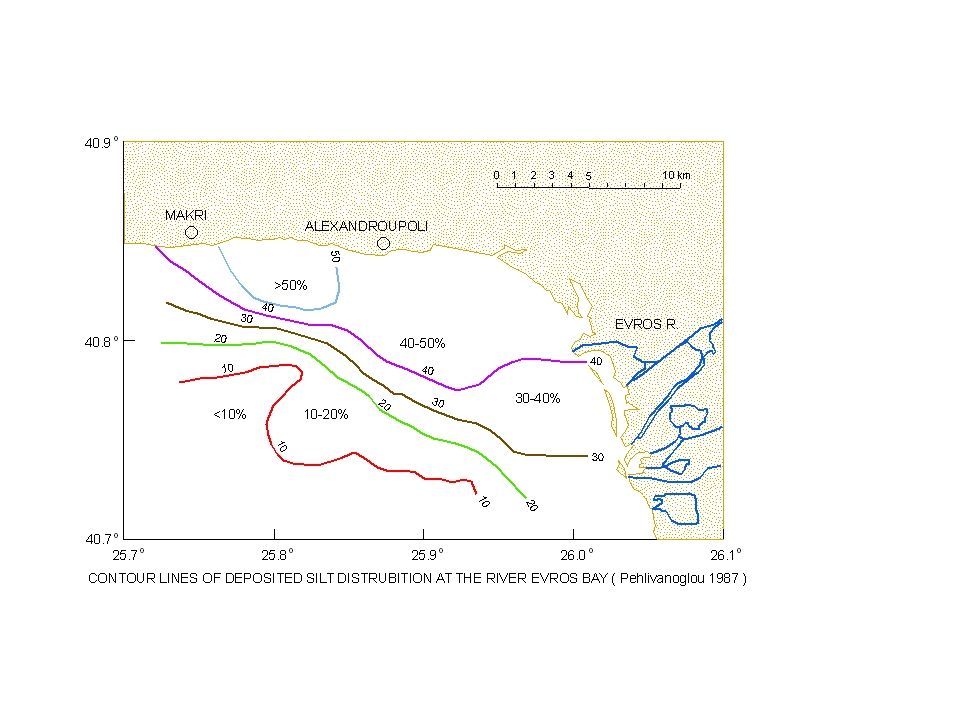
Possible formation of Hyperpycnal flows (Turbidity currents) during extreme flood events due to excess suspending sediment concentration in Nestos river discharge into Aegean sea. Formation of Hyperpycnal flows (Turbidity currents) during extreme flood events due to excess suspending sediment concentration in Evros river discharge into Aegean sea.
 during extreme flood events due to excess suspending sediment concentration in Evros river discharge into Aegean sea..")
12
The simulation is carried out using Fluent. The Numerical model assumes 2 separate Fluids, fresh water being the Primary Fluid and water-sand mixture being the secondary Fluid. The numerical model solves the Reynolds-averaged Navier-Stokes equations together with an equation that calculates the Volume Fraction of the secondary fluid. Closure of the turbulence stress terms is obtained by using the k-e turbulence model, where k is The turbulent kinetic energy and e is the turbulence dissipation rate. The model solves the above equations for each of the two fluids and for each cell of the Mesh that is used. The time step is chosen to be 0.1 sec and the total simulation time for Each run is 15 sec.

13
Computational Fluid Dynamic (CFD ) modelling of turbidity currents, with primary focus on the flow structure, as well as particle transport, erosion and deposition of turbidity currents. 3D simulation of hyperpycnal flows after extreme flood events using FLUENT 6.3 (A robust CFD Solver). Study of sediment transport from the river mouth to the continental slope. Study of sea bed erosion and deposition. Application in Nestos and Evros rivers.
. Study of sediment transport from the river mouth to the continental slope. Study of sea bed erosion and deposition. Application in Nestos and Evros rivers..")
25
Bed initially covered with Fine Sand (Vol. Fraction of 0.56) t=1sec
 t=1sec")
26
t=15sec Channel with Levees Lobe

27
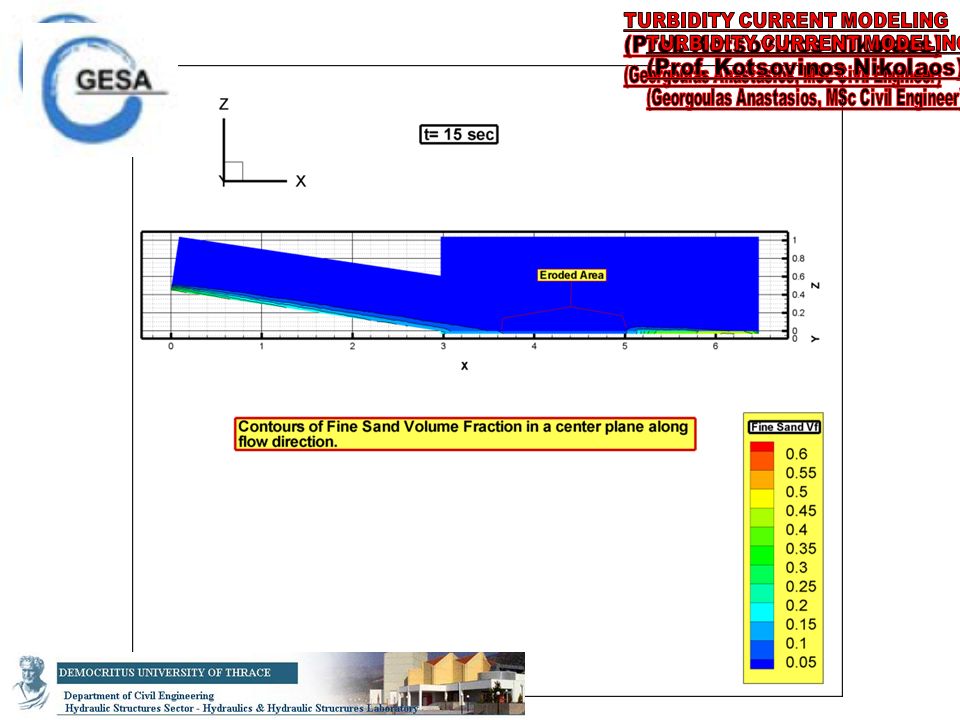
Eroded Area

28
T=6sec

29
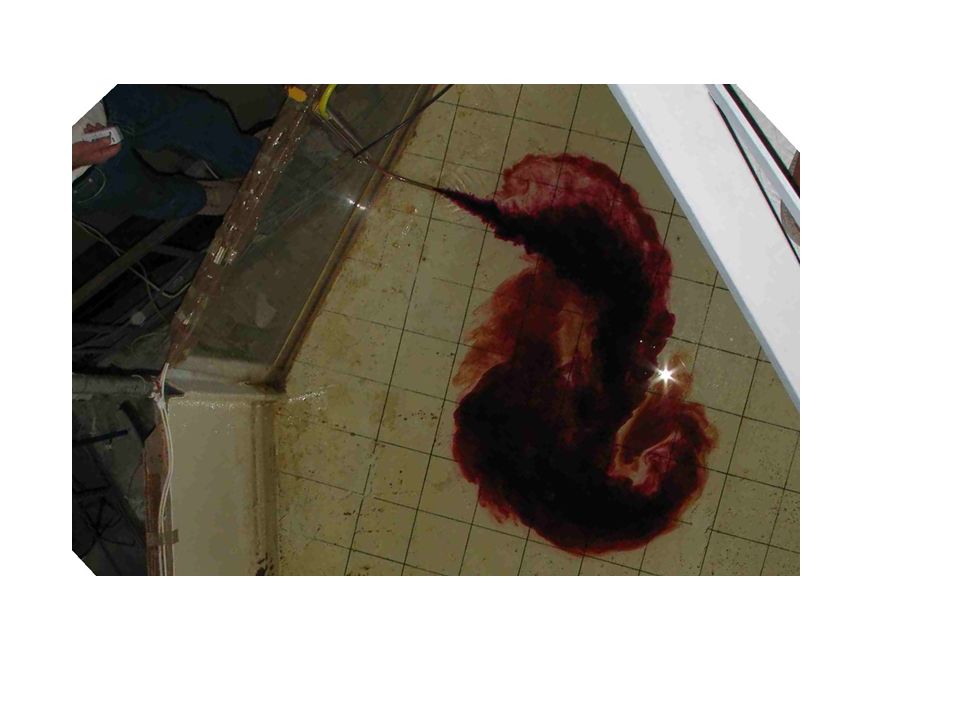
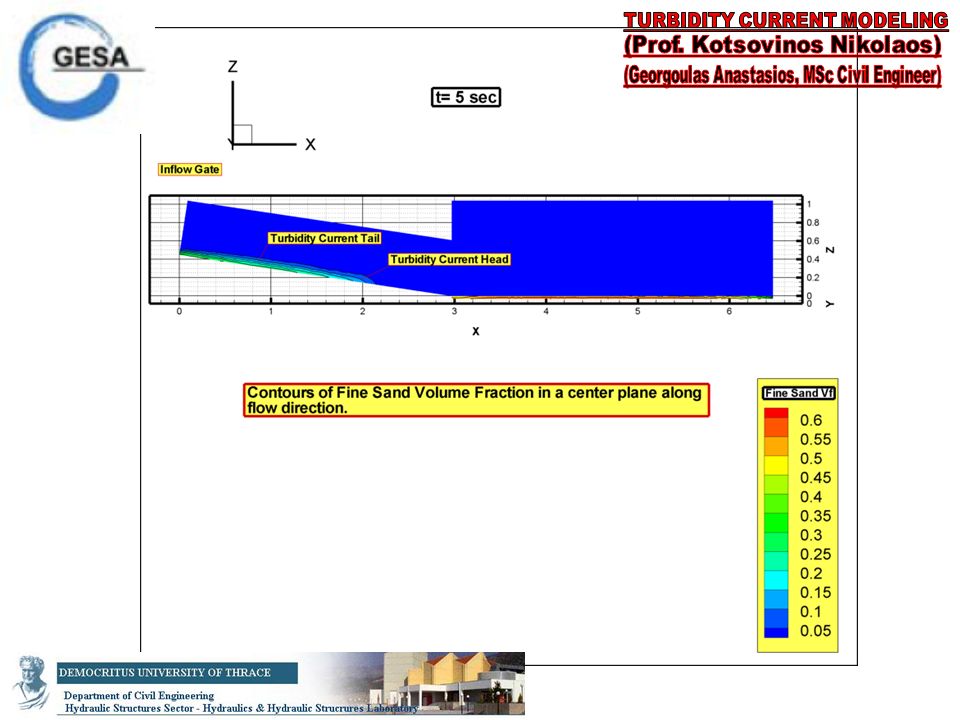
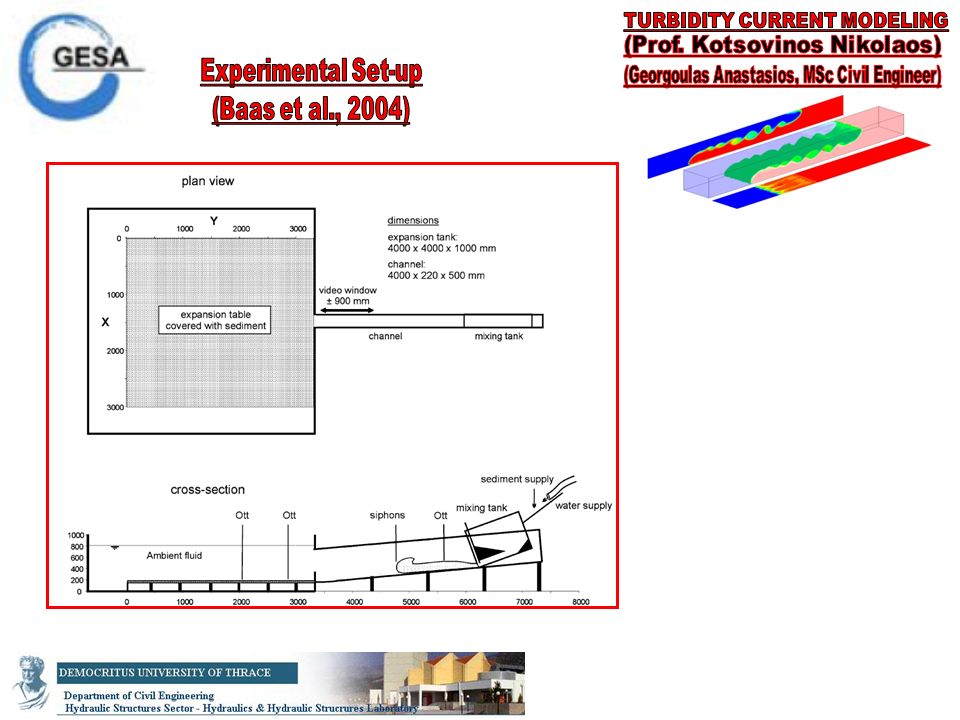
Validation of Turbidity Current Numerical model simulating the physical experiment of BAAS et al. (2004) and comparing the results of the experimental and numerical runs. Experimental Run & Numerical Run, Initial conditions: -Mean Grain Size = 0.235 mm -Initial Sediment Concentration = 35% by Vol. -Channel Slope Angle = 8.6° -Slope Type = Smooth -Inflow Velocity = 1.24 m/sec
 and comparing the results of the experimental and numerical runs. Experimental Run & Numerical Run, Initial conditions: -Mean Grain Size = mm -Initial Sediment Concentration = 35% by Vol. -Channel Slope Angle = 8.6° -Slope Type = Smooth -Inflow Velocity = 1.24 m/sec.")
31
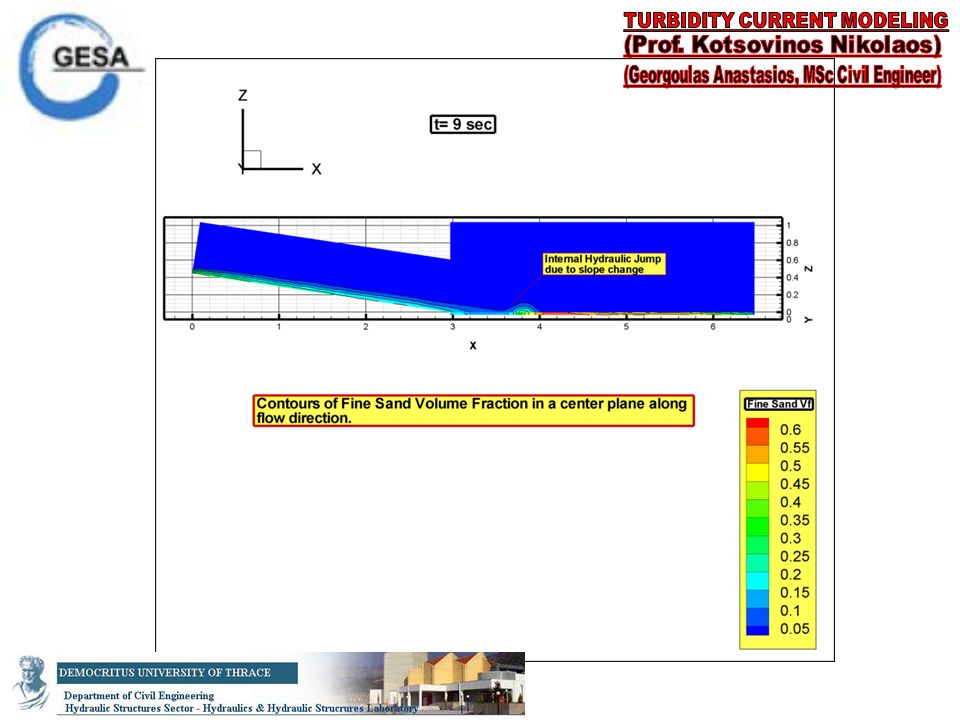
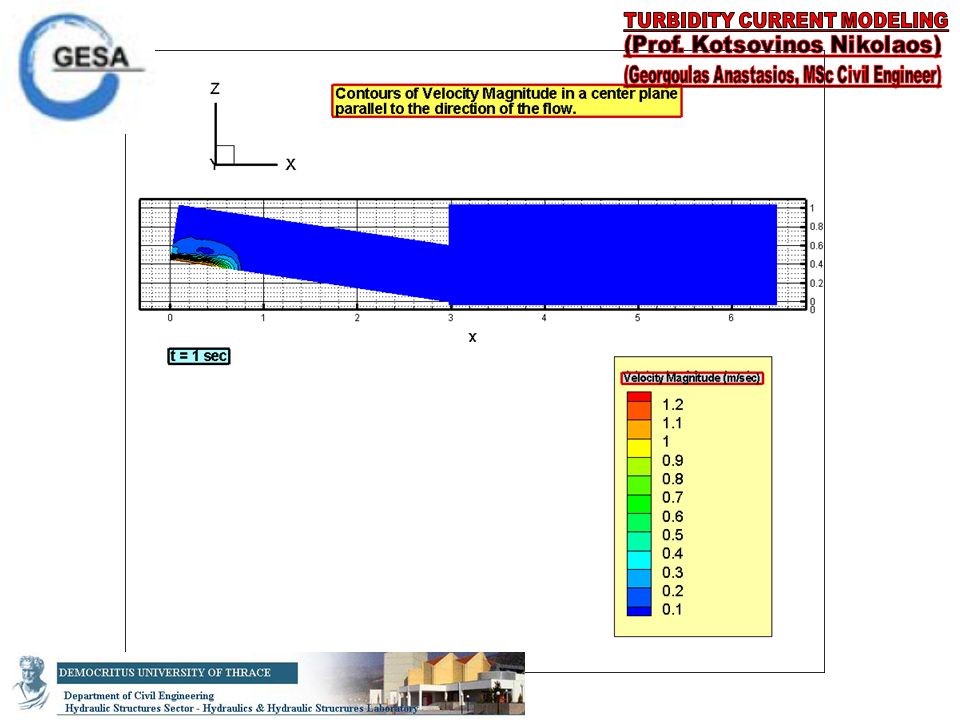
Experimental Run 3 (Baas et al.), main results: -Turbidity Current Head Velocity = 0.952 m/sec [1] -Spreading Angle of Fan = 28.5° [ 2] -3 sec after passage of head from position Ott1 Quasi-Steady flow established in the body of the turbidity current [3] -Internal Hydraulic Jump at the entrance to the expansion table [4] -Two layers developed. A dense bottom layer moving parallel to the channel bed and an upper dilute layer where mixing with ambient fluid takes place [5]
![Experimental Run 3 (Baas et al.), main results: -Turbidity Current Head Velocity = m/sec [1] -Spreading Angle of Fan = 28.5° [ 2] -3 sec after passage of head from position Ott1 Quasi-Steady flow established in the body of the turbidity current [3] -Internal Hydraulic Jump at the entrance to the expansion table [4] -Two layers developed.](http://images.slideplayer.com/26/8396929/slides/slide_31.jpg "A dense bottom layer moving parallel to the channel bed and an upper dilute layer where mixing with ambient fluid takes place [5].")
32
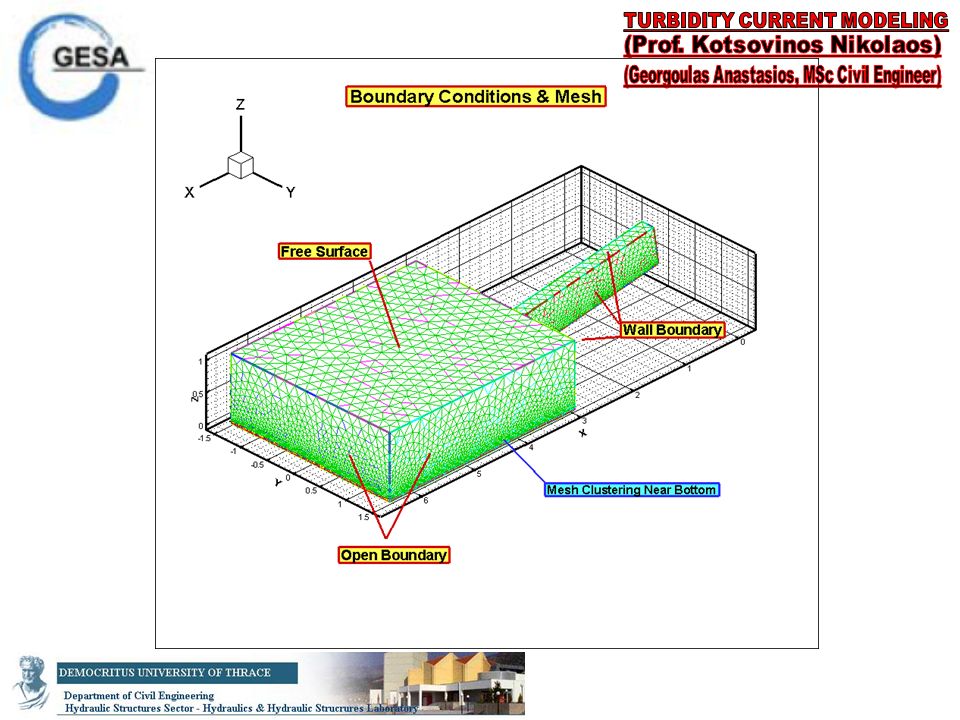
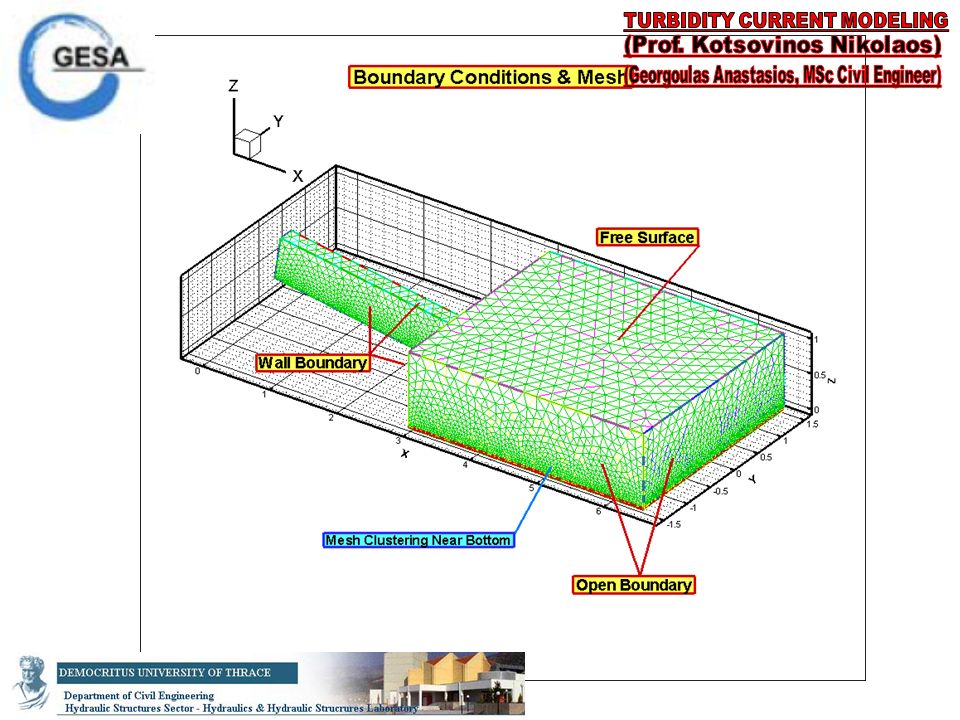
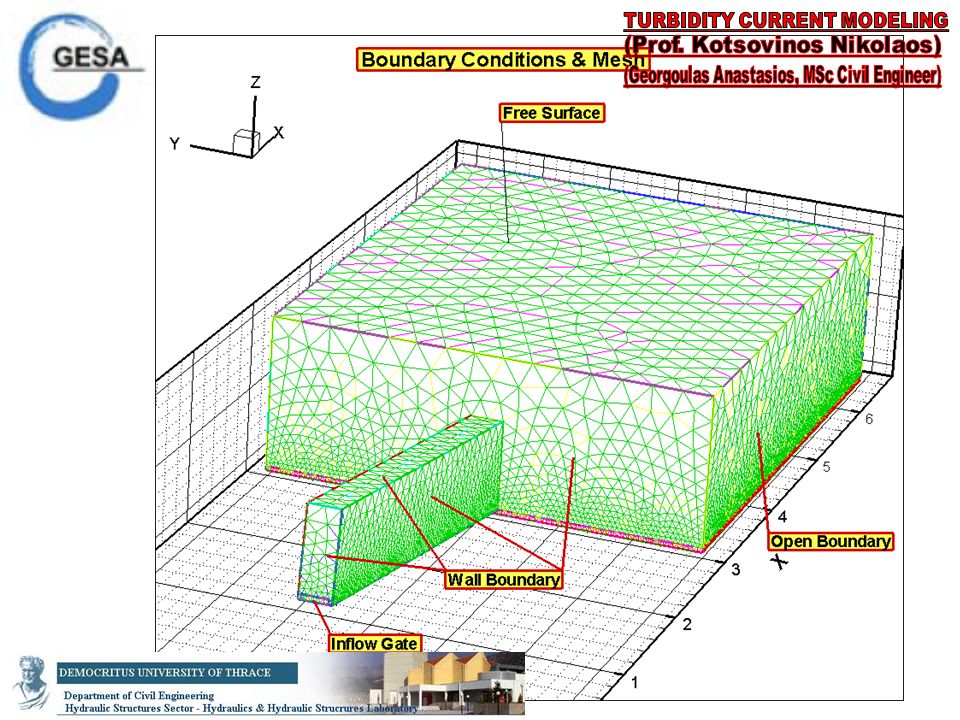
Numerical Model Geometry & Mesh

33
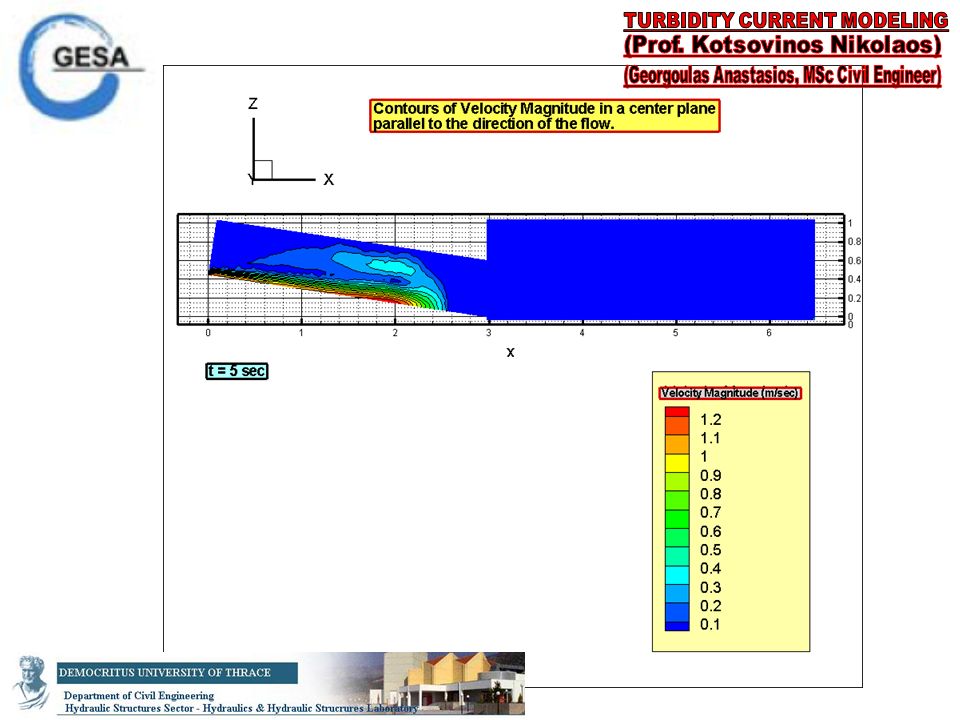
[1] Numerical Model Results
![[1] Numerical Model Results](http://images.slideplayer.com/26/8396929/slides/slide_33.jpg "[1] Numerical Model Results")
34
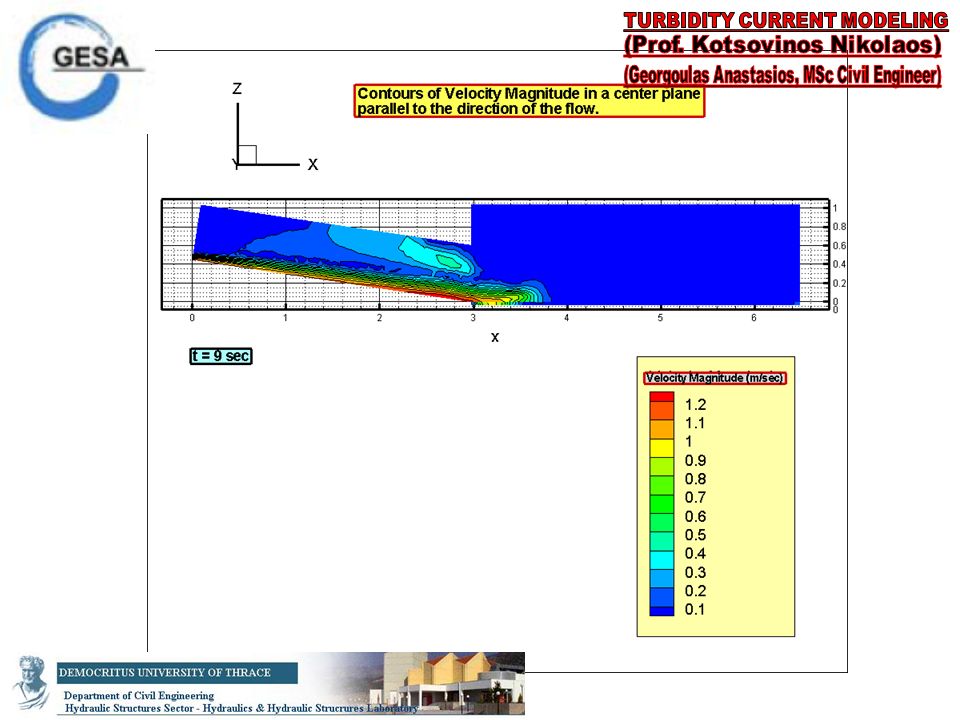
[2] Numerical Model Results
![[2] Numerical Model Results](http://images.slideplayer.com/26/8396929/slides/slide_34.jpg "[2] Numerical Model Results")
35
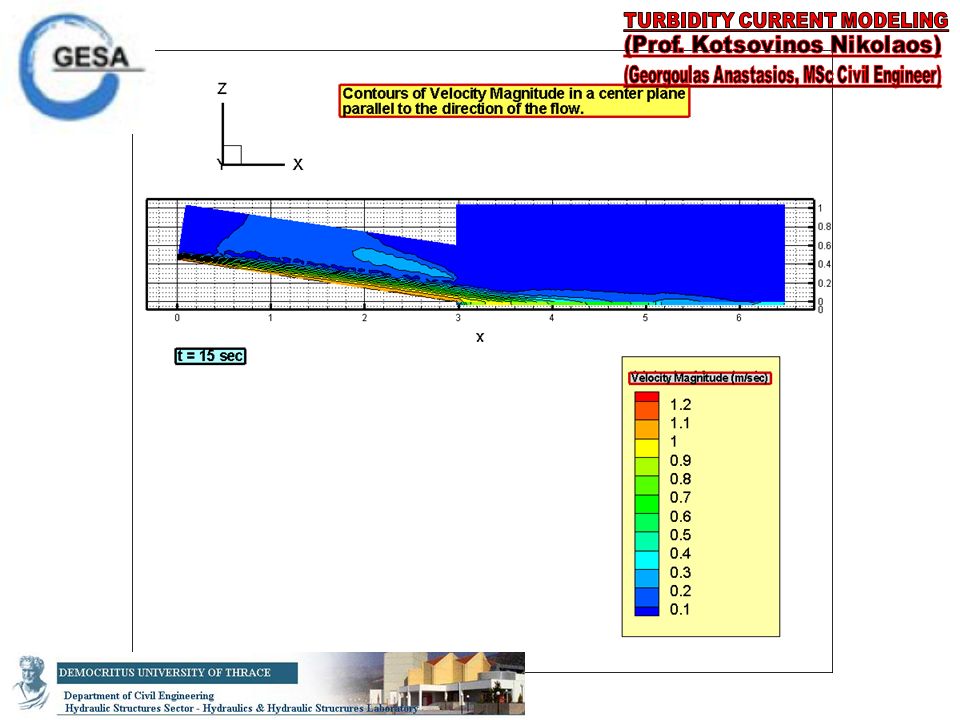
Numerical Model Results [3]
![Numerical Model Results [3]](http://images.slideplayer.com/26/8396929/slides/slide_35.jpg "Numerical Model Results [3]")
36
Numerical Model Results [4]
![Numerical Model Results [4]](http://images.slideplayer.com/26/8396929/slides/slide_36.jpg "Numerical Model Results [4]")
37
Numerical Model Results [5]
![Numerical Model Results [5]](http://images.slideplayer.com/26/8396929/slides/slide_37.jpg "Numerical Model Results [5]")
38
Comparing the experimental results (1,2,3,4,5) with the corresponding numerical results shown in previous figures (1,2,3,4,5) It is concluded that the numerical simulation predicts the Turbidity Current behavior accurate enough. Hence, the proposed numerical model can be applied to field scale situations in order to study the dynamics as well as the erosional and depositional characteristics of Turbidity Currents. Numerical Model Results

Similar presentations


 OCEAN/ESS 410 1.>")


