Download presentation
Presentation is loading. Please wait.

1
Municipal Solid Waste Generation, Recycling, and Disposal in the U.S. for 2006 U.S. EPA Office of Solid Waste November 2007

2
Waste Management Hierarchy Avoid Reduce Reuse Recycle Recover Dispose Most Desirable Least Desirable

3
Waste Generation Total Annual Waste Generation: 2.6 Billion Tons

4
Municipal Solid Waste Generation in 2006 251 Million Tons Paper 33. 9% Glass 5.3% Metals 7.6% Plastics 11.7% Other 3.3% Food Scraps 12.4% Yard Trimmings 12.9 % Wood 5.5% Rubber, leather, and textiles 7.3% EPA 2006 Facts and Figures

5
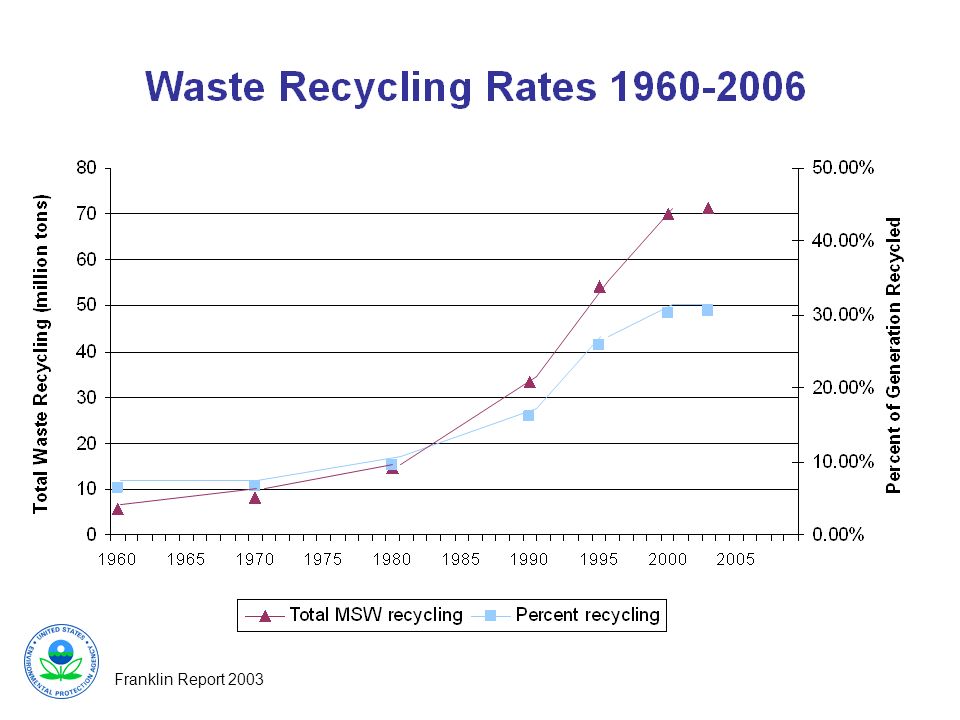
Franklin Report 2003

6
How Waste is Managed Land Disposal 55.4% Combustion 12.5% Recovery 32.5% Combustion 12.5% MSW Management in the U.S. Recovery 32.5% Land Disposal 55.% Franklin Report 2003

8
What is being recycled in 2006? 82 Million Tons of MSW 51.6 % of all paper 71% of Corrugated 62% of Yard Trimmings 99% of Automobile Batteries 45% of Aluminum Cans

9
Composting: Food and Yard Waste 67million tons of organic material generated in 2006 –31.3 million tons of food waste –32.4 million tons of yard trimmings 62% of yard trimmings was composted, 2% of food waste composted

10
Franklin Report 2003

11
Combustion 31.4 million tons (12.5%) of the total wastes generated in 2006 were combusted
 of the total wastes generated in 2006 were combusted")
12
Recycling Goals for the U.S. 1980 9.6% 2000 30% Goal: By 2008 Reach 35% Goal: By 2011 Reach 40%

13
Benefits of Waste Prevention and Recycling Greenhouse gas prevention: Current national recycling rate of 32% reduces ghg emissions by 49.7 million tons of carbon equivalent – this is the same reduction you would get by taking 39.4million cars off the road for a year. Provides feedstock for industry: 42% aluminum. 38% paper feedstock, 67% steel Total value of materials=$3.9 billion. Energy Savings: Recycling saves the equivalent amount of energy as found in 11.9 billion gallons of gasoline

14
Energy-Waste Connection Energy Savings per ton of material recycled

15
Average National Revenues for Recycled Commodities June 2000 through August 2006

16
Future Directions

17
U.S. 2020 Vision Goals 1.Reduce wastes and increase the efficient sustainable use of resources. 2.Prevent exposures to humans and ecosystems from the use of hazardous chemicals. 3.Manage wastes and clean up chemical releases in a safe, environmentally sound manner.

18
Benefits to Fulfilling the Vision Human Health –Risk reductions –Improved living Ecosystem Protection –Removing hazards –Restoring land Material and Energy Savings –Sustainability –Conservation

Similar presentations