Download presentation
Presentation is loading. Please wait.

1
Index of Manufactured Exports Methodology Review 2012 Ratio Estimation methodology update Chainlinking and benchmarking to GCS / I-O (and SNAP) SIC 2007
 SIC 2007")
2
IME Data Sources ONS Monthly Business Survey (MBS) –Sample size ~750 –turnover, export sales, employment, (also orders, some production volumes) –Producer Prices (exc VAT, Excise Duty) –Stratified sample by industry and employment –Census of all companies >250 emp; sample in several lower employment bands
 –Sample size ~750 –turnover, export sales, employment, (also orders, some production volumes) –Producer Prices (exc VAT, Excise Duty) –Stratified sample by industry and employment –Census of all companies >250 emp; sample in several lower employment bands")
3
IME Data Sources Scottish MBS Top-Up Inquiry –Sample size ~100 Oil Refinery Volumes (DECC) –Consistent with GDP A few direct collections from industry HMRC Scotch Whisky Values/Volumes
 –Consistent with GDP A few direct collections from industry HMRC Scotch Whisky Values/Volumes")
4
IME Methodology Estimate gross turnover & export sales from sample –Ratio Estimation –Stratify by industry and employment Deflate using UK EPPI Seasonal Adjustment Aggregate to broad industry groups and total exports real terms

5
Traditional IME Method Export sales are sub-total of turnover –Note that IME has become bi-product of IoP Gross Exports = sample exports sample turnover x Gross Turnover ∑ I T ∑ I S E T = ∑ E S x

7
Traditional IME Method But!.... IDBR turnover highly associated with true turnover, but less well associated with proportion of sales to export Sample dependant bias –MBS census changed from 150 to 250 –Falling sample size

9
New IME Method Global Connections Survey – Export % estimates are made for industry groups… –…and attributed to every company in the population Annual, surveyed or modelled, lagged… –Equivalent to IDBR turnover! Alignment between IME and GCS?

10
New IME Method Match Quarterly IDBR extract series (population) to GCS ‘grossed exports’ file iexport = iturnov x gcs export % Ratio estimates –Auxiliary variable is iexport instead of iturnov ∑ Iexp T ∑ Iexp S E T = ∑ E S x
 to GCS ‘grossed exports’ file iexport = iturnov x gcs export % Ratio estimates –Auxiliary variable is iexport instead of iturnov ∑ Iexp T ∑ Iexp S E T = ∑ E S x")
11
New Results

13
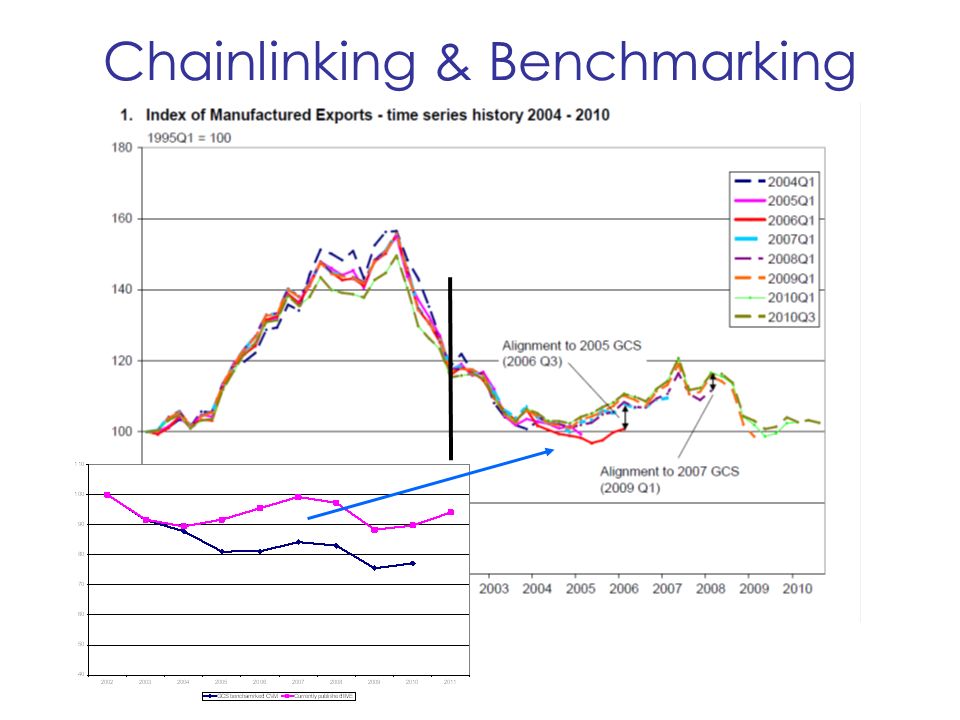
Chainlinking & Benchmarking IME is laspeyres fixed weight volume index –Price Index base year is 2005 Self weighted by export values –Revisions due to SIC 2007, new ratio estimation methodology, etc. –‘GCS alignment’ edits and improved chemicals data

14
Annual Export Values

15
2002 2005 2010 Export Values by Industry

16
Chainlinking & Benchmarking Laspeyres volume indices not ideal in years distant to weights –Relative price changes Should move to a Chained Volume Measure (CVM) Use weights from GCS (?) –Benchmark industry level series to provide coherent results
 Use weights from GCS ( ) –Benchmark industry level series to provide coherent results")
18
Chainlinking & Benchmarking Laspeyres volume indices not ideal in years distant to weights –Relative price changes Should move to a Chained Volume Measure (CVM) Use weights from GCS (?) –Benchmark industry level series to provide coherent results
 Use weights from GCS ( ) –Benchmark industry level series to provide coherent results")
20
Chainlinking & Benchmarking

22
SIC 2007 Introduce updates and publish results on SIC 2007 industries Industrial groupings –Food & Drink Food Drink –Textiles, Leather & Clothing –Chemical, Refined Petroleum & Pharmaceutical Products –Metals & Metal Products –E & IE –Machinery n.e.c. –Transport Equipment –Other Manufacturing & Repair Drop Engineering & Allied Industries? –Or include Metals & Metal Products? 2009 = 100 Chained volume measures –Current price values (in SNAP?)
.")
Similar presentations


 IN UGANDA By John Bonaventure Musoke Senior Statistician.>")

 measures the dollar value of all goods and services produced in the U.S. economy in.>")
>")


