Download presentation
Presentation is loading. Please wait.

1
Session 2 : The Downturn & Irish Business Richard McMahon Central Statistics Office

2
Outline Re-cap Overview of business statistics Structural & Thematic Business Statistics Short-term business indicators Construction indicators Industrial Production Retail Sales Other services International comparisons Other short-term CSO indicators

3
Re-cap - The Downturn

4
Re-cap GDP at constant market prices 2007 – €186.6bn 2008 – €180.0bn 2009 - €166.3bn 2010 – first 3 quarters €124.1bn (€165bn annualised approx) Fall approx. 13% ‘07 to ‘10 (approx. +1% EU-27) Approx. 21% drop on GNP Reductions mainly up to Q3 2009
 Approx. 21% drop on GNP Reductions mainly up to Q")
5
Re-cap Session 1: Effect on people Session 2: Effect on business Session 3: Overall effect on economy Session 4: Alternative view of effect on economy Session 5: Accessing CSO data

6
Background to business statistics Purpose Provide information on structure and performance of enterprises Measure trends in key economic characteristics Meet EU Regulations Input to compilation of other CSO statistics e.g. National Accounts, environmental accounts Key Users Irish and EU Policy makers Economic analysts Media Research community (controlled access microdata files provided subject to strict criteria) Key issues Confidentiality Response burden
 Key issues Confidentiality Response burden.")
7
Operation of enterprise based surveys

8
Structural & Thematic Business Statistics Structural Measures numbers of enterprises by economic sector, firm size, region P&L and balance sheet variables Productivity, competitiveness indicators Frequency : Annual – 2010 results in mid- 2012 Thematic

9
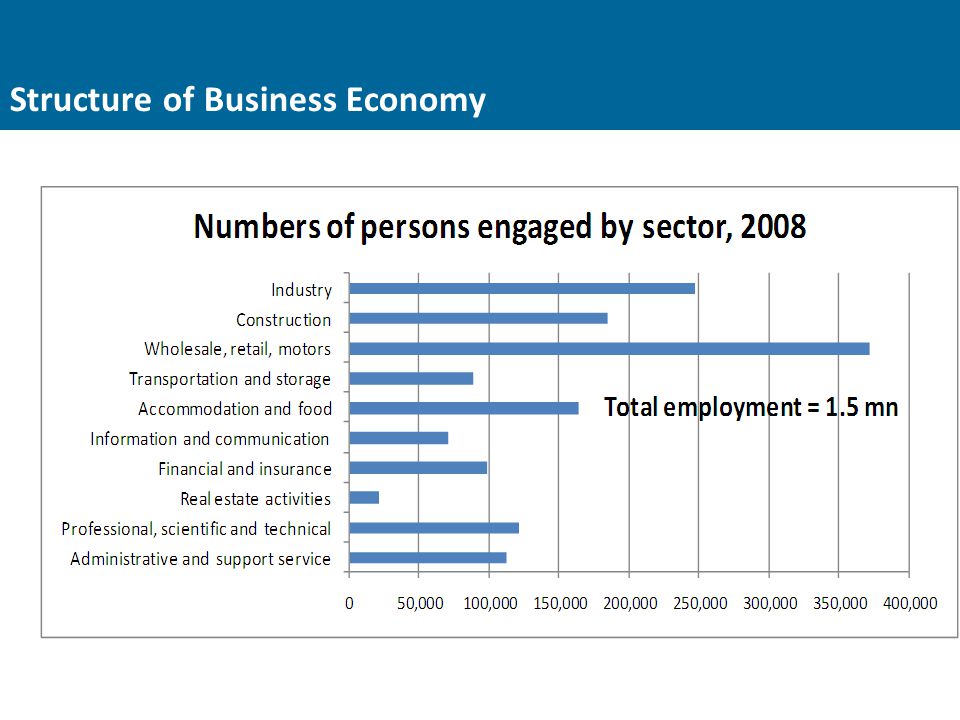
Structure of Business Economy

11
Ownership Structure of Business Economy, 2008

12
Sectoral Contribution to GDP

13
Short-term Indicators Timeliness Monthly within 40 days Quarterly within 70 - 90 days Indication of trend Results are expressed as Indices to base 2005=100 Principal Indicators Industry : Monthly Industrial Production Index Construction : Quarterly Survey of Construction, Planning permissions (actual) Services : Retail Sales Index, Monthly Services Index (Q2 2011 onwards)
 Services : Retail Sales Index, Monthly Services Index (Q onwards)")
14
Construction Indicators Planning Permissions (PP) PPs granted by local authorities Anticipate trends in construction activity Quarterly Production in Construction Survey Measures trends in the value and the volume of production in building and construction Indicator of change in value added Over 2,000 firms surveyed
 PPs granted by local authorities Anticipate trends in construction activity Quarterly Production in Construction Survey Measures trends in the value and the volume of production in building and construction Indicator of change in value added Over 2,000 firms surveyed")
15
Construction Indicators

16
Planning permissions

17
Construction output

18
Monthly Industrial Production Purpose Measure changes in value added at constant prices Methodology Collect physical quantities manufactured and then value at 2005 prices Or Collect value of good manufactured and deflate to 2005 prices Index is weighted by Gross Value Added Features Volatile Huge impact of multinationals on total results

19
Monthly Industrial Production Seasonally adjusted

20
Composition of Industrial sector Modern sector Pharmaceutical, ICT, medical instruments, electrical equipment Traditional Food & beverages, textiles, wood, paper, rubber, metal products, mining, energy etc..

21
Selected Modern industrial sectors Seasonally adjusted

22
Selected Traditional industrial sectors Seasonally adjusted

23
Retail Sales Index Purpose Monthly activity in the retail sector – value and volume Indicator for final domestic demand Survey 2,000 retailers (incl bars, motors and fuel) each month Collect monthly turnover Use Consumer Price sub-indices to deflate to 2005 prices
 each month Collect monthly turnover Use Consumer Price sub-indices to deflate to 2005 prices")
24
Retail Sales Index (incl motors, fuel and bars)
")
25
Contributors to Retail Sales Index Central Statistics Office, Ireland 25

26
Retail Sales Central Statistics Office, Ireland 26

27
Core Retail Sales Central Statistics Office, Ireland 27

28
Monthly Services Inquiry Gap in statistics on the services sector Real output of services Monthly survey Retail, bars, motors (existing) Other services (new) New Monthly Indicators Value Indices in 2011 Indicator of personal expenditure Indicator of value added Volume indices in 2012
 Other services (new) New Monthly Indicators Value Indices in 2011 Indicator of personal expenditure Indicator of value added Volume indices in 2012")
29
Monthly Services Inquiry Experimental

30
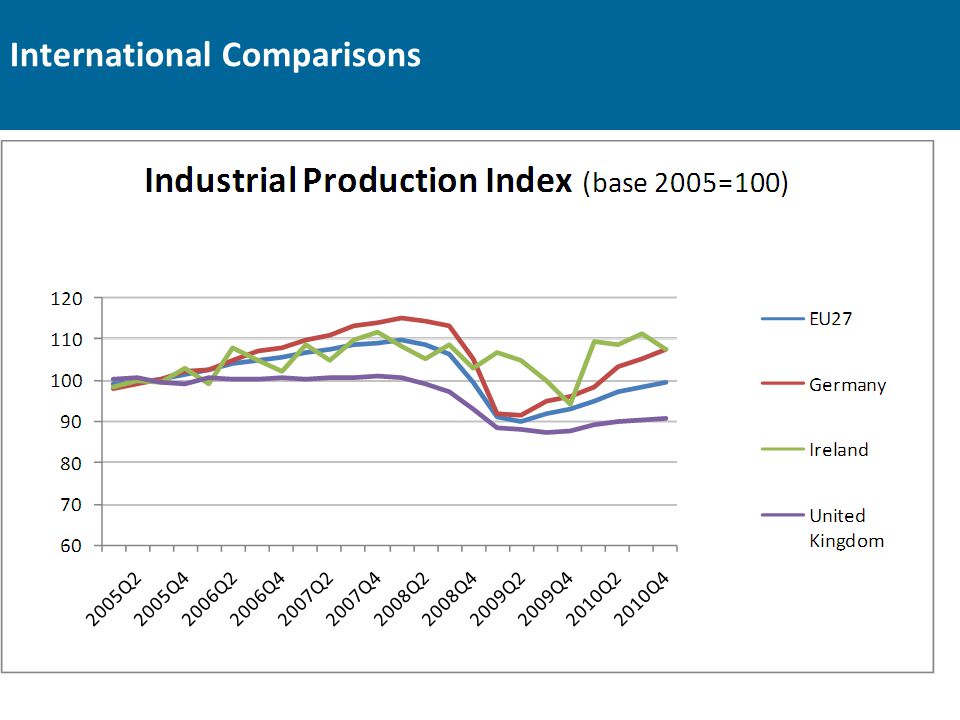
International Comparisons

33
Other indicators : Tourism

34
Other indicators : New Car Licensing

35
Wrap - up

Similar presentations


, Japan Frequency: Monthly Period Covered: Prior month Volatility:>")


