Download presentation
Presentation is loading. Please wait.

1
Apple Juice Nate Wolfe | Bo Renner

2
Category Snapshot TOTAL APPLE JUICE (JC,DRK-CAN,BTL) OZ. Total Consumption BehaviorScape Framework LifeStyle BehaviorStage Cosmopolitan Centers Affluent Suburban Spreads Comfortable Country Struggling Urban Cores Modest Working Towns Plain Rural Living Total Start-Up Families HHs with Young Children Only < 6 218226265220253261242 Small Scale Families Small HHs with Older Children 6+ 12610311715911584113 Younger Bustling Families Large HHs with Children (6+), HOH <40 249220236173241216221 Older Bustling Families Large HHs with Children (6+), HOH 40+ 210197177160166145177 Young Transitionals Any size HHs, No Children, < 35 77716468668772 Independent Singles 1 person HHs, No Children, 35-64 44314548393040 Senior Singles 1 person HHs, No Children, 65+ 5140313829 34 Established Couples 2+ person HHs, No Children, 35-54 73667698715872 Empty Nest Couples 2+ person HHs, No Children, 55-64 76706186696168 Senior Couples 2+ person HHs, No Children, 65+ 65675576685763 Total 1031091021059789100
, HOH < Older Bustling Families Large HHs with Children (6+), HOH Young Transitionals Any size HHs, No Children, < Independent Singles 1 person HHs, No Children, Senior Singles 1 person HHs, No Children, Established Couples 2+ person HHs, No Children, Empty Nest Couples 2+ person HHs, No Children, Senior Couples 2+ person HHs, No Children, Total")
3
Demographic Variables Musselman'sJuicy JuiceLanger'sMinute MaidPrivate Label Race of Head of Household% VolumeIndex% VolumeIndex% VolumeIndex% VolumeIndex% VolumeIndex White54.5%7959.7%8660.1%8765.1%9461.3%89 Black15.0%12512.9%10815.9%13311.0%9213.1%109 Hispanic22.9%18520.4%16415.3%12316.4%13219.0%154 Asian4.9%1154.8%1115.0%1175.7%1324.3%100 Other2.7%1262.3%1073.8%1731.9%872.3%105 Number of Persons 1 Person12.5%465.8%219.4%359.6%369.6%35 2 Persons22.7%7016.4%5121.3%6618.5%5720.9%65 3 Persons18.7%11622.9%14226.8%16622.9%14219.8%122 4 Persons22.6%17127.1%20520.0%15222.6%17125.2%191 5+ Persons23.5%21127.8%25022.5%20226.4%23824.5%220 Household Income Under $10,0005.5%704.9%6213.3%1685.3%664.8%60 $10,000 - $19,9996.5%569.9%8512.1%1045.7%4910.4%90 $20,000 - $29,9998.8%7811.4%1019.7%856.5%579.9%87 $30,000 - $39,9998.5%8110.4%999.5%908.0%769.2%87 $40,000 - $49,9999.8%1058.0%8710.0%1088.7%9310.3%111 $50,000 - $74,99920.1%11122.1%12222.7%12520.9%11522.0%121 $75,000 - $99,99913.7%11712.9%1099.6%8214.3%12213.1%112 $100,000 - $149,99914.7%12812.5%1098.1%7117.9%15611.9%105 $150,000 or More12.4%1547.9%984.9%6113.0%1618.4%104

4
Category Role Theory: Families, and in particular, upper-middle class, with children tend to be the most consistent consumers of apple juice. National Sales: $562 million – middle range

5
Category Role

6
Why Apple Juice? High number of different product offerings at multiple different locations. High competition among private label brands against traditional, well-established brands. Influx of various types of different juices to compete against the industry all together. E.g. Strawberry- Pineapple Juice, Kiwi-Melon Juice, etc.

7
Stores Audited Walmart – MLK Walmart – Mall Walmart Neighborhood – Weddington Harps – College Marvins Walgreens – W. MLK Walgreens – Township Walgreens – College Flash Mart – MLK Kum & Go - MLK

8
Retailers Audited Walmart on College had the largest assortment with 33% of SKUs available. Locations most popular among families carried the largest selection.

9
The Suppliers Coca Cola – Minute Maid Mott’s Nestle – Juicy Juice Musselman’s Walmart – Great Value Old Orchard Brands

10
The Suppliers Old Orchard – most dominant with six SKU’s at five different stores. Juicy Juice & Pepsi’s Oceanspray – very limited selection and higher price.

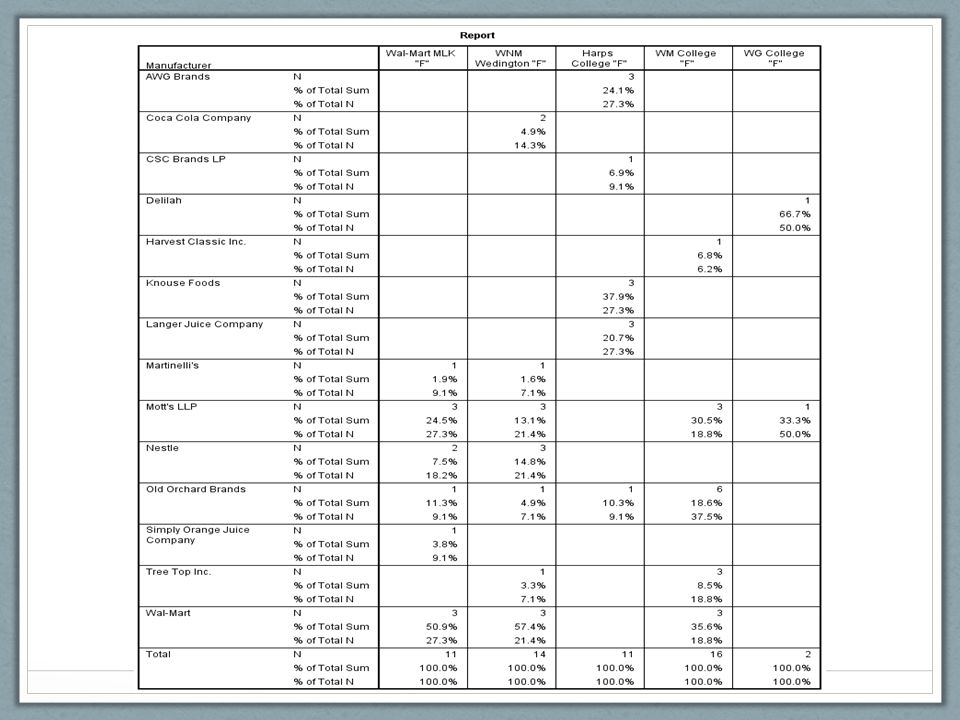
11
Gross Margin by Store and Manufacturer

12
Determining Gross Margins Minute Maid, on average, has the highest cost among major manufacturers, with $.10/ounce. Always Save, on average, had the lowest cost with $.015/ounce. The estimated private label cost per ounce is approximately $.02/ounce. There were slight adjustments made on differentiating between the major manufacturer and private label price per unit.

13
Circular Trade Area – Fayetteville Demography Harps 124Marvins 220Wal Mart 359Wal Mart 144 % HHsHHs Index% HHsHHs Index% HHsHHs Index% HHsHHs Index Race of Head of Household White80.2%11683.2%12176.8%11177.8%113 Black7.0%586.1%514.9%417.9%66 Hispanic4.8%384.0%3211.7%945.1%41 Asian4.6%1073.1%743.7%875.3%123 Other3.5%1543.5%1562.9%1284.0%178 Number of Persons 1 Person45.2%16742.3%15635.8%13248.0%177 2 Persons32.0%9933.1%10231.3%9731.1%96 3 Persons12.6%7812.8%7914.3%8911.4%70 4 Persons6.4%488.1%6210.1%776.3%48 5+ Persons3.8%343.7%338.4%763.2%29 Household Income Under $10,00022.5%29320.5%26812.5%16325.9%339 $10,000 - $19,99921.4%19120.1%18014.6%13123.4%209 $20,000 - $29,99912.8%11812.9%11813.3%12214.2%130 $30,000 - $39,99912.2%12112.0%11916.0%15811.9%118 $40,000 - $49,9997.1%797.9%888.0%897.5%84 $50,000 - $74,9999.6%539.2%5211.9%668.1%45 $75,000 - $99,9995.3%445.4%467.7%653.2%27 $100,000 - $149,9996.6%547.1%589.8%803.9%32 $150,000 or More2.6%294.8%536.3%701.9%21

14
Circular Trade Area – Fayetteville Age of Head of Household Age 18 - 2423.0%54721.4%50812.3%29127.4%651 Age 25 - 3431.6%21025.3%16725.0%16629.7%197 Age 35 - 4415.8%9114.3%8218.0%10413.8%80 Age 45 - 5410.6%5312.7%6314.8%7410.2%51 Age 55 - 649.9%5113.1%6813.8%719.8%51 Age 65 - 745.0%387.5%578.1%615.1%39 Age 75 or More4.0%375.8%548.1%753.9%37 Age and Presence of Children Age < 65.9%805.1%698.0%1085.2%71 Age 6 - 177.8%429.6%5215.8%858.1%44 Age < 6 & 6 - 174.6%704.0%616.6%1013.0%46 No Children81.7%12181.3%12069.6%10383.6%124 Housing Tenure Own25.2%3930.6%4742.3%6517.4%27 Rent74.8%21469.4%19857.7%16582.6%236 Education of Head of Household Not a High School Graduate7.0%548.7%6713.3%1029.1%70 High School Graduate16.0%6317.4%6821.4%8418.3%72 Some College39.1%13633.1%11529.0%10140.5%141 College Graduate21.3%11222.4%11820.8%10918.0%95 Post College Degree16.6%12118.4%13415.5%11214.1%103

16
52 WEEKS ENDING 12/29/07 ITEM $ (000)DOLLAR SHAREITEM BUYERS (000)ITEM PENETRATION ITEM $ PER ITEM BUYER ITEM TRIPS PER ITEM BUYER ITEM $ PER ITEM TRIP ITEM UNITS PER ITEM TRIP N=RAW BUYERSPURCHASE CYCLE (IN ELAPSED DAYS) % REPEAT BUYERS (% 2+ TIME BUYERS) LOYALTY (SHARE OF $ REQ.) % ITEM $ ON DEAL% DOLLARS WITH MANUFACTURER COUPON JUICY JUICE - FRUIT JUICE - APPLE - SHELF STBL TOTAL U.S. NA WEST SOUTH CENTRAL NA LANGERS - FRUIT JUICE - APPLE - SHELF STBL TOTAL U.S. 10,818.71.82,345.22.04.61.62.91.61,151.056.525.721.139.61.9 WEST SOUTH CENTRAL 787.81.4229.71.83.41.42.51.7118.059.819.016.339.33.2 MARTINELLI'S GOLD MEDAL - FRUIT JUICE - APPLE - SHELF STBL TOTAL U.S. 13,726.52.2786.70.717.52.18.21.2374.041.835.958.63.30.0 WEST SOUTH CENTRAL NA MINUTE MAID - FRUIT JUICE - APPLE - SHELF STBL TOTAL U.S. 27,839.54.54,383.83.86.41.83.51.42,136.049.028.830.720.53.4 WEST SOUTH CENTRAL 2,883.65.1503.83.95.71.83.11.2272.049.425.934.214.04.7 MOTT'S - FRUIT JUICE - APPLE - SHELF STBL TOTAL U.S. 86,828.314.111,391.09.87.62.33.41.55,606.049.039.438.226.42.4 WEST SOUTH CENTRAL 5,315.79.3996.67.75.31.92.91.4574.047.337.032.117.42.7 MOTT'S ORGANICS - FRUIT JUICE - APPLE - SHELF STBL TOTAL U.S. 659.60.1137.90.14.81.72.81.482.042.727.531.26.86.6 WEST SOUTH CENTRAL NA MUSSELMAN'S - FRUIT JUICE - APPLE - SHELF STBL TOTAL U.S. 2,366.60.4479.60.44.91.63.01.4301.047.921.623.030.70.1 WEST SOUTH CENTRAL NA NESTLE JUICY JUICE - FRUIT JUICE - APPLE - SHELF STBL TOTAL U.S. 43,445.17.15,811.55.07.52.23.41.42,753.048.140.237.016.23.8 WEST SOUTH CENTRAL 2,400.34.2419.03.25.71.93.01.4220.045.241.532.115.25.9 OLD ORCHARD - FRUIT JUICE - APPLE - SHELF STBL TOTAL U.S. 20,272.33.34,384.33.84.61.92.41.62,454.050.332.224.129.70.9 WEST SOUTH CENTRAL 2,294.34.0506.63.94.52.1 1.5279.042.335.828.519.00.7 OLD ORCHARD ORGANICS - FRUIT JUICE - APPLE - SHELF STBL TOTAL U.S. 951.00.2138.10.16.92.23.21.285.031.033.323.717.50.6 WEST SOUTH CENTRAL NA

17
Picture.

18
Private Label Share “Good losers? Snacks and confectionary Cosmetics Baby food Alcoholic beverages “Success!” Paper, plastic, and wipes Refrigerated food Frozen food Shelf stable juices Bad winners? – no one but ourselves to blame. Pet food Healthcare Diapers and feminine hygiene “Bad stuff” – why? Home care Nonalcoholic beverages Personal care Price gap with manufacturer brands High>30% Low<30% Private label share Low <12%High > 12%

19
Questions?

Similar presentations