Download presentation
Presentation is loading. Please wait.

1
Read page 305 in Miller

2
Three Major River Basins in the Middle East

4
Water Resources Chapter 14

5
Remember the Hydrologic or water cycle. Where does new water come from?

6
Freshwater Is an Irreplaceable Resource That We Are Managing Poorly (1) Why is water so important? Earth as a watery world: 71% Freshwater availability: 0.024% Poorly managed resource Hydrologic cycle Water pollution

7
Girl Carrying Well Water over Dried Out Earth during a Severe Drought in India

8
We Get Freshwater from Groundwater and Surface Water (2) Surface Water ◦ Watershed or (drainage) basin THE LAND FROM WHICH SURFACE WATER DRAIN INTO A RIVER,LAKE OR WETLAND
 Surface Water ◦ Watershed or (drainage) basin THE LAND FROM WHICH SURFACE WATER DRAIN INTO A RIVER,LAKE OR WETLAND")
9
Major NC river drainage basins

10
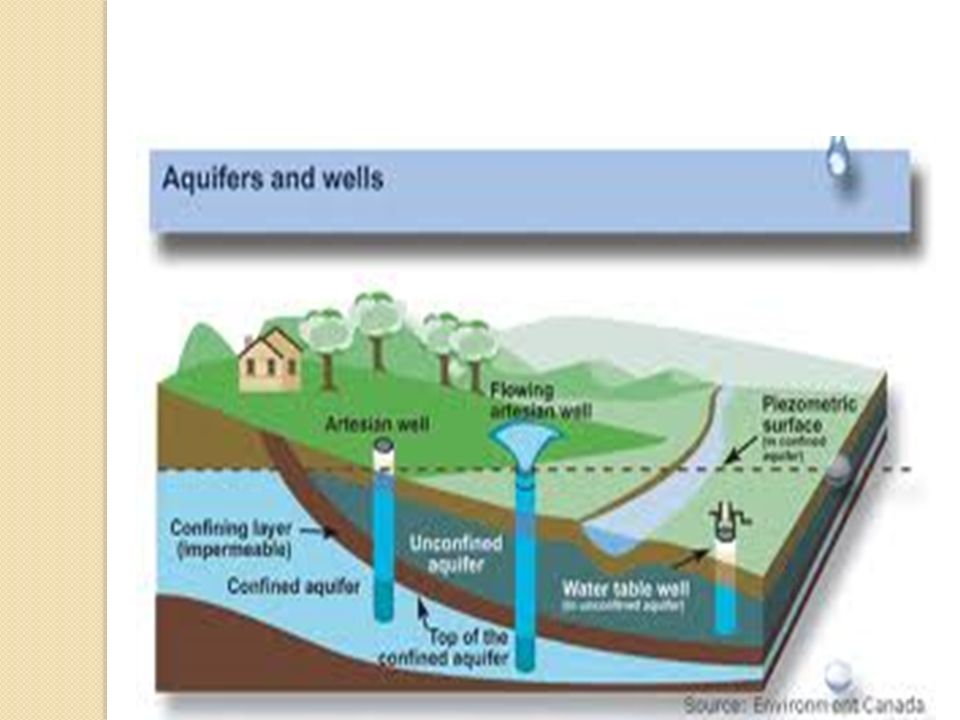
Fig. 13-3, p. 316 Unconfined Aquifer Recharge Area Precipitation Evaporation and transpiration Evaporation Confined Recharge Area Runoff Flowing artesian well Well requiring a pump Stream Infiltration Water table Lake Infiltration Unconfined aquifer Less permeable material such as clay Confined aquifer Confining impermeable rock layer

11
We Use a Large and Growing Portion of the World’s Reliable Runoff The largest use of surface water runoff is for????? 1/3 runoff usable ◦ Domestic: 10% ◦ Agriculture: 70% ◦ Industrial use: 20% Fred Pearce, author of When the Rivers Run Dry

12
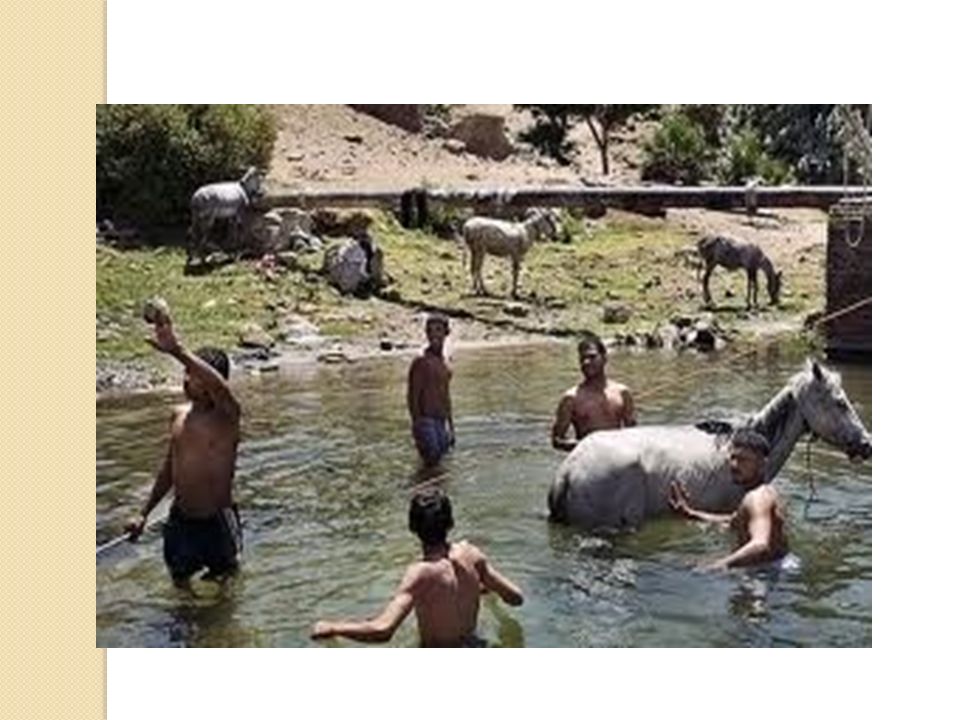
GROUND WATER AWARD WINNING PICTURE WITH INFILTRATION ◦ PERCOLATION ◦ WATER TABLE ◦ AQUIFER ◦ RECHARGE

14
Fig. 13-4a, p. 317

15
Fig. 13-4b, p. 317 Shortage Acute shortage Adequate supply Metropolitan regions with population greater than 1 million

16
Fig. 13-5, p. 318 Substantial conflict potential Highly likely conflict potential Unmet rural water needs Moderate conflict potential Washington Oregon Montana North Dakota Idaho South Dakota Wyoming Nevada Nebraska Utah Colorado Kansas California Oklahoma New Mexico Texas Arizona

17
Natural Capital Degradation: Stress on the World’s Major River Basins

18
Long-Term Severe Drought Is Increasing Causes ◦ Extended period of below-normal rainfall ◦ Diminished groundwater Harmful environmental effects ◦ Dries out soils ◦ Reduces stream flows ◦ Decreases tree growth and biomass ◦ Lowers net primary productivity and crop yields ◦ Shift in biomes

20
Disadvantages of growing corn to make ethanol. Decreasing water supplies caused by-------------- Aquifer depletion caused by ----------- Increase in pollution of streams and aquifers caused by ----------- The price of corn for human and animal consumption is likely to ____________ Thus the price of a ribeye is likely to________________

21
Causative organisms of dysentery Normal route of infection is fecal--- oral

22
The Clean Water Act serves to: regulate the discharge of pollutants into U.S. waterways attain water quality levels that make these waterways safe to fish and/or swim in restore and maintain the chemical, physical, and biological integrity of the nation’s water set water quality standards to limit pollutants require states and tribes to complete an assessment of all state rivers impacted, or potentially impacted, by non-point pollution (Section 319) reduce polluted runoff from urban areas and animal feeding operations (Section 319) provide enforcement mechanisms (e.g. civil actions/criminal penalties) to ensure compi lance develop management plans to address problems establish ongoing monitoring of local waterways require discharge permits for effluent emissions provide financial assistance to fund improvements/education/training prevent habitat destruction
 reduce polluted runoff from urban areas and animal feeding operations (Section 319) provide enforcement mechanisms (e.g. civil actions/criminal penalties) to ensure compi lance develop management plans to address problems establish ongoing monitoring of local waterways require discharge permits for effluent emissions provide financial assistance to fund improvements/education/training prevent habitat destruction.")
23
Safe Drinking Water Act (EPA enforces) pH 6.5-8.5 Lead Copper Coliform bacteria Turbidity
 pH Lead Copper Coliform bacteria Turbidity")
24
Boil, add chlorine or iodine

26
Test for E. Coli It is hard to test for all of the above organisms, why test for E coli? Escherichia coli

27
What we test for in water. Phosphates (runoff source could be detergents or fertilizers, animal manure) Nitrates (runoff from fertilizers, manure) Turbidity (the cloudiness of water OR the clarity of water) Coliform bacteria Temperature ??
 Nitrates (runoff from fertilizers, manure) Turbidity (the cloudiness of water OR the clarity of water) Coliform bacteria Temperature .")
28
Indicator species for in aquatic ecosystems What is an indicator species? Species that serve as early warning of damage to a community or ecosystem.

29
Indicator species Pollution sensative Caddisfly larvae Helgrammite Mayfly nymphs Trout Gilled snails Pollution tolerant Leeches Blackfly larvae Catfish Carp Midge larvae

30
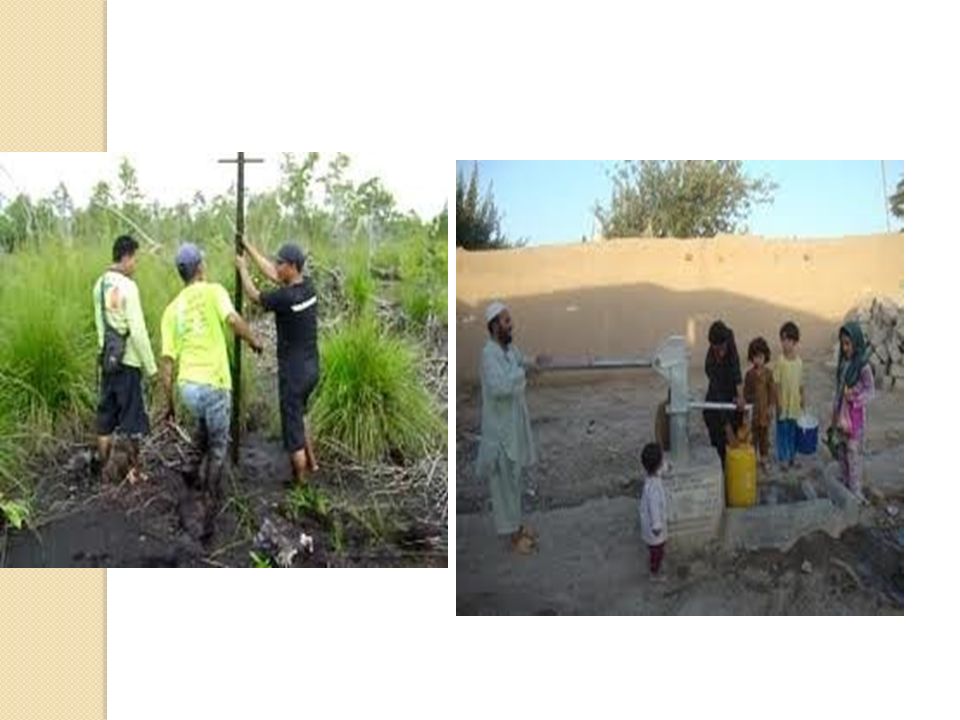
Water Tables Fall When Groundwater Is Withdrawn Faster Than It Is Replenished India, China, and the United States ◦ Three largest grain producers ◦ Overpumping aquifers for irrigation of crops Recharge rate: India and China ◦ Small farmers drilling tubewells WHAT IS A TUBEWELL ◦ Effect on water table Saudi Arabia ◦ Aquifer depletion and irrigation

32
Fig. 13-7, p. 321 TRADE-OFFS Withdrawing Groundwater AdvantagesDisadvantages Useful for drinking and irrigation Aquifer depletion from overpumping Available year-round Sinking of land (subsidence) from overpumping Exists almost everywhere Aquifers polluted for decades or centuries Renewable if not overpumped or contaminated Saltwater intrusion into drinking water supplies near coastal areas No evaporation losses Reduced water flows into surface waters Cheaper to extract than most surface waters Increased cost and contamination from deeper wells
 from overpumping Exists almost everywhere Aquifers polluted for decades or centuries Renewable if not overpumped or contaminated Saltwater intrusion into drinking water supplies near coastal areas No evaporation losses Reduced water flows into surface waters Cheaper to extract than most surface waters Increased cost and contamination from deeper wells.")
33
Land subsidence in farm field

34
Show ALL of your work and steps of calculations, even if they are so simple you think they are implied. Show ALL of your work and steps of calculations, even if they are so simple you think they are implied. NO WORK – NO CREDIT !

35
Practice. Be sure to know how to convert numbers to percentages and percent change. 1. Example: If 200 households in a town of 10000 use well water, what percent does this represent? 2. Example: The water rates for outside the town limits in Forest City is a minimum charge of $27.15 per month. After that it is $6.25 per 1000 gallons. What would be the total water bill for a house that used 5500 gallons during the month of July?

36
1. Name three factors we have studied this year that can cause subsidence. 2. This river empties into the Lake Mead and Lake Powell reservoirs. 3 Process whereby aquifers are replenished naturally by precipitation that percolates through soil and rock. 4. The land from which surface water drains into a river, lake or stream.

37
5. (2 points) Name of huge midwest aquifer AND the name spelled correctly is equal to two points
 Name of huge midwest aquifer AND the name spelled correctly is equal to two points")
38
Water Conservation Review 6 Use __ ___ ___ ___ irrigation. 7 Take ___ ___ ____ ___ ____ showers 8 ___ ___ ___ water leaks 9 Water ___ ___ ___ ___ ___ ___ Toilets 10 Restricted __ ___ ___ ___ shower heads 11__ __ __ __ __ loading __ __ __ __ __ __

39
12. DO Saturation at varying temperatures of water.

40
13-14 Distillation to remove salt from sea water is practiced on a large scale basis in the mid east. CITE TWO DISADVANTAGES OF REMOVING SALT FROM SEA WATER.

41
Fig. 13-10, p. 323 WYOMING SOUTH DAKOTA NEBRASKA COLORADO KANSAS OKLAHOMA NEW MEXICO Miles 0 100 TEXAS Saturated thickness of Ogallala Aquifer Less than 61 meters (200 ft.) 61–183 meters (200–600 ft.) More than 183 meters (600 ft.) (as much as 370 meters or 1,200 ft. in places) 0 160 Kilometers
 61–183 meters (200–600 ft.) More than 183 meters (600 ft.) (as much as 370 meters or 1,200 ft. in places) Kilometers.")
42
Case Study: Aquifer Depletion in the United States Ogallala aquifer: largest known aquifer ◦ Irrigates the Great Plains ◦ Water table lowered more than 30m ◦ Cost of high pumping has eliminated some of the farmers

43
Natural Capital Degradation: Areas of Greatest Aquifer Depletion in the U.S.

44
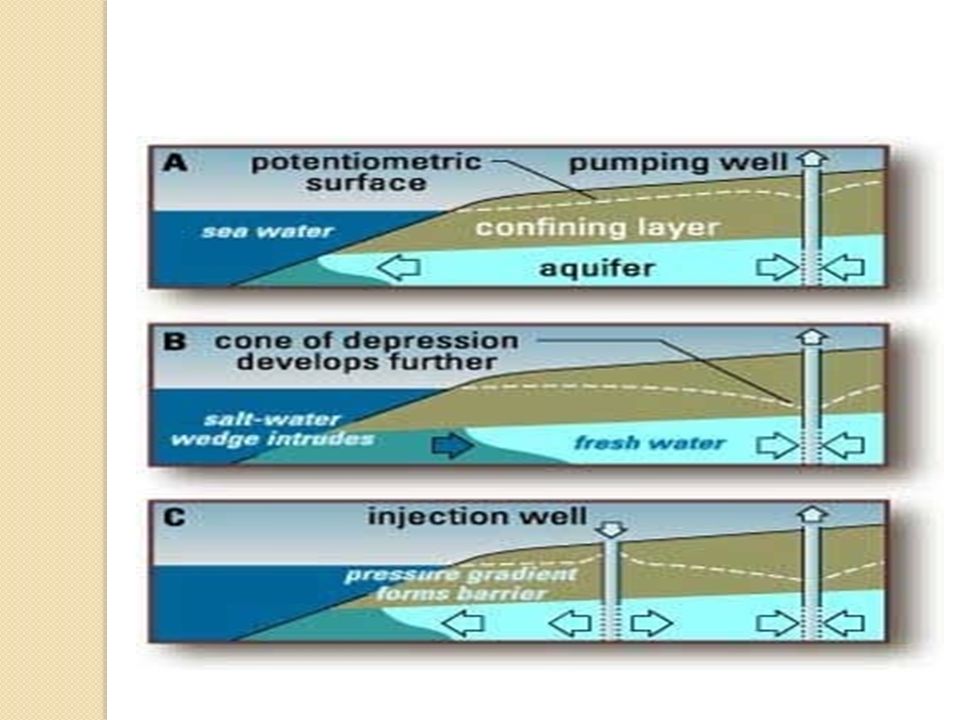
Groundwater Overpumping Has Other Harmful Effects (2) Salt water intrusion Groundwater overdrafts near coastal regions ◦ Contamination of the groundwater with saltwater Undrinkable and unusable for irrigation
 Salt water intrusion Groundwater overdrafts near coastal regions ◦ Contamination of the groundwater with saltwater Undrinkable and unusable for irrigation")
47
This are is called the ____ ____?

48
Some Areas Get Too Much Water from Flooding There are positive aspects for living in or near a flood plain. ◦ Highly productive wetlands/ fish and other game ◦ Provide natural flood and erosion control ◦ Maintain high water quality ◦ Recharge groundwater ◦ Fertile soils ◦ Nearby rivers for use and recreation ◦ Flatlands for urbanization and farming

49
St Louis (Mississippi River)
")
51
Water Diversions Rivulets Rill erosion Gully erosion

52
Song of the South

53
“The South is gonna change” Scene from movie

54
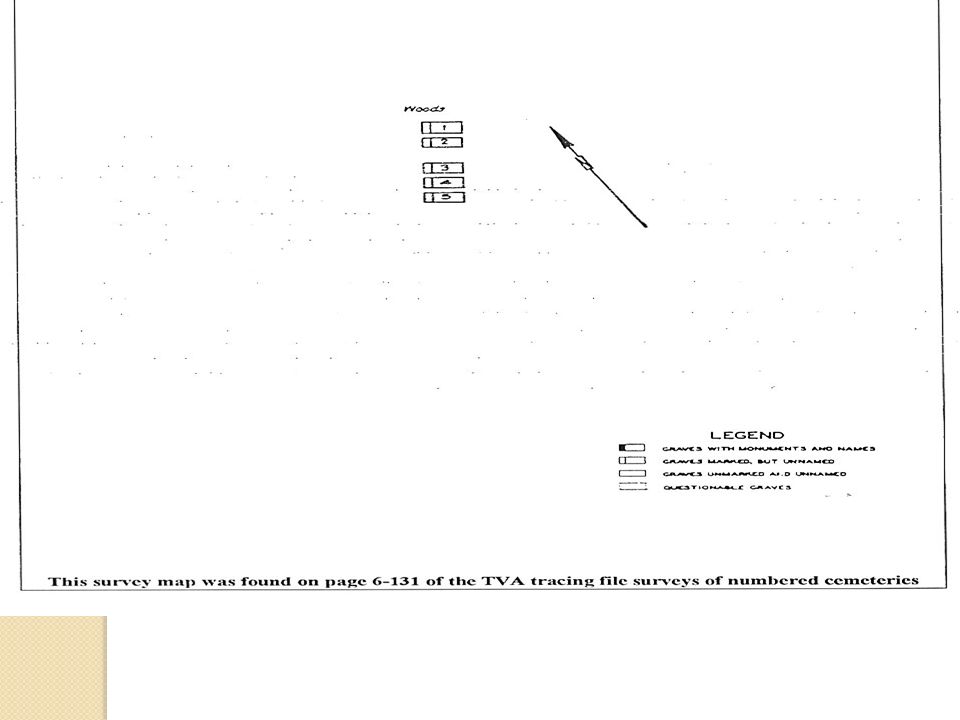
TVA Reseviors fossil plants nuclear plants

55
*First and last names *Birth and death dates *TVA project name *State and county *Original cemetery and grave number *Year the grave was relocated *New cemetery name, number, and grave number.

57
Toccoa Falls Ga. Dam Failure 1977 1:30 am

59
37 people died. View is looking upstream through dam breach

60
Hoover dam and lake mead

61
Large Dams and Reservoirs Have Advantages and Disadvantages (1) Main goals of a dam and reservoir system supplies drinking water. Downstream flooding is reduced Generate cheap electricity Supply irrigation water to dry areas Recreation (reservoirs)
.")
62
Large Dams and Reservoirs Have Disadvantages Disadvantages ◦ Displaces people (TVA) ◦ Flooded regions destroys forests and croplands ◦ Migration and spawning of fish is disrupted ◦ Structural failure of Dam ◦ Sediment builds up behind the dam and is not allowed to enrich the river below the dam
 ◦ Flooded regions destroys forests and croplands ◦ Migration and spawning of fish is disrupted ◦ Structural failure of Dam ◦ Sediment builds up behind the dam and is not allowed to enrich the river below the dam")
63
The Ataturk Dam Project in Eastern Turkey

64
The Colorado River Basin

65
The California Water Project and the Central Arizona Project

66
Fig. 13-17, p. 330 CALIFORNIA Shasta Lake NEVADA Sacramento River UTAH North Bay Aqueduct Feather River Lake Tahoe San Francisco Sacramento South Bay Aqueduct Hoover Dam and Reservoir (Lake Mead) Los Angeles Aqueduct Colorado River California Aqueduct Colorado River Aqueduct Central Arizona Project ARIZONA Fresno Santa Barbara Los Angeles San Diego Salton Sea Phoenix Tucson MEXICO San Luis Dam and Reservoir San Joaquin Valley Oroville Dam and Reservoir
 Los Angeles Aqueduct Colorado River California Aqueduct Colorado River Aqueduct Central Arizona Project ARIZONA Fresno Santa Barbara Los Angeles San Diego Salton Sea Phoenix Tucson MEXICO San Luis Dam and Reservoir San Joaquin Valley Oroville Dam and Reservoir.")
67
Case Study: The Aral Sea Disaster (1) Large-scale water transfers in dry central Asia Salinity Wetland destruction and wildlife Fish extinctions and fishing
 Large-scale water transfers in dry central Asia Salinity Wetland destruction and wildlife Fish extinctions and fishing")
68
Distillation basic design

69
Removing Salt from Seawater Seems Promising but Is Costly (1) Desalination ◦ Distillation ◦ Reverse osmosis, microfiltration 15,000 plants in 125 countries ◦ Saudi Arabia: highest number
 Desalination ◦ Distillation ◦ Reverse osmosis, microfiltration 15,000 plants in 125 countries ◦ Saudi Arabia: highest number")
70
Removing Salt from Seawater Seems Promising but Is Costly (2) Problems ◦ High cost and energy footprint ◦ Keeps down algal growth and kills many marine organisms ◦ Large quantity of brine (salty) wastes Future economics
 Problems ◦ High cost and energy footprint ◦ Keeps down algal growth and kills many marine organisms ◦ Large quantity of brine (salty) wastes Future economics")
71
Read case study on The Aral Sea p. 321-22

72
Fig. 13-18a, p. 331 Stepped Art 19762006

73
Ship Stranded in Desert Formed by Shrinkage of the Aral Sea

74
Anthrax Island

75
Outhouse or privy

78
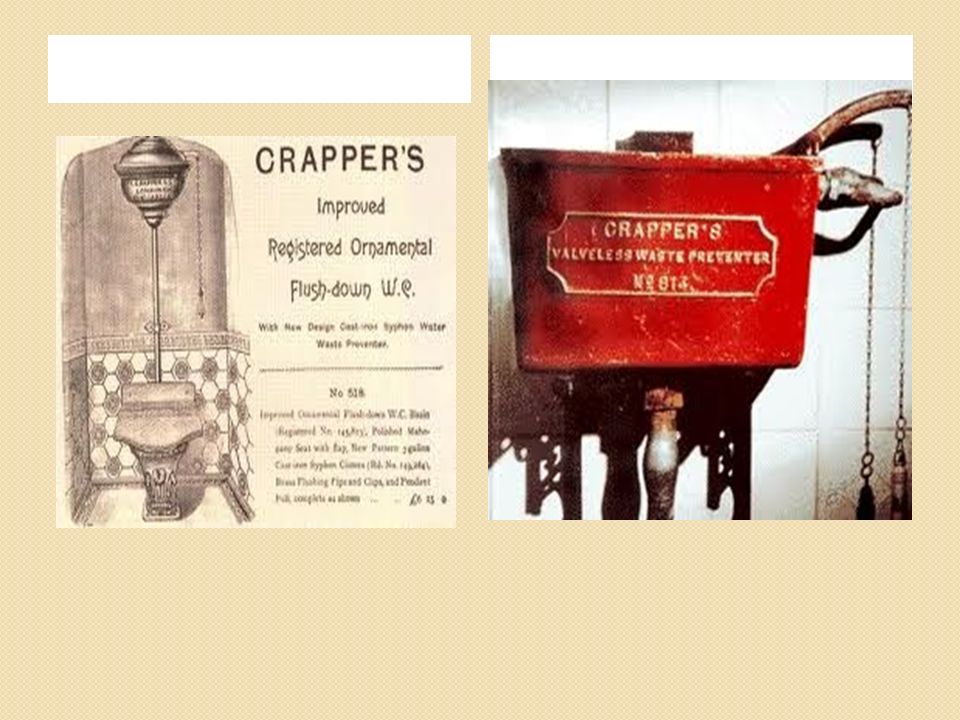
Thomas Crapper man hole cover

79
In theory: If you charge more or tax higher, consumption will decrease. Page 327 raise water prices.

80
Flood irrigation Flood irrigation 60%-80% effieient

82
Drip irrigation in practice 90-95% efficient.

83
Center pivot low pressure sprinkler. You need flat or gently rolling terrain for this type

84
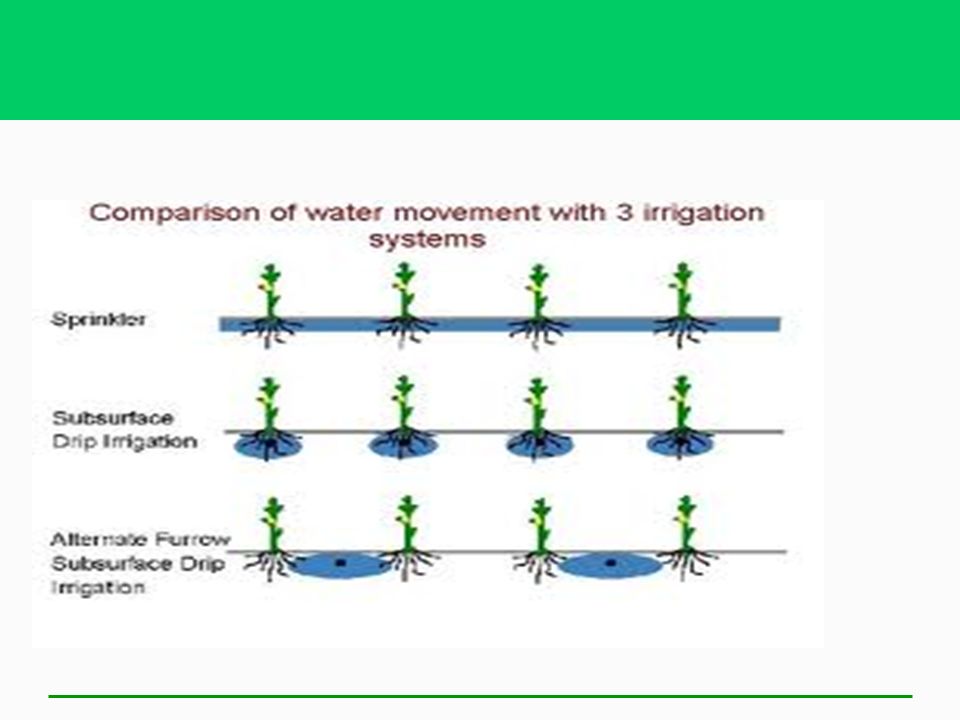
We Can Cut Water Waste in Irrigation Flood irrigation ◦ Wasteful Center pivot, low pressure sprinkler Low-energy, precision application sprinklers Drip or trickle irrigation, microirrigation ◦ Costly; less water waste ◦ Irrigate at night to reduce evaporation of water

85
WATER CONSERVATION List five (5) ways to reduce water loss due to faulty irrigation techniques. List eight (8) ways to reduce water waste in homes Floodplains are low areas that are prone to flooding. List (5) ways to prevent/control flood damage. Calculate how many liters AND gallons are wasted in one month(30days) by a toilet that leaks 2 drops per second. (1 liter of water = 3500 drops and 1 liter = 0.265 gal.
 ways to reduce water waste in homes Floodplains are low areas that are prone to flooding. List (5) ways to prevent/control flood damage. Calculate how many liters AND gallons are wasted in one month(30days) by a toilet that leaks 2 drops per second. (1 liter of water = 3500 drops and 1 liter = gal..")
86
On a cold morning, the utilitization of electric heat is most likely to be higher. What fuel is, most likely, forms the basis of the process that generates that electricity?

87
You have an old junk car that leaks 50 drops of oil per day. Assuming the car keeps running, calculate the annual oil loss, (assume no leap year) calculate Liters and Gallons 20 drops =1ml 3.78 L = 1 gal SHOW SET UP
 calculate Liters and Gallons 20 drops =1ml 3.78 L = 1 gal SHOW SET UP.")
88
Why were we instructed to take a temperature reading as a part of the DO (dissolved oxygen) lab protocol?
 lab protocol")
89
Major Irrigation Systems

90
Fig. 13-20, p. 335 Center pivot (efficiency 80% with low-pressure sprinkler and 90–95% with LEPA sprinkler) Drip irrigation (efficiency 90–95%) Water usually pumped from underground and sprayed from mobile boom with sprinklers. Gravity flow (efficiency 60% and 80% with surge valves) Above- or below-ground pipes or tubes deliver water to individual plant roots. Water usually comes from an aqueduct system or a nearby river.
 Drip irrigation (efficiency 90–95%) Water usually pumped from underground and sprayed from mobile boom with sprinklers. Gravity flow (efficiency 60% and 80% with surge valves) Above- or below-ground pipes or tubes deliver water to individual plant roots. Water usually comes from an aqueduct system or a nearby river..")
91
Fig. 13-20, p. 335 Stepped Art Gravity flow (efficiency 60% and 80% with surge valves) Water usually comes from an aqueduct system or a nearby river. Drip irrigation (efficiency 90–95%) Above- or below-ground pipes or tubes deliver water to individual plant roots. Center pivot (efficiency 80% with low-pressure sprinkler and 90–95% with LEPA sprinkler) Water usually pumped from underground and sprayed from mobile boom with sprinklers.
 Water usually comes from an aqueduct system or a nearby river. Drip irrigation (efficiency 90–95%) Above- or below-ground pipes or tubes deliver water to individual plant roots. Center pivot (efficiency 80% with low-pressure sprinkler and 90–95% with LEPA sprinkler) Water usually pumped from underground and sprayed from mobile boom with sprinklers..")
92
Solutions: Reducing Irrigation Water Waste

93
Developing Countries Use Low- Tech Methods for Irrigation Human-powered treadle pumps Harvest and store rainwater Create a canopy over crops: reduces evaporation Fog-catcher nets

94
We Can Cut Water Waste in Industry and Homes Recycle water in industry Fix leaks in the plumbing systems Use water-thrifty landscaping: xeriscaping Use gray water Pay-as-you-go water use

95
Solutions: Reducing Water Waste

96
We Can Use Less Water to Remove Wastes Can we mimic how nature deals with waste? Waterless composting toilets

97
Solutions: Sustainable Water Use

98
Fig. 13-23, p. 337 SOLUTIONS Sustainable Water Use Waste less water and subsidize water conservation Preserve water quality Protect forests, wetlands, mountain glaciers, watersheds, and other natural systems that store and release water Get agreements among regions and countries sharing surface water resources Raise water prices Do not deplete aquifers Slow population growth

99
What Can You Do? Water Use and Waste

100
Natural Capital Degradation: Hillside Before and After Deforestation

101
Fig. 13-25a, p. 339 Oxygen released by vegetation Diverse ecological habitat Evapotranspiration Trees reduce soil erosion from heavy rain and wind Agricultural land Tree roots stabilize soil Vegetation releases water slowly and reduces flooding Forested Hillside

102
Fig. 13-25b, p. 339 Tree plantation Roads destabilize hillsides Evapotranspiration decreases Overgrazing accelerates soil erosion by water and wind Winds remove fragile topsoil Agricultural land is flooded and silted up Gullies and landslides Heavy rain erodes topsoil Silt from erosion fills rivers and reservoirsRapid runoff causes flooding After Deforestation

103
Fig. 13-25a, p. 339 Oxygen released by vegetation Diverse ecological habitat Evapotranspiration Trees reduce soil erosion from heavy rain and wind Tree roots stabilize soil Vegetation releases water slowly and reduces flooding Forested Hillside Agricultural land Stepped Art Tree plantation Roads destabilize hillsides Overgrazing accelerates soil erosion by water and wind Winds remove fragile topsoil Agricultural land is flooded and silted up Gullies and landslides Heavy rain erodes topsoil Silt from erosion fills rivers and reservoirs Rapid runoff causes flooding After Deforestation Evapotranspiration decreases

104
Case Study: Living Dangerously on Floodplains in Bangladesh Dense population Located on coastal floodplain Moderate floods maintain fertile soil Increased frequency of large floods Effects of development in the Himalayan foothills Destruction of coastal wetlands

105
We Can Reduce Flood Risks Rely more on nature’s systems ◦ Wetlands ◦ Natural vegetation in watersheds Rely less on engineering devices ◦ Dams ◦ Levees

106
Solutions: Reducing Flood Damage

107
Fig. 13-26, p. 340 SOLUTIONS Reducing Flood Damage PreventionControl Preserve forests on watersheds Straighten and deepen streams (channelization) Preserve and restore wetlands in floodplains Tax development on floodplains Build levees or floodwalls along streams Use floodplains primarily for recharging aquifers, sustainable agriculture and forestry Build dams
 Preserve and restore wetlands in floodplains Tax development on floodplains Build levees or floodwalls along streams Use floodplains primarily for recharging aquifers, sustainable agriculture and forestry Build dams.")
108
Active Figure: Effects of deforestation

109
What is point source and non point source pollution? Indicator species- are organisms that monitor the quality of a water source. Protists and trout are indicators species. Trout need water with a high DO level.

110
Water pollution Why are lakes suceptable to contamination? Lakes have stratified layers with little vertical mixing. Toxins such as lead and mercury can concentrate higher in lakes. What is the difference between a eutrophic and oligotrophic lake? Eutrophication is the natural mixing of a shallow lake or estuary. Cultural eutrophication is enrichment such as NPK runoff. Oligotrophic lake is associated with a clear newly formed lake Cultural eutrophication expanded. Nitrates and phosphates from runoff from AGRICULTURAL OR OTHER HUMAN ACTIVITIES land cause excess algae and plant growth-----leading to increased rates of decomposition by aerobic organisms---lowering DO in the water. SOLUTIONS; Ban the use of phosphates in detergents/ control water runoff from land by building storm drains etc. / waste treatment to remove nitrates and phosphates. Groundwater pollution. Why is a clean groundwater source important? 95% of people in rural areas use wells for obtaining drinking water. Cite some common pollutants of groundwater aquifers? Gasoline, solvents. Paint thinners lead and arsenic can penetrate the subsoil and contaminate aquifers. Special focus Underground tanks (MTBE) a gas additive used to increase octane and prevent engine knock. It can leak from underground tanks into the water table Special Focus: Arsenic in well water. Read page 503 on arsenic in groundwater
 a gas additive used to increase octane and prevent engine knock. It can leak from underground tanks into the water table Special Focus: Arsenic in well water. Read page 503 on arsenic in groundwater.")
111
READ “Case study: The Chesapeake Bay------An Estuary in Trouble” on page 506-507 Ocean Oil pollution What is crude oil? What is refined oil? Exxon Valdez ? Crude oil tanker spill/ captain had been drinking/ polluted large area in Prince William Sound Alaska What is the LARGEST source of ocean pollution? Runoff from cities and industries. What are some ways to reduce/prevent coastal and ocean pollution. Separate sewage lines from storm lines/ double hulls on tanker ships/ ban dumping of raw sewege by cruise lines Exam prep: read case studies p. 305, 493 on pollution in the great lakes, p. 506-507 on oxygen depletion in the gulf of Mexico.

Similar presentations