Download presentation
Presentation is loading. Please wait.

1
Chapter 13 Water Resources

2
Case Study: The Colorado River Basin— An Overtapped Resource
2,300 km through 7 U.S. states 14 Dams and reservoirs Located in a desert area within the rain shadow of the Rocky Mountains Water supplied mostly from snowmelt of the Rocky Mountains

3
Case Study: The Colorado River Basin— An Overtapped Resource
Supplies water and electricity for about 30 million people Las Vegas, Los Angeles, San Diego Irrigation of crops that help feed America Very little water reaches the Gulf of California Southwest experiencing recent droughts

4
The Colorado River Basin
Figure 13.1: The Colorado River basin: The area drained by this basin is equal to more than one-twelfth of the land area of the lower 48 states. Two large reservoirs—Lake Mead behind the Hoover Dam and Lake Powell behind the Glen Canyon Dam—store about 80% of the water in this basin. Fig. 13-1, p. 317

5
Aerial View of Glen Canyon Dam Across the Colorado River and Lake Powell
Figure 13.2: The Glen Canyon Dam across the Colorado River was completed in Lake Powell behind the dam is the second largest reservoir in the United States. Fig. 13-2, p. 317

7
13-1 Will We Have Enough Usable Water?
Concept 13-1A We are using available freshwater unsustainably by wasting it, polluting it, and charging too little for this irreplaceable natural resource. Concept 13-1B One of every six people does not have sufficient access to clean water, and this situation will almost certainly get worse.

8
What does water do? Water: Keeps us alive Moderates climate
Sculpts the land Removes and dilutes wastes and pollutants Moves continually through the hydrologic (water) cycle
 cycle.")
9
Earth’s waters Earth is a watery world: 71% of surface
97% of this water is salt water 3% freshwater 0.024% is liquid freshwater Found in accessible groundwater, lakes, rivers, streams Hydrologic cycle Movement of water in the seas, land, and air Driven by solar energy and gravity

10
Figure 3.16: Natural capital.
Condensation Condensation Ice and snow Transpiration from plants Precipitation to land Evaporation of surface water Evaporation from ocean Runoff Lakes and reservoirs Precipitation to ocean Runoff Increased runoff on land covered with crops, buildings and pavement Infiltration and percolation into aquifer Increased runoff from cutting forests and filling wetlands Runoff Figure 3.16: Natural capital. This diagram is a simplified model of the water cycle, or hydrologic cycle, in which water circulates in various physical forms within the biosphere. Major harmful impacts of human activities are shown by the red arrows and boxes. Question: What are three ways in which your lifestyle directly or indirectly affects the hydrologic cycle? Groundwater in aquifers Overpumping of aquifers Water pollution Runoff Ocean Natural process Natural reservoir Human impacts Natural pathway Pathway affected by human activities Fig. 3-16, p. 67

11
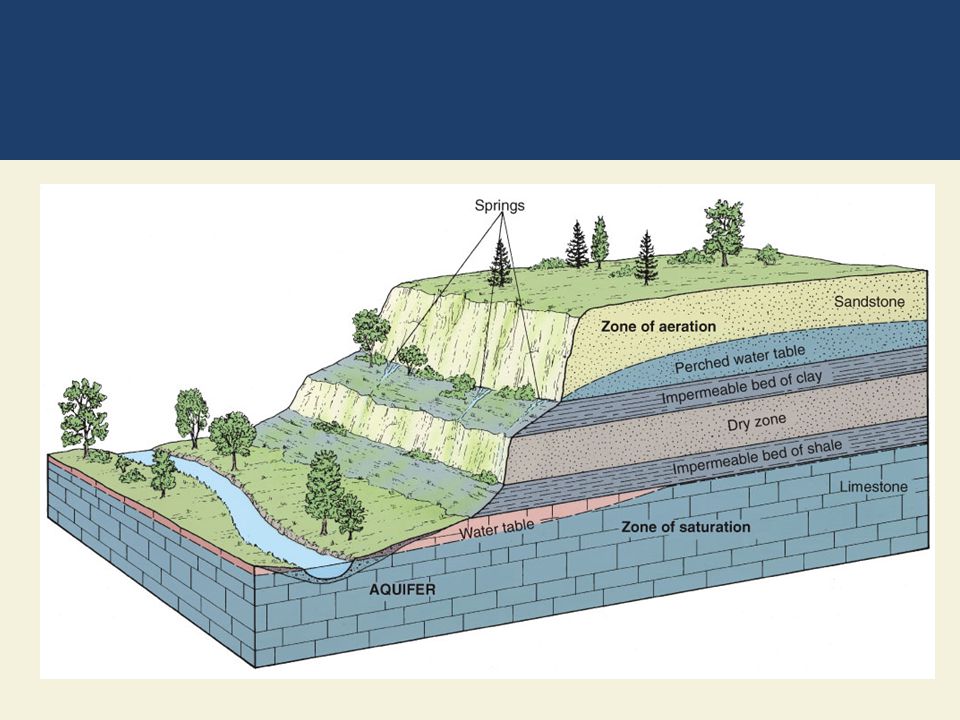
Groundwater Zone of saturation Water table Aquifers
Spaces in soil are filled with water Water table Top of zone of saturation Aquifers Natural recharge Lateral recharge

13
Surface Water Surface Water- water that does not soak into the ground or evaporate into the air Surface runoff 2/3 of the surface runoff: lost by seasonal floods 1/3 is reliable runoff = usable Currently utilixe 34% of world’s reliable runoff Could be using 90% BY 2025 Watershed (drainage) basin
 basin.")
14
Water Use World-wide averages Agriculture (irrigation): 70%
Industrial use: 20% Domestic (cities, residential): 10%
: 10%")
15
Water Use Water footprint Average American uses 260 liters per day
Volume of water we directly and indirectly Average American uses 260 liters per day Flushing toilets, 27% Washing clothes, 22% Taking showers, 17% Running faucets, 16% Wasted from leaks, 14% World’s poorest use 19 liters per day

16
Science Focus: Water Footprints and Virtual Water (2)
More water is used indirectly = virtual water Hamburger, 2400 liters Virtual water often exported/imported Grains and other foods

17
Virtual Water Use Figure 13.A: Producing and delivering a single one of each of the products shown here requires the equivalent of at least one and usually many bathtubs full of water, called virtual water. A typical bathtub contains about 151 liters (40 gallons) of water. The average amount of water used to raise a single steer during its typical 3-year life from birth to slaughter and to market by an industrial producer would fill more than 20,000 bathtubs. This includes water used for providing the steer with food and drinking water and water used to clean up its wastes. It is not surprising that about 70% of the world’s water is used for irrigation, because it takes about 1,000 metric tons (900 tons) of water to produce 1 metric ton (0.9 ton) of grain. (Data from UNESCO-IHE Institute for Water Education, UN Food and Agriculture Organization, World Water Council, Water Footprint Network, and Coca Cola Company) [Photos from Shutterstock; Credits (top to bottom: Kirsty Pargeter, Aleksandra Nadeina, Alexander Kallina, Kelpfish, Wolfgang Amri, Skip Odonnell, Eky Chan, Rafal Olechowski)] Fig. 13-A, p. 321
 of water. The average amount of water used to raise a single steer during its typical 3-year life from birth to slaughter and to market by an industrial producer would fill more than 20,000 bathtubs. This includes water used for providing the steer with food and drinking water and water used to clean up its wastes. It is not surprising that about 70% of the world’s water is used for irrigation, because it takes about 1,000 metric tons (900 tons) of water to produce 1 metric ton (0.9 ton) of grain. (Data from UNESCO-IHE Institute for Water Education, UN Food and Agriculture Organization, World Water Council, Water Footprint Network, and Coca Cola Company) [Photos from Shutterstock; Credits (top to bottom: Kirsty Pargeter, Aleksandra Nadeina, Alexander Kallina, Kelpfish, Wolfgang Amri, Skip Odonnell, Eky Chan, Rafal Olechowski)] Fig. 13-A, p")
18
Water Shortages Due to: Dry climates Drought
30% earth’s land area experiences severe drought Will rise to 45% by 2059 from climate change Too many people using a normal supply of water China and urbanization Wasteful use of water

19
Water Shortages Will Grow
More than 30 countries now face water scarcity By 2050, 60 countries (mostly Asia) ¾ of world population will suffer from water stress Potential conflicts/wars over water Refugees from arid lands Increased mortality
 ¾ of world population will suffer from water stress. Potential conflicts/wars over water. Refugees from arid lands. Increased mortality.")
20
Average Annual Precipitation and Major Rivers, Water-Deficit Regions in U.S.
Figure 13.4: The top map shows the average annual precipitation and major rivers in the continental United States. The bottom map shows water-deficit regions in the continental United States and their proximity to metropolitan areas having populations greater than 1 million (shaded areas). Question: Why do you think some areas with moderate precipitation still suffer from water shortages? (Data from U.S. Water Resources Council and U.S. Geological Survey) Fig. 13-4, p. 322
. Question: Why do you think some areas with moderate precipitation still suffer from water shortages (Data from U.S. Water Resources Council and U.S. Geological Survey) Fig. 13-4, p")
21
Water Hotspots in 17 Western U.S. States
Figure 13.5: This map shows water scarcity hotspots in 17 western states that, by 2025, could face intense conflicts over scarce water needed for urban growth, irrigation, recreation, and wildlife. Some analysts suggest that this is a map of places not to live in the foreseeable future. Question: Which, if any, of these areas are found in the Colorado River basin (Figure 13-1)? (Data from U.S. Department of the Interior) Fig. 13-5, p. 322
 (Data from U.S. Department of the Interior) Fig. 13-5, p")
22
Natural Capital Degradation: Stress on the World’s Major River Basins
Figure 13.6: Natural capital degradation. The world’s major river basins differ in their degree of water scarcity stress, the measurement of which is based on a comparison of the amount of water available with the amount used by humans (Concept 13-1B). Questions: If you live in a water-stressed area, what signs of stress have you noticed? In what ways, if any, has it affected your life? (Data from World Commission on Water Use in the 21st Century) Fig. 13-6, p. 323
. Questions: If you live in a water-stressed area, what signs of stress have you noticed In what ways, if any, has it affected your life (Data from World Commission on Water Use in the 21st Century) Fig. 13-6, p")
23
= 1 tub = 4 tubs = 16 tubs = 17 tubs = 72 tubs = 2,600 tubs
1 tub = 151 liters (40 gallons) = 1 tub = 4 tubs = 16 tubs = 17 tubs Figure 13.A: Producing and delivering a single one of each of the products shown here requires the equivalent of at least one and usually many bathtubs full of water, called virtual water. A typical bathtub contains about 151 liters (40 gallons) of water. The average amount of water used to raise a single steer during its typical 3-year life from birth to slaughter and to market by an industrial producer would fill more than 20,000 bathtubs. This includes water used for providing the steer with food and drinking water and water used to clean up its wastes. It is not surprising that about 70% of the world’s water is used for irrigation, because it takes about 1,000 metric tons (900 tons) of water to produce 1 metric ton (0.9 ton) of grain. (Data from UNESCO-IHE Institute for Water Education, UN Food and Agriculture Organization, World Water Council, Water Footprint Network, and Coca Cola Company) [Photos from Shutterstock; Credits (top to bottom: Kirsty Pargeter, Aleksandra Nadeina, Alexander Kallina, Kelpfish, Wolfgang Amri, Skip Odonnell, Eky Chan, Rafal Olechowski)] = 72 tubs = 2,600 tubs = 16,600 tubs Fig. 13-A, p. 321
 = 1 tub. = 4 tubs. = 16 tubs. = 17 tubs. Figure 13.A: Producing and delivering a single one of each of the products shown here requires the equivalent of at least one and usually many bathtubs full of water, called virtual water. A typical bathtub contains about 151 liters (40 gallons) of water. The average amount of water used to raise a single steer during its typical 3-year life from birth to slaughter and to market by an industrial producer would fill more than 20,000 bathtubs. This includes water used for providing the steer with food and drinking water and water used to clean up its wastes. It is not surprising that about 70% of the world’s water is used for irrigation, because it takes about 1,000 metric tons (900 tons) of water to produce 1 metric ton (0.9 ton) of grain. (Data from UNESCO-IHE Institute for Water Education, UN Food and Agriculture Organization, World Water Council, Water Footprint Network, and Coca Cola Company) [Photos from Shutterstock; Credits (top to bottom: Kirsty Pargeter, Aleksandra Nadeina, Alexander Kallina, Kelpfish, Wolfgang Amri, Skip Odonnell, Eky Chan, Rafal Olechowski)] = 72 tubs. = 2,600 tubs. = 16,600 tubs. Fig. 13-A, p")
24
Freshwater Is an Irreplaceable Resource That We Are Managing Poorly (1)
Why is water so important? Earth as a watery world: 71% of surface Poorly managed resource Water waste Water pollution

25
Freshwater Is an Irreplaceable Resource That We Are Managing Poorly (2)
Access to water is A global health issue An economic issue A women’s and children’s issue A national and global security issue

26
Most of the Earth’s Freshwater Is Not Available to Us
Freshwater availability: 0.024% Groundwater, lakes, rivers, streams Hydrologic cycle Movement of water in the seas, land, and air Driven by solar energy and gravity People divided into Water haves Water have-nots

27
Hydrologic Cycle Figure 3.16: Natural capital.
This diagram is a simplified model of the water cycle, or hydrologic cycle, in which water circulates in various physical forms within the biosphere. Major harmful impacts of human activities are shown by the red arrows and boxes. Question: What are three ways in which your lifestyle directly or indirectly affects the hydrologic cycle? Fig. 3-16, p. 67

28
Girl Carrying Well Water over Dried Out Earth during a Severe Drought in India
Figure 13.3: Many areas of the world suffer from severe and long-lasting shortages of freshwater. This has a major impact on the poor in some areas of India, especially women and children such as this young girl carrying water to her home in a very dry area. According to the United Nations, over 1.2 billion people—about 4 times the entire U.S. population—do not have access to clean water where they live. Each day girls and women in this group typically walk an average of almost 6 kilometers (4 miles) and spend an average of 3 hours collecting water from distant sources. Fig. 13-3, p. 319
 and spend an average of 3 hours collecting water from distant sources. Fig. 13-3, p")
29
Case Study: Freshwater Resources in the United States
More than enough renewable freshwater, unevenly distributed and polluted Effect of Floods Pollution Drought 2007: U.S. Geological Survey projection Water hotspots

30
Average annual precipitation (centimeters) Less than 41 81–122 41–81
More than 122 Figure 13.4: The top map shows the average annual precipitation and major rivers in the continental United States. The bottom map shows water-deficit regions in the continental United States and their proximity to metropolitan areas having populations greater than 1 million (shaded areas). Question: Why do you think some areas with moderate precipitation still suffer from water shortages? (Data from U.S. Water Resources Council and U.S. Geological Survey) Acute shortage Shortage Adequate supply Metropolitan regions with population greater than 1 million Fig. 13-4, p. 322
. Question: Why do you think some areas with moderate precipitation still suffer from water shortages (Data from U.S. Water Resources Council and U.S. Geological Survey) Acute shortage. Shortage. Adequate supply. Metropolitan regions with. population greater than 1 million. Fig. 13-4, p")
31
Stepped Art Average annual precipitation (centimeters) Less than 41
41-81 81-122 More than 122 Acute shortage Shortage Adequate supply Metropolitan regions with population greater than 1 million Stepped Art Fig. 13-4, p. 322

32
Washington North Dakota Montana Oregon Idaho South Dakota Wyoming
Nebraska Nevada Utah Colorado Kansas California Oklahoma New Mexico Arizona Figure 13.5: This map shows water scarcity hotspots in 17 western states that, by 2025, could face intense conflicts over scarce water needed for urban growth, irrigation, recreation, and wildlife. Some analysts suggest that this is a map of places not to live in the foreseeable future. Question: Which, if any, of these areas are found in the Colorado River basin (Figure 13-1)? (Data from U.S. Department of the Interior) Texas Highly likely conflict potential Substantial conflict potential Moderate conflict potential Unmet rural water needs Fig. 13-5, p. 322
 (Data from U.S. Department of the Interior) Texas. Highly likely conflict potential. Substantial conflict potential. Moderate conflict potential. Unmet rural water needs. Fig. 13-5, p")
33
Europe Asia North America Africa South America Australia Stress High
Figure 13.6: Natural capital degradation. The world’s major river basins differ in their degree of water scarcity stress, the measurement of which is based on a comparison of the amount of water available with the amount used by humans (Concept 13-1B). Questions: If you live in a water-stressed area, what signs of stress have you noticed? In what ways, if any, has it affected your life? (Data from World Commission on Water Use in the 21st Century) Stress High None Fig. 13-6, p. 323
. Questions: If you live in a water-stressed area, what signs of stress have you noticed In what ways, if any, has it affected your life (Data from World Commission on Water Use in the 21st Century) Stress. High. None. Fig. 13-6, p")
34
13-2 Is Extracting Groundwater the Answer?
Concept Groundwater used to supply cities and grow food is being pumped from aquifers in some areas faster than it is renewed by precipitation.

35
Where can we get more water?
Viable sources of useable water Groundwater Constructing Dams Diversions Desalination

36
Groundwater Aquifers provide drinking water for half the world Provide almost 25% of world’s water Most are considered renewable Some being used faster than can be replenished Contamination can be an issue Water tables are falling in many parts of the world, primarily from crop irrigation

37
Groundwater is Being Withdrawn Faster Than It Is Replenished
India, China, and the United States Three largest grain producers Overpumping aquifers for irrigation of crops India and China Small farmers drilling tubewells Saudi Arabia Most (70%) of its water from desalinization Aquifer depletion and irrigation
 of its water from desalinization. Aquifer depletion and irrigation.")
38
Trade-Offs: Withdrawing Groundwater, Advantages and Disadvantages
Figure 13.7: Withdrawing groundwater from aquifers has advantages and disadvantages. Questions: Which two advantages and which two disadvantages do you think are the most important? Why? Fig. 13-7, p. 325

39
Natural Capital Degradation: Irrigation in Saudi Arabia Using an Aquifer
Figure 13.8: Natural capital degradation. These satellite photos show farmland irrigated by groundwater pumped from an ancient and nonrenewable aquifer in a vast desert region of Saudi Arabia between 1986 (left) and 2004 (right). Irrigated areas appear as green dots (each representing a circular spray system) and brown dots show areas where wells have gone dry and the land has returned to desert. Hydrologists estimate that because of aquifer depletion, most irrigated agriculture in Saudi Arabia will disappear within the next 5 to 10 years. Fig. 13-8, p. 325
 and 2004 (right). Irrigated areas appear as green dots (each representing a circular spray system) and brown dots show areas where wells have gone dry and the land has returned to desert. Hydrologists estimate that because of aquifer depletion, most irrigated agriculture in Saudi Arabia will disappear within the next 5 to 10 years. Fig. 13-8, p")
40
Case Study: Aquifer Depletion in the United States
Ogallala aquifer: largest known aquifer Irrigates the Great Plains Very slow recharge Water table dropping Government subsidies to continue farming deplete the aquifer further Biodiversity threatened in some areas California Central Valley: serious water depletion

41
Natural Capital Degradation: Areas of Greatest Aquifer Depletion in the U.S.
Figure 13.9: Natural capital degradation. This map shows areas of greatest aquifer depletion from groundwater overdraft in the continental United States. Aquifer depletion is also high in Hawaii and Puerto Rico (not shown on map). See an animation based on this figure at CengageNOW. Questions: Do you depend on any of these overdrawn aquifers for your drinking water? If so, what is the level of severity of overdraft where you live? (Data from U.S. Water Resources Council and U.S. Geological Survey) Fig. 13-9, p. 326
. See an animation based on this figure at CengageNOW. Questions: Do you depend on any of these overdrawn aquifers for your drinking water If so, what is the level of severity of overdraft where you live (Data from U.S. Water Resources Council and U.S. Geological Survey) Fig. 13-9, p")
42
Kansas Crops Irrigated by the Ogallala Aquifer
Figure 13.10: These crop fields in the state of Kansas are irrigated by groundwater pumped from the Ogallala. Green circles show irrigated areas and brown, gray, and white circles represent fields that have been recently harvested and plowed under or that have not been planted for a year. Fig , p. 326

43
Overpumping Aquifers Has Several Harmful Effects
Limits future food production Bigger gap between the rich and the poor Land subsidence San Joaquin Valley in California Groundwater overdrafts near coastal regions Contamination of groundwater with saltwater

44
Subsidence in the San Joaquin Valley
Figure 13.11: This pole shows subsidence from overpumping of an aquifer for irrigation in California’s San Joaquin Central Valley between 1925 and In 1925, the land surface in this area was near the top of this pole. Since 1977 this problem has gotten worse. Fig , p. 327

45
Deep Aquifers Might Be Tapped
May contain enough water to provide for billions of people for centuries Major concerns Nonrenewable Little is known about the geological and ecological impacts of pumping deep aquifers Some flow beneath more than one country Costs of tapping are unknown and could be high

46
Should we use dams to increase available water?
Main goal of a dam and reservoir system Capture and store runoff Release runoff as needed to control: Floods Generate electricity Supply irrigation water Recreation (reservoirs)
")
47
Large Dams and Reservoirs Have Advantages and Disadvantages
Increase the reliable runoff available Reduce flooding Grow crops in arid regions Disadvantages Displaces people Flooded regions Impaired ecological services of rivers Loss of plant and animal species Fill up with sediment Can cause other streams and lakes to dry up

48
Advantages and Disadvantages of Large Dams and Reservoirs
Figure 13.13: Trade-offs. Large dams and reservoirs have advantages (green) and disadvantages (orange) (Concept 13-3). The world’s 45,000 large dams (15 meters (49 feet) or higher) capture and store about 14% of the world’s surface runoff, provide water for almost half of all irrigated cropland, and supply more than half the electricity used in 65 countries. The United States has more than 70,000 large and small dams, capable of capturing and storing half of the country’s entire river flow. Question: Which single advantage and which single disadvantage do you think are the most important? Fig , p. 328
 and disadvantages (orange) (Concept 13-3). The world’s 45,000 large dams (15 meters (49 feet) or higher) capture and store about 14% of the world’s surface runoff, provide water for almost half of all irrigated cropland, and supply more than half the electricity used in 65 countries. The United States has more than 70,000 large and small dams, capable of capturing and storing half of the country’s entire river flow. Question: Which single advantage and which single disadvantage do you think are the most important Fig , p")
49
Powerlines Reservoir Dam Powerhouse Intake Turbine
Figure 13.13: Trade-offs. Large dams and reservoirs have advantages (green) and disadvantages (orange) (Concept 13-3). The world’s 45,000 large dams (15 meters (49 feet) or higher) capture and store about 14% of the world’s surface runoff, provide water for almost half of all irrigated cropland, and supply more than half the electricity used in 65 countries. The United States has more than 70,000 large and small dams, capable of capturing and storing half of the country’s entire river flow. Question: Which single advantage and which single disadvantage do you think are the most important? Fig b, p. 328
 and disadvantages (orange) (Concept 13-3). The world’s 45,000 large dams (15 meters (49 feet) or higher) capture and store about 14% of the world’s surface runoff, provide water for almost half of all irrigated cropland, and supply more than half the electricity used in 65 countries. The United States has more than 70,000 large and small dams, capable of capturing and storing half of the country’s entire river flow. Question: Which single advantage and which single disadvantage do you think are the most important Fig b, p")
50
Transferring Water Water transferred by California Water Project
Tunnels Aqueducts Underground pipes California Water Project Inefficient water use Environmental damage to Sacramento River and San Francisco Bay

51
The California Water Project and the Central Arizona Project
Figure 13.16: The California Water Project and the Central Arizona Project transfer huge volumes of water from one watershed to another. The red arrows show the general direction of water flow. Questions: What effects might this system have on different areas on this map? How might it affect areas from which the water is taken? Fig , p. 331

52
Natural Capital Degradation: The Aral Sea, Shrinking Freshwater Lake
Figure 13.17: Natural capital degradation. The Aral Sea was one of the world’s largest saline lakes. Since 1960, it has been shrinking and getting saltier because most of the water from the two rivers that replenish it has been diverted to grow cotton and food crops. These satellite photos show the sea in 1976 and in As the Southern Aral Sea shrank, it split into two lakes and left behind a salty desert, economic ruin, increasing health problems, and severe ecological disruption. By late 2009, the larger eastern part of the once huge Southern Aral Sea was gone (bottom-right part of each photo). The smaller Northern Aral Sea (top of each photo) has also shrunk, but not nearly as much as the Southern Aral Sea has. Question: What are three things that you think should be done to help prevent further shrinkage of the Aral Sea? Fig , p. 332
. The smaller Northern Aral Sea (top of each photo) has also shrunk, but not nearly as much as the Southern Aral Sea has. Question: What are three things that you think should be done to help prevent further shrinkage of the Aral Sea Fig , p")
53
Creating freshwater from saltwater
Desalination Removing dissolved salts Distillation: evaporate water, leaving salts behind Reverse osmosis, microfiltration: use high pressure to remove salts 14,450 plants in 125 countries Saudi Arabia: highest number

54
Desalination Problems High cost and energy footprint
Keeps down algal growth and kills many marine organisms Large quantity of brine wastes

55
Groundwater Depletion
Solutions Groundwater Depletion Prevention Control Waste less water Raise price of water to discourage waste Subsidize water conservation Tax water pumped from wells near surface waters Limit number of wells Figure 13.12: There are a number of ways to prevent or slow groundwater depletion by using water more sustainably. Questions: Which two of these solutions do you think are the most important? Why? Set and enforce minimum stream flow levels Do not grow water-intensive crops in dry areas Divert surface water in wet years to recharge aquifers Fig , p. 327

56
Withdrawing Groundwater
Trade-Offs Withdrawing Groundwater Advantages Disadvantages Useful for drinking and irrigation Aquifer depletion from overpumping Sinking of land (subsidence) from overpumping Exists almost everywhere Renewable if not overpumped or contaminated Pollution of aquifers lasts decades or centuries Figure 13.7: Withdrawing groundwater from aquifers has advantages and disadvantages. Questions: Which two advantages and which two disadvantages do you think are the most important? Why? Cheaper to extract than most surface waters Deeper wells are nonrenewable Fig. 13-7, p. 325
 from overpumping. Exists almost everywhere. Renewable if not overpumped or contaminated. Pollution of aquifers lasts decades or centuries. Figure 13.7: Withdrawing groundwater from aquifers has advantages and disadvantages. Questions: Which two advantages and which two disadvantages do you think are the most important Why Cheaper to extract than most surface waters. Deeper wells are nonrenewable. Fig. 13-7, p")
57
Solutions: Groundwater Depletion, Prevention and Control
Figure 13.12: There are a number of ways to prevent or slow groundwater depletion by using water more sustainably. Questions: Which two of these solutions do you think are the most important? Why? Fig , p. 327

58
Groundwater Overdrafts:
Figure 13.9: Natural capital degradation. This map shows areas of greatest aquifer depletion from groundwater overdraft in the continental United States. Aquifer depletion is also high in Hawaii and Puerto Rico (not shown on map). See an animation based on this figure at CengageNOW. Questions: Do you depend on any of these overdrawn aquifers for your drinking water? If so, what is the level of severity of overdraft where you live? (Data from U.S. Water Resources Council and U.S. Geological Survey) Groundwater Overdrafts: High Moderate Minor or none Fig. 13-9, p. 326
. See an animation based on this figure at CengageNOW. Questions: Do you depend on any of these overdrawn aquifers for your drinking water If so, what is the level of severity of overdraft where you live (Data from U.S. Water Resources Council and U.S. Geological Survey) Groundwater Overdrafts: High. Moderate. Minor or none. Fig. 13-9, p")
59
13-3 Is Building More Dams the Answer?
Concept 13-3 Building dam-and-reservoir systems has greatly increased water supplies in some areas, but it has disrupted ecosystems and displaced people.

60
Provides irrigation water above and below dam
Flooded land destroys forests or cropland and displaces people Large losses of water through evaporation Provides water for drinking Deprives downstream cropland and estuaries of nutrient-rich silt Reservoir useful for recreation and fishing Risk of failure and devastating downstream flooding Can produce cheap electricity (hydropower) Figure 13.13: Trade-offs. Large dams and reservoirs have advantages (green) and disadvantages (orange) (Concept 13-3). The world’s 45,000 large dams (15 meters (49 feet) or higher) capture and store about 14% of the world’s surface runoff, provide water for almost half of all irrigated cropland, and supply more than half the electricity used in 65 countries. The United States has more than 70,000 large and small dams, capable of capturing and storing half of the country’s entire river flow. Question: Which single advantage and which single disadvantage do you think are the most important? Reduces down-stream flooding of cities and farms Disrupts migration and spawning of some fish Fig a, p. 328
 Figure 13.13: Trade-offs. Large dams and reservoirs have advantages (green) and disadvantages (orange) (Concept 13-3). The world’s 45,000 large dams (15 meters (49 feet) or higher) capture and store about 14% of the world’s surface runoff, provide water for almost half of all irrigated cropland, and supply more than half the electricity used in 65 countries. The United States has more than 70,000 large and small dams, capable of capturing and storing half of the country’s entire river flow. Question: Which single advantage and which single disadvantage do you think are the most important Reduces down-stream flooding of cities and farms. Disrupts migration and spawning of some fish. Fig a, p")
61
The Flow of the Colorado River Measured at Its Mouth Has Dropped Sharply
Figure 13.14: The measured flow of the Colorado River at its mouth has dropped sharply since 1905 as a result of multiple dams, water withdrawals for agriculture and urban water supplies, and prolonged drought. Historical records and tree-ring analysis show that about once every century, the southwestern United States suffers from a mega-drought—a decades-long dry period. (Data from U.S. Geological Survey) Fig , p. 329
 Fig , p")
62
Hoover Dam completed (1935)
30 Hoover Dam completed (1935) 25 20 Flow (billion cubic meters) 15 Glen Canyon Dam completed (1963) 10 Figure 13.14: The measured flow of the Colorado River at its mouth has dropped sharply since 1905 as a result of multiple dams, water withdrawals for agriculture and urban water supplies, and prolonged drought. Historical records and tree-ring analysis show that about once every century, the southwestern United States suffers from a mega-drought—a decades-long dry period. (Data from U.S. Geological Survey) 5 Year Fig , p. 329
 Flow (billion cubic meters) 15. Glen Canyon Dam completed (1963) 10. Figure 13.14: The measured flow of the Colorado River at its mouth has dropped sharply since 1905 as a result of multiple dams, water withdrawals for agriculture and urban water supplies, and prolonged drought. Historical records and tree-ring analysis show that about once every century, the southwestern United States suffers from a mega-drought—a decades-long dry period. (Data from U.S. Geological Survey) Year. Fig , p")
63
13-4 Is Transferring Water from One Place to Another the Answer?
Concept Transferring water from one place to another has greatly increased water supplies in some areas, but it has also disrupted ecosystems.

64
Southern California Lettuce Grown with Northern California Water
Figure 13.15: This lettuce crop is growing in the Imperial Valley of central California. This and other water-intensive crops are grown in this arid area mostly because of the availability of cheap, government-subsidized irrigation water brought in from northern California, but also because the weather allows for growing crops year round in this valley. Question: Have you ever checked to see where your lettuce and other produce that you eat come from? Fig , p. 331

65
Colorado River Aqueduct Central Arizona Project
CALIFORNIA NEVADA Shasta Lake Oroville Dam and UTAH Sacramento River Reservoir Feather River North Bay Aqueduct Lake Tahoe Sacramento SIERRA MOUNTAIN RANGE San Francisco South Bay Aqueduct Hoover Dam and Reservoir (Lake Mead) Fresno San Luis Dam and Reservoir San Joaquin Valley Colorado River Los Angeles Aqueduct California Aqueduct ARIZONA Colorado River Aqueduct Santa Barbara Figure 13.16: The California Water Project and the Central Arizona Project transfer huge volumes of water from one watershed to another. The red arrows show the general direction of water flow. Questions: What effects might this system have on different areas on this map? How might it affect areas from which the water is taken? Central Arizona Project Los Angeles Phoenix Salton Sea San Diego Tucson MEXICO Fig , p. 331
 Fresno. San Luis Dam and Reservoir. San Joaquin Valley. Colorado River. Los Angeles Aqueduct. California Aqueduct. ARIZONA. Colorado River Aqueduct. Santa Barbara. Figure 13.16: The California Water Project and the Central Arizona Project transfer huge volumes of water from one watershed to another. The red arrows show the general direction of water flow. Questions: What effects might this system have on different areas on this map How might it affect areas from which the water is taken Central Arizona Project. Los Angeles. Phoenix. Salton Sea. San Diego. Tucson. MEXICO. Fig , p")
66
Case Study: The Aral Sea Disaster (1)
Large-scale water transfers in dry central Asia Salinity Wetland destruction and wildlife Fish extinctions and fishing declines

67
Case Study: The Aral Sea Disaster (2)
Wind-blown salt Water pollution Restoration efforts Cooperation of neighboring countries More efficient irrigation Dike built to raise lake level

68
13-5 Is Converting Salty Seawater to Freshwater the Answer?
Concept We can convert salty ocean water to freshwater, but the cost is high, and the resulting salty brine must be disposed of without harming aquatic or terrestrial ecosystems.

69
Science Focus: The Search for Improved Desalination Technology
Desalination on offshore ships Solar or wind energy Use ocean waves for power Build desalination plants near electric power plants

70
13-6 How Can We Use Water More Sustainably?
Concept We can use water more sustainably by cutting water waste, raising water prices, slowing population growth, and protecting aquifers, forests, and other ecosystems that store and release water.

71
Reducing Water Waste Has Many Benefits
One-half to two-thirds of water is wasted Subsidies mask the true cost of water Water conservation Improves irrigation efficiency Improves collection efficiency Uses less in homes and businesses

72
We Can Cut Water Waste in Irrigation
Flood irrigation Wasteful Center pivot, low pressure sprinkler Low-energy, precision application sprinklers Drip or trickle irrigation, microirrigation Costly; less water waste

73
Major Irrigation Systems
Figure 13.18: Several different systems are used to irrigate crops. The two most efficient systems are the low-energy, precision application (LEPA) center-pivot system and the drip irrigation system. Because of high initial costs, they are not widely used. The development of new, low-cost, drip-irrigation systems may change this situation. Fig , p. 335
 center-pivot system and the drip irrigation system. Because of high initial costs, they are not widely used. The development of new, low-cost, drip-irrigation systems may change this situation. Fig , p")
74
(efficiency 80% with low-pressure sprinkler and
Figure 13.18: Several different systems are used to irrigate crops. The two most efficient systems are the low-energy, precision application (LEPA) center-pivot system and the drip irrigation system. Because of high initial costs, they are not widely used. The development of new, low-cost, drip-irrigation systems may change this situation. Center pivot (efficiency 80% with low-pressure sprinkler and 90–95% with LEPA sprinkler) Drip irrigation (efficiency 90–95%) Gravity flow (efficiency 60% and 80% with surge valves) Above- or below-ground pipes or tubes deliver water to individual plant roots. Water usually pumped from underground and sprayed from mobile boom with sprinklers. Water usually comes from an aqueduct system or a nearby river. Fig , p. 335
 center-pivot system and the drip irrigation system. Because of high initial costs, they are not widely used. The development of new, low-cost, drip-irrigation systems may change this situation. Center pivot. (efficiency 80% with low-pressure sprinkler and. 90–95% with LEPA sprinkler) Drip irrigation. (efficiency 90–95%) Gravity flow. (efficiency 60% and 80% with surge valves) Above- or below-ground pipes or tubes deliver water to individual plant roots. Water usually pumped from underground and sprayed from mobile boom with sprinklers. Water usually comes from an aqueduct system or a nearby river. Fig , p")
75
(efficiency 60% and 80% with surge valves)
Center pivot (efficiency 80% with low-pressure sprinkler and 90–95% with LEPA sprinkler) Water usually pumped from underground and sprayed from mobile boom with sprinklers. Drip irrigation (efficiency 90–95%) Above- or below-ground pipes or tubes deliver water to individual plant roots. Gravity flow (efficiency 60% and 80% with surge valves) Water usually comes from an aqueduct system or a nearby river. Stepped Art Fig , p. 335
 Water usually pumped from underground and sprayed from mobile boom with sprinklers. Drip irrigation. (efficiency 90–95%) Above- or below-ground pipes or tubes deliver water to individual plant roots. Gravity flow. (efficiency 60% and 80% with surge valves) Water usually comes from an aqueduct system or a nearby river. Stepped Art. Fig , p")
76
Solutions: Reducing Irrigation Water Waste
Figure 13.19: There are a number of ways to reduce water waste in irrigation. Questions: Which two of these solutions do you think are the best ones? Why? Fig , p. 336

77
Less-Developed Countries Use Low-Tech Methods for Irrigation
Human-powered treadle pumps Harvest and store rainwater Create a polyculture canopy over crops: reduces evaporation

78
Treadle Pump in Bangladesh
Figure 13.20: Solutions. In areas of Bangladesh and India, where water tables are high, many small-scale farmers use treadle pumps to supply irrigation water to their fields. Fig , p. 337

79
We Can Cut Water Waste in Industry and Homes
Recycle water in industry Fix leaks in the plumbing systems Use water-thrifty landscaping: xeriscaping Use gray water Pay-as-you-go water use

80
Solutions: Reducing Water Waste
Figure 13.21: There are a number of ways to reduce water waste in industries, homes, and businesses (Concept 13-3). Questions: Which three of these solutions do you think are the best ones? Why? Fig , p. 337
. Questions: Which three of these solutions do you think are the best ones Why Fig , p")
81
Xeriscaping in Southern California
Figure 13.22: This yard in Encinitas, a city in a dry area of southern California (USA), uses a diversity of plants that are native to the arid environment and require little watering. Fig , p. 338
, uses a diversity of plants that are native to the arid environment and require little watering. Fig , p")
82
We Can Use Less Water to Remove Wastes
Can we mimic how nature deals with waste? Use human sewage to create nutrient-rich sludge to apply to croplands Waterless composting toilets

83
Solutions: Sustainable Water Use
Figure 13.23: A variety of methods can help us to use the earth’s water resources more sustainably (Concept 13-6). Questions: Which two of these solutions do you think are the most important? Why? Fig , p. 339
. Questions: Which two of these solutions do you think are the most important Why Fig , p")
84
Solutions Sustainable Water Use
Waste less water and subsidize water conservation Do not deplete aquifers Preserve water quality Protect forests, wetlands, mountain glaciers, watersheds, and other natural systems that store and release water Figure 13.23: A variety of methods can help us to use the earth’s water resources more sustainably (Concept 13-6). Questions: Which two of these solutions do you think are the most important? Why? Get agreements among regions and countries sharing surface water resources Raise water prices Slow population growth Fig , p. 339
. Questions: Which two of these solutions do you think are the most important Why Get agreements among regions and countries sharing surface water resources. Raise water prices. Slow population growth. Fig , p")
85
What Can You Do? Water Use and Waste
Figure 13.24: Individuals matter. You can reduce your use and waste of water. See for a number of tips, provided by the Environmental Protection Agency and the California Urban Water Conservation Council, that you can use anywhere for saving water. Questions: Which of these steps have you taken? Which of them would you like to take? Fig , p. 339

86
13-7 How Can We Reduce the Threat of Flooding?
Concept We can lessen the threat of flooding by protecting more wetlands and natural vegetation in watersheds, and by not building in areas subject to frequent flooding.

87
Some Areas Get Too Much Water from Flooding (1)
Flood plains Highly productive wetlands Provide natural flood and erosion control Maintain high water quality Recharge groundwater Benefits of floodplains Fertile soils Nearby rivers for use and recreation Flatlands for urbanization and farming

88
Some Areas Get Too Much Water from Flooding (2)
Human activities make floods worse Levees can break or be overtopped Paving and development increase runoff Removal of water-absorbing vegetation Draining wetlands and building on them Rising sea levels from global warming means more coastal flooding

89
Natural Capital Degradation: Hillside Before and After Deforestation
Figure 13.25: Natural capital degradation. These diagrams show a hillside before and after deforestation. Once a hillside has been deforested for timber, fuelwood, livestock grazing, or unsustainable farming, water from precipitation rushes down the denuded slopes, erodes precious topsoil, and can increase flooding and pollution in local streams. Such deforestation can also increase landslides and mudflows. A 3,000-year-old Chinese proverb says, “To protect your rivers, protect your mountains.” See an animation based on this figure at CengageNOW. Question: How might a drought in this area make these effects even worse? Fig , p. 340

90
Diverse ecological habitat Evapotranspiration
Trees reduce soil erosion from heavy rain and wind Agricultural land Figure 13.25: Natural capital degradation. These diagrams show a hillside before and after deforestation. Once a hillside has been deforested for timber, fuelwood, livestock grazing, or unsustainable farming, water from precipitation rushes down the denuded slopes, erodes precious topsoil, and can increase flooding and pollution in local streams. Such deforestation can also increase landslides and mudflows. A 3,000-year-old Chinese proverb says, “To protect your rivers, protect your mountains.” See an animation based on this figure at CengageNOW. Question: How might a drought in this area make these effects even worse? Tree roots stabilize soil Vegetation releases water slowly and reduces flooding Forested Hillside Fig a, p. 340

91
Evapotranspiration decreases Roads destabilize hillsides
Tree plantation Evapotranspiration decreases Roads destabilize hillsides Overgrazing accelerates soil erosion by water and wind Winds remove fragile topsoil Agricultural land is flooded and silted up Gullies and landslides Figure 13.25: Natural capital degradation. These diagrams show a hillside before and after deforestation. Once a hillside has been deforested for timber, fuelwood, livestock grazing, or unsustainable farming, water from precipitation rushes down the denuded slopes, erodes precious topsoil, and can increase flooding and pollution in local streams. Such deforestation can also increase landslides and mudflows. A 3,000-year-old Chinese proverb says, “To protect your rivers, protect your mountains.” See an animation based on this figure at CengageNOW. Question: How might a drought in this area make these effects even worse? Heavy rain erodes topsoil Silt from erosion fills rivers and reservoirs Rapid runoff causes flooding After Deforestation Fig b, p. 340

92
Forested Hillside After Deforestation Diverse ecological habitat
Evapotranspiration Trees reduce soil erosion from heavy rain and wind Tree roots stabilize soil Vegetation releases water slowly and reduces flooding Forested Hillside Agricultural land Stepped Art Tree plantation Roads destabilize hillsides Overgrazing accelerates soil erosion by water and wind Winds remove fragile topsoil Agricultural land is flooded and silted up Gullies and landslides Heavy rain erodes topsoil Silt from erosion fills rivers and reservoirs Rapid runoff causes flooding After Deforestation Evapotranspiration decreases Fig , p. 340

93
Deforestation Above China’s Yangtze River Contribute to Erosion and Floods
Figure 13.26: Deforestation of hills and mountains in China’s Yangtze River Basin contributed to increased flooding, topsoil erosion, and the flow of eroded sediment into the Yangtze River. Because of these harmful effects, China stopped the deforestation and established a massive tree-planting program to reforest the degraded land. Fig , p. 341

94
Case Study: Living Dangerously on Floodplains in Bangladesh
Dense population on coastal floodplain Moderate floods maintain fertile soil Increased frequency of large floods Effects of development in the Himalayan foothills Destruction of coastal wetlands: mangrove forests

95
We Can Reduce Flood Risks
Rely more on nature’s systems Wetlands Natural vegetation in watersheds Rely less on engineering devices Dams Levees Channelized streams

96
Solutions: Reducing Flood Damage
Figure 13.27: These are some methods for reducing the harmful effects of flooding (Concept 13-4). Questions: Which two of these solutions do you think are the most important? Why? Fig , p. 342
. Questions: Which two of these solutions do you think are the most important Why Fig , p")
97
Solutions Reducing Flood Damage
Prevention Control Preserve forests on watersheds Straighten and deepen streams (channelization) Preserve and restore wetlands in floodplains Build levees or floodwalls along streams Tax development on floodplains Figure 13.27: These are some methods for reducing the harmful effects of flooding (Concept 13-4). Questions: Which two of these solutions do you think are the most important? Why? Use floodplains primarily for recharging aquifers, sustainable agriculture and forestry Build dams Fig , p. 342
 Preserve and restore wetlands in floodplains. Build levees or floodwalls along streams. Tax development on floodplains. Figure 13.27: These are some methods for reducing the harmful effects of flooding (Concept 13-4). Questions: Which two of these solutions do you think are the most important Why Use floodplains primarily for recharging aquifers, sustainable agriculture and forestry. Build dams. Fig , p")
98
Three Big Ideas One of the world’s major environmental problems is the growing shortage of freshwater in many parts of the world. We can increase water supplies in water-short areas in a number of ways, but the most important way is to reduce overall water use and waste by using water more sustainably.

99
Three Big Ideas We can use water more sustainably by cutting water waste, raising water prices, slowing population growth, and protecting aquifers, forests, and other ecosystems that store and release water.

Similar presentations


 Why is water so important? Earth as a watery world:>")