Download presentation
Presentation is loading. Please wait.

1
ENGM 620: New Magnificent 7 New Magnificent 7– 16 October 2010 Quality Tools –Ishikawa’s Basic Seven –The New Seven –Bonus Tools

2
Affinity Diagram Useful in grouping and ordering ideas Pioneered by social scientists Best done in a group with moveable card (think index cards or sticky notes)
")
3
Tools (Affinity Diagrams) Developed by Kawakita Jiro, Japanese Anthropologist Technique for gathering and organizing a large number of ideas or facts Used when –Facts or thoughts are in chaos –Issues seem to large or complex –Breakthrough in traditional concepts is needed
 Developed by Kawakita Jiro, Japanese Anthropologist Technique for gathering and organizing a large number of ideas or facts Used when –Facts or thoughts are in chaos –Issues seem to large or complex –Breakthrough in traditional concepts is needed")
4
Tools (Affinity Diagram) Assemble the right team Identify issue to be solved Generate and record ideas –Brainstorming Display completed cards –flip charts, post-it notes Arrange cards into related groupings Create Header cards Draw finished Affinity Diagram
 Assemble the right team Identify issue to be solved Generate and record ideas –Brainstorming Display completed cards –flip charts, post-it notes Arrange cards into related groupings Create Header cards Draw finished Affinity Diagram")
5
Affinity Diagram Customer Value Work Environ. Customer Service ROI Technology Product Innovation Low Price Low Maint. High Quality Motivated Empl. Teamwork Employee Growth Responsive Tech. Support Quick Delivery Courteous Orders High ROI Low Costs Growth in Value Constant InnovationUnique Products Small Light Designs Innovative features

6
Interrelationship Digraph Starts from the Affinity Diagram What other issues are caused or influenced by this issue? Connect with arrows Issues with most incoming arrows are key factors

7
Interrelationship Digraph Customer Value Work Environ. Customer Service ROI Technology Product Innovation

8
Tree Diagram Starts from the Affinity Diagram Used to identify the steps needed to address the given problem

9
Tools (Tree Diagram) Systematically maps out in increasing detail the full range of paths and tasks that need to be accomplished in order to achieve a primary goal and every related subgoal. When to use –Tasks have focus but are not simple assignable jobs –Known that implementation will be complex –Strong consequences for missing key tasks –Simple task has run into repeated roadblocks in implementation

10
Tools (Tree Diagram) Steps –Choose tree diagram goal statement –Assemble right team –Generate major tree headings –Complete diagram under each major path –Review for logical flow
 Steps –Choose tree diagram goal statement –Assemble right team –Generate major tree headings –Complete diagram under each major path –Review for logical flow")
11
Tree Diagrams Timely Closings Communication Effective Service Loan Products Timely & Accurate Status Rpts Notification of Industry Changes Consistent & Accurate Information Mutual Job Understanding Modem link between computers Reliability Flexibility Prior Approvals Expeditious Process Buyer Orientation Professionalism Innovation Flexibility of programs Diversity of programs Competitive rates

12
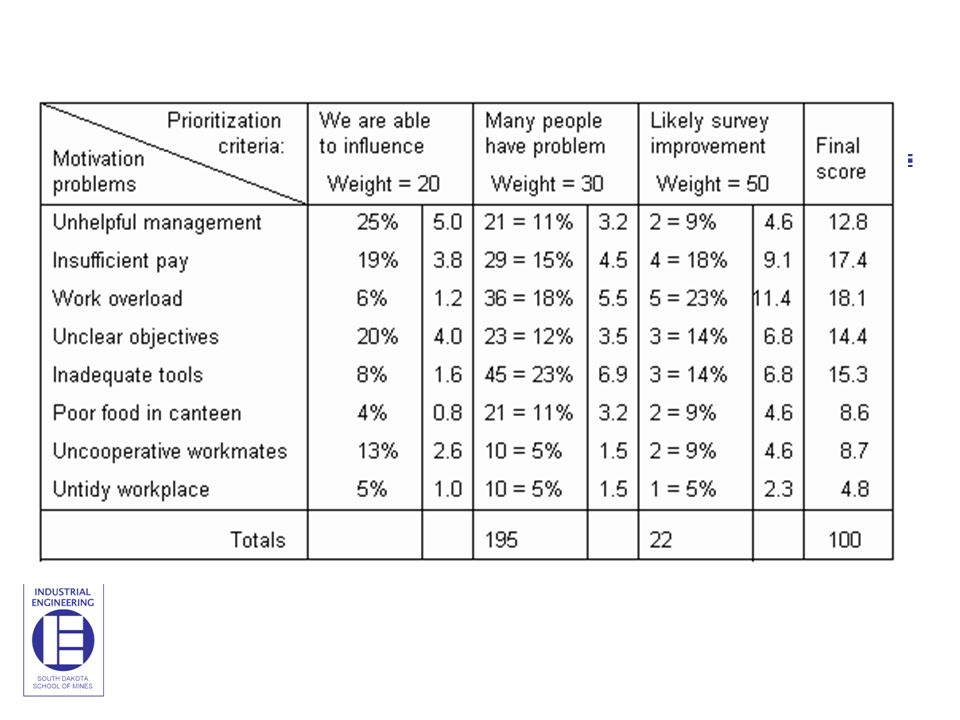
Prioritization Grid Used to make decisions based on multiple criteria –Assign percentages and weights to each criterion and ranking them

13
Prioritization Matrix Data Analysis Importance Best Competitor MicroTech Requirement Weight Evaluation Evaluation Difference Price.2 6 8 +2 Reliability.4 7 8 +1 Delivery.1 8 5 -3 Tech. Support.3 7 5 -2

18
Similar Concept: Matrix Diagrams Actions Goals Improve Improve Develop Work Env. Technology New Products Cost Effectiveness High Quality Shareholder Value Strong Relationship Medium Relationship Weak Relationship

19
Process Decision Program Charts Used to help brainstorm possible contingencies Starts with Tree Diagram turned on its side Add more implementation detail Ask “What could go wrong?” Brainstorm countermeasures

20
Process Decision Program Charts Goal Actions Steps What Ifs Corrections New Comp. Assess NeedsConfigur Sys.Train Users Trn SessionTrn ManualSched. Trn. Short Staff OvertimeTemporary No Time External Trn.

21
Force Field Analysis + Driving Forces - Restraining Forces Ideal State: Rapid City Area Museum Increases tourism Preserves local history Consolidates museums Increases exhibits currently in storage Provide facilities for maintenance, storage & preservation Educational Opportun. Prolongs sales tax increase Reduces $ for education Reduces $ for recreation Existing facilities

22
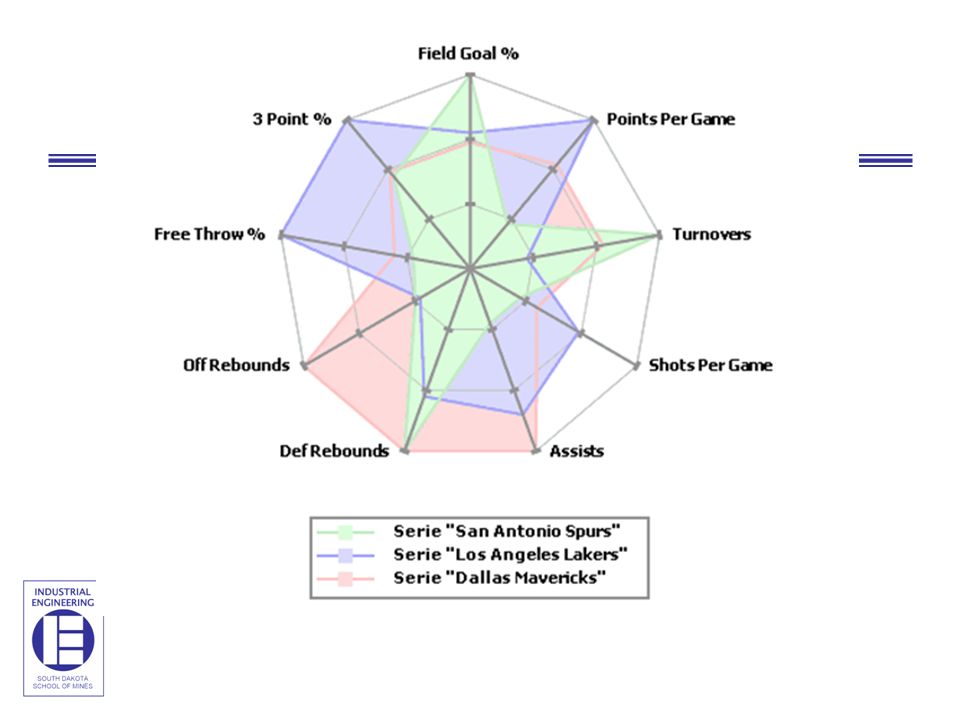
Radar (Spider) Chart Planning Process Customer Focus Improvement Process Mgmt. Participation
 Chart Planning Process Customer Focus Improvement Process Mgmt. Participation")
24
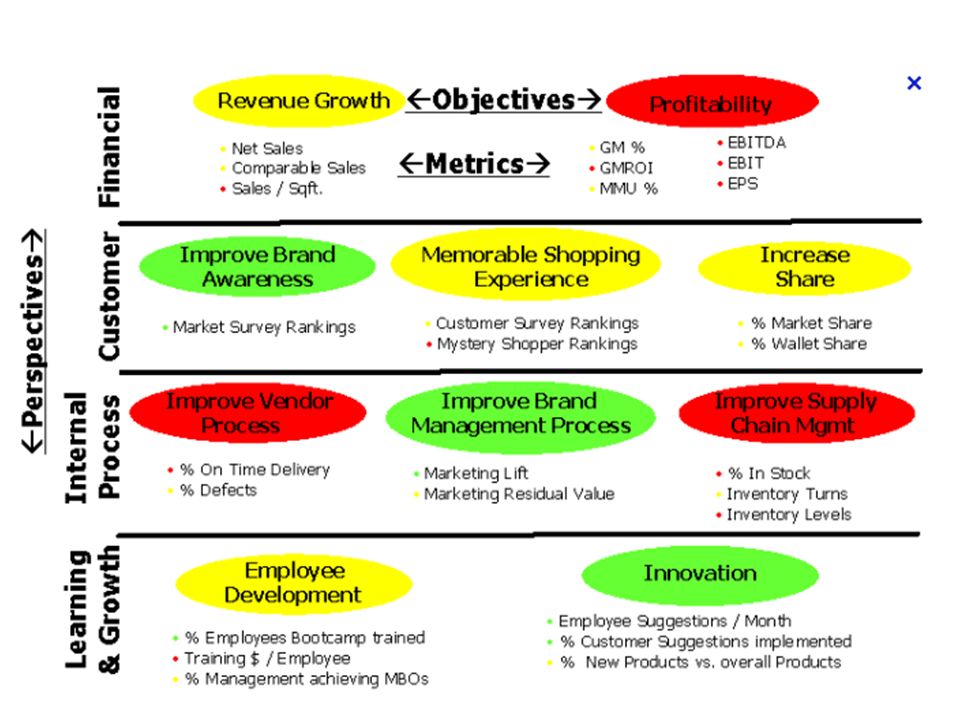
Balanced Scorecard

28
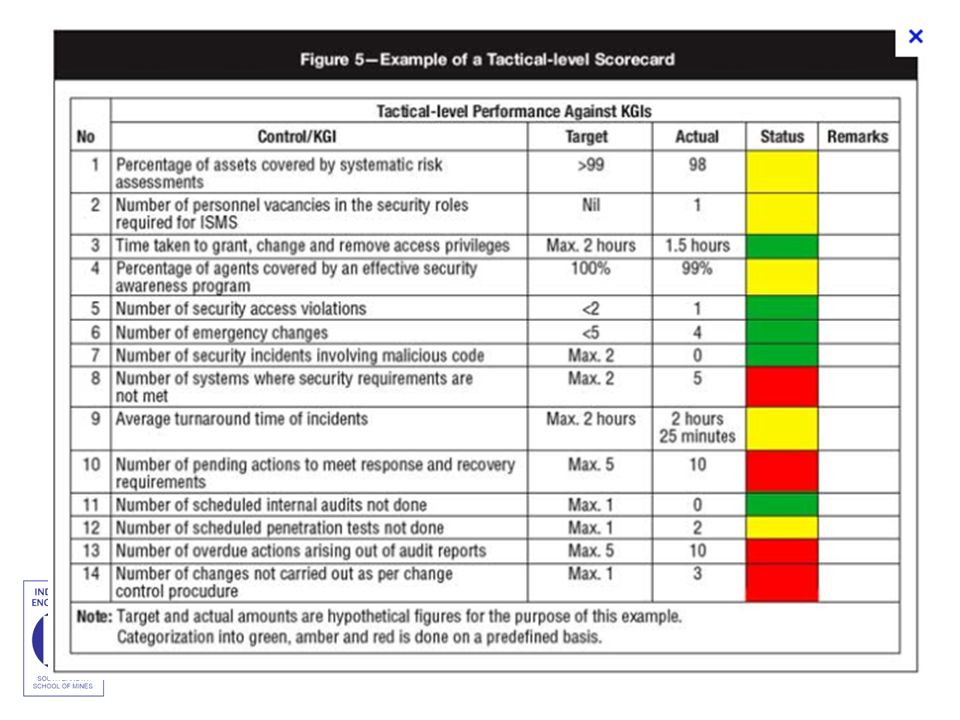
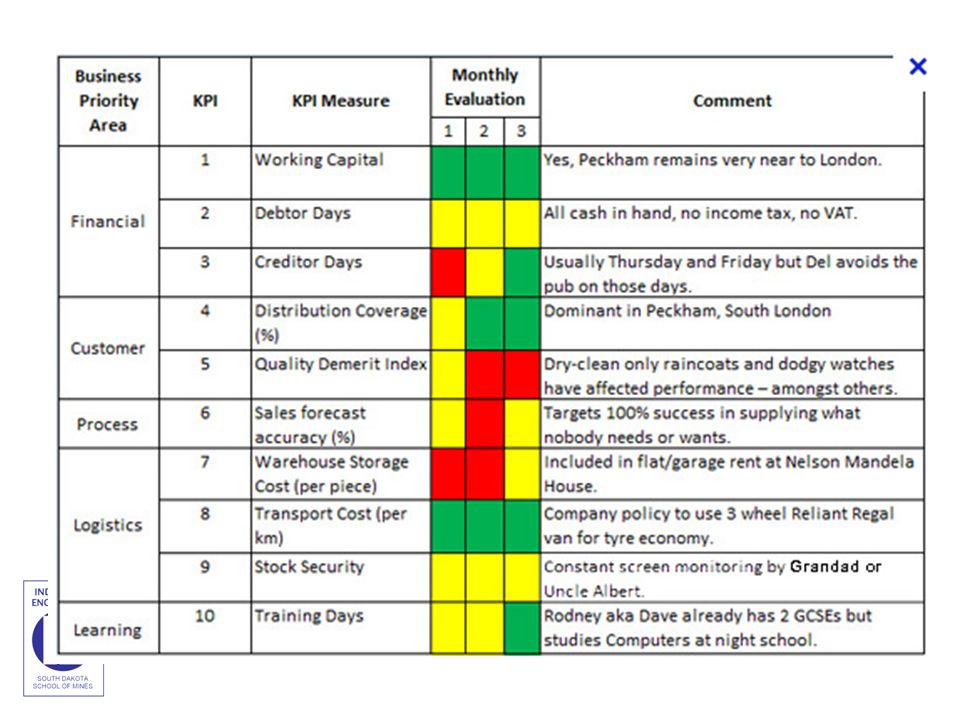
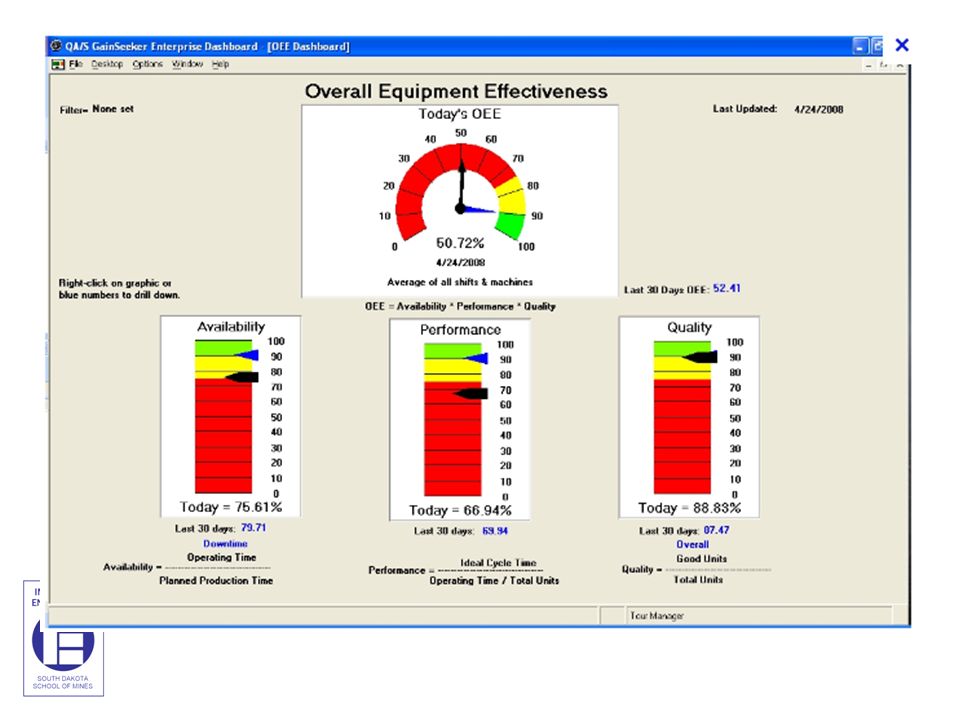
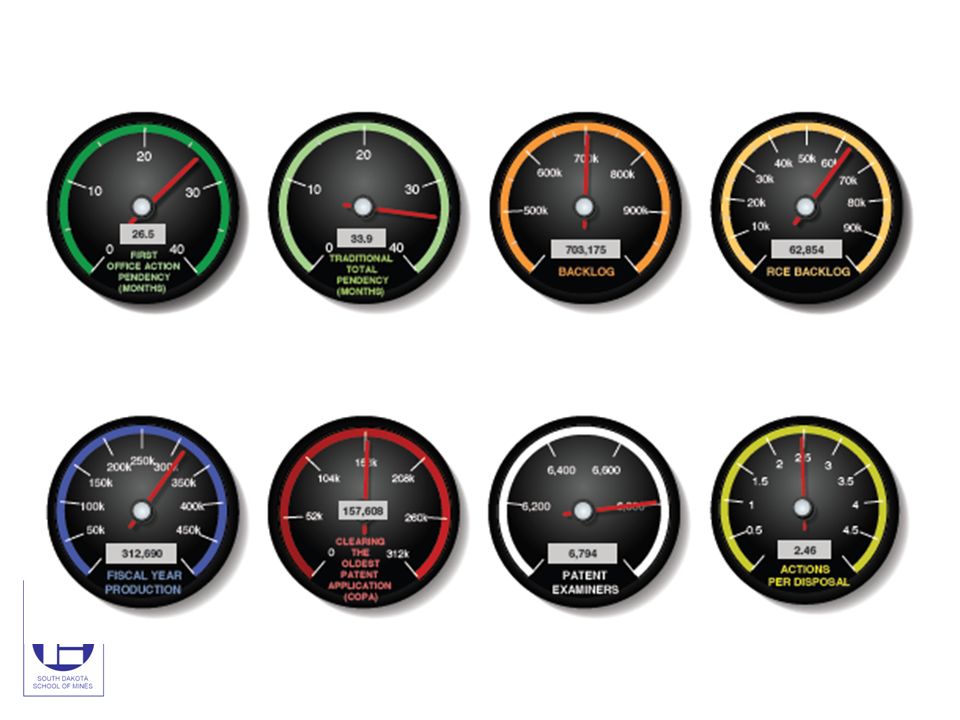
Dashboard

31
Following Class Homework –Ch. 10 Disc. Questions 7, 9, 15, 20 –Ch. 10 Problems 7, 8, 13, 17, 26 Topic –Control Charts, Part I Preparation –Chapter 11

Similar presentations


 Professional Learning Communities (Self Audit) School Improvement Snapshot School Improvement.>")


 Construct,>")


