Download presentation
Presentation is loading. Please wait.

1
7. Aggregate Demand and Supply and Macroeconomic Problems

2
Macroeconomic Objectives Distinction between microeconomics and macroeconomics The major macroeconomic issues –economic growth –unemployment –inflation –balance of payments and exchange rates balance of payments deficits and surpluses exchange rate movements Distinction between microeconomics and macroeconomics The major macroeconomic issues –economic growth –unemployment –inflation –balance of payments and exchange rates balance of payments deficits and surpluses exchange rate movements

3
Economic growth (average % per annum), Unemployment (average %), Inflation (average % per annum)
, Unemployment (average %), Inflation (average % per annum)")
4
The Circular Flow of Income The inner flow

5
Factor payments Factor payments Consumption of domestically produced goods and services (C d ) Consumption of domestically produced goods and services (C d ) The circular flow of income Firms Households
 Consumption of domestically produced goods and services (C d ) The circular flow of income Firms Households")
6
The Circular Flow of Income Withdrawals –net saving –net taxes –import expenditure Injections –investment –government expenditure –export expenditure Withdrawals –net saving –net taxes –import expenditure Injections –investment –government expenditure –export expenditure

7
Factor payments Consumption of domestically produced goods and services (C d ) Investment (I) Government expenditure (G) Government Export expenditure (X) Export BANKS, etc Net saving (S) Net saving (S) GOV. Net taxes (T) Net ABROAD Import expenditure (M) Import The circular flow of income WITHDRAWALS INJECTIONS
 Net ABROAD Import expenditure (M) Import The circular flow of income WITHDRAWALS INJECTIONS.")
8
The Circular Flow of Income The relationship between injections and withdrawals –the links between them The relationship between injections and withdrawals –the links between them

9
Factor payments Consumption of domestically produced goods and services (C d ) Investment (I) Government expenditure (G) Government Export expenditure (X) Export BANKS, etc Net saving (S) Net saving (S) GOV. Net taxes (T) Net ABROAD Import expenditure (M) Import The circular flow of income WITHDRAWALS INJECTIONS
 Net ABROAD Import expenditure (M) Import The circular flow of income WITHDRAWALS INJECTIONS.")
10
The Circular Flow of Income The relationship between injections and withdrawals –the links between them –planned injections may not equal planned withdrawals The relationship between injections and withdrawals –the links between them –planned injections may not equal planned withdrawals

11
The Circular Flow of Income The relationship between injections and withdrawals –the links between them –planned injections may not equal planned withdrawals Equilibrium in the circular flow The relationship between injections and withdrawals –the links between them –planned injections may not equal planned withdrawals Equilibrium in the circular flow

12
Factor payments Consumption of domestically produced goods and services (C d ) Investment (I) Government expenditure (G) Government Export expenditure (X) Export BANKS, etc Net saving (S) Net saving (S) GOV. Net taxes (T) Net ABROAD Import expenditure (M) Import The circular flow of income WITHDRAWALS INJECTIONS
 Net ABROAD Import expenditure (M) Import The circular flow of income WITHDRAWALS INJECTIONS.")
13
The Circular Flow of Income The relationship between injections and withdrawals –the links between them –planned injections may not equal planned withdrawals Equilibrium in the circular flow The circular flow and the four macroeconomic objectives The relationship between injections and withdrawals –the links between them –planned injections may not equal planned withdrawals Equilibrium in the circular flow The circular flow and the four macroeconomic objectives

14
Factor payments Consumption of domestically produced goods and services (C d ) Investment (I) Government expenditure (G) Government Export expenditure (X) Export BANKS, etc Net saving (S) Net saving (S) GOV. Net taxes (T) Net ABROAD Import expenditure (M) Import The circular flow of income WITHDRAWALS INJECTIONS
 Net ABROAD Import expenditure (M) Import The circular flow of income WITHDRAWALS INJECTIONS.")
15
Measuring national income GDP: the measure of national income Methods of measuring GDP –the product approach –the income approach –the expenditure approach The product approach –measuring GVA GDP: the measure of national income Methods of measuring GDP –the product approach –the income approach –the expenditure approach The product approach –measuring GVA

16
Agriculture, forestry and fishing £9 656 m Mining, energy and water supply £29 485 m Manufacturing £147 306 m Construction £39 262 m Wholesale and retail trade; repairs £89 392 m Hotels and restaurants £23 678m Transport and communication £63 340 m Banking, finance, insurance, etc. £17 737 m Letting of property £159 240 m Public administration and defence £40 495 m Education, health and social work £89 041 m Other services £38 912 m Gross value added (GVA) at basic prices £747 544 m 1.3 3.9 19.7 5.3 12.0 3.2 8.4 2.4 21.3 5.4 11.9 5.2 100.0 Percentage of GVA UK GVA product-based measure: 1998
 at basic prices £ m Percentage of GVA UK GVA product-based measure:")
17
Measuring national income GDP: the measure of national income Methods of measuring GDP –the product approach –the income approach –the expenditure approach The product approach –measuring GVA The income approach GDP: the measure of national income Methods of measuring GDP –the product approach –the income approach –the expenditure approach The product approach –measuring GVA The income approach

18
62.0 29.9 5.8 2.3 100.0 Compensation of employees (wages and salaries) £463 398 m Operating surplus (gross profit, rent and interest of firms government and other institutions) £223 212 m Mixed incomes £43 379 m Tax less subsidies on production (other than those on products) plus statistical discrepancy £17 555 m Gross value added (GVA) at basic prices £747 544m UK GVA by category of income: 1998 Percentage of GVA
 £ m Operating surplus (gross profit, rent and interest of firms government and other institutions) £ m Mixed incomes £ m Tax less subsidies on production (other than those on products) plus statistical discrepancy £ m Gross value added (GVA) at basic prices £ m UK GVA by category of income: 1998 Percentage of GVA")
19
Measuring national income GDP: the measure of national income Methods of measuring GDP –the product approach –the income approach –the expenditure approach The product approach –measuring GVA The income approach –from GVA to GDP GDP: the measure of national income Methods of measuring GDP –the product approach –the income approach –the expenditure approach The product approach –measuring GVA The income approach –from GVA to GDP

20
Gross value added (GVA) at basic prices £747 544m UK GDP: 1998
 at basic prices £ m UK GDP: 1998")
21
Gross value added (GVA) at basic prices £747 544m plus Taxes on products£103 634m UK GDP: 1998
 at basic prices £ m plus Taxes on products£ m UK GDP: 1998")
22
Gross value added (GVA) at basic prices £747 544m plus Taxes on products£103 634m less Subsidies on products £7 453m UK GDP: 1998
 at basic prices £ m plus Taxes on products£ m less Subsidies on products £7 453m UK GDP: 1998")
23
Gross value added (GVA) at basic prices £747 544m plus Taxes on products£103 634m less Subsidies on products £7 453m GDP (at market prices) £843 725m UK GDP: 1998
 at basic prices £ m plus Taxes on products£ m less Subsidies on products £7 453m GDP (at market prices) £ m UK GDP: 1998")
24
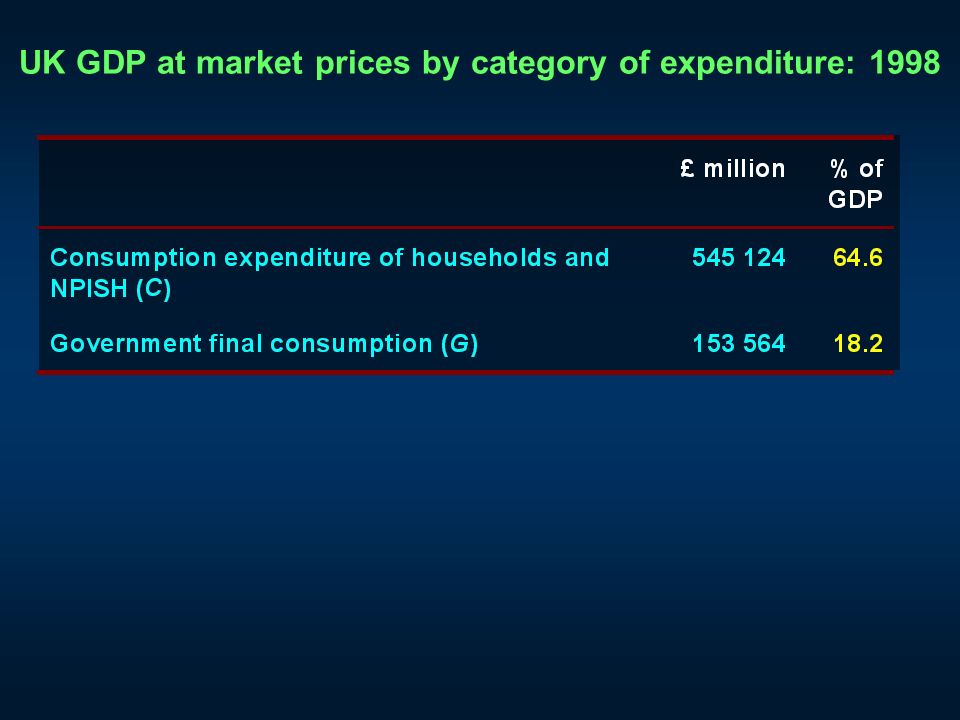
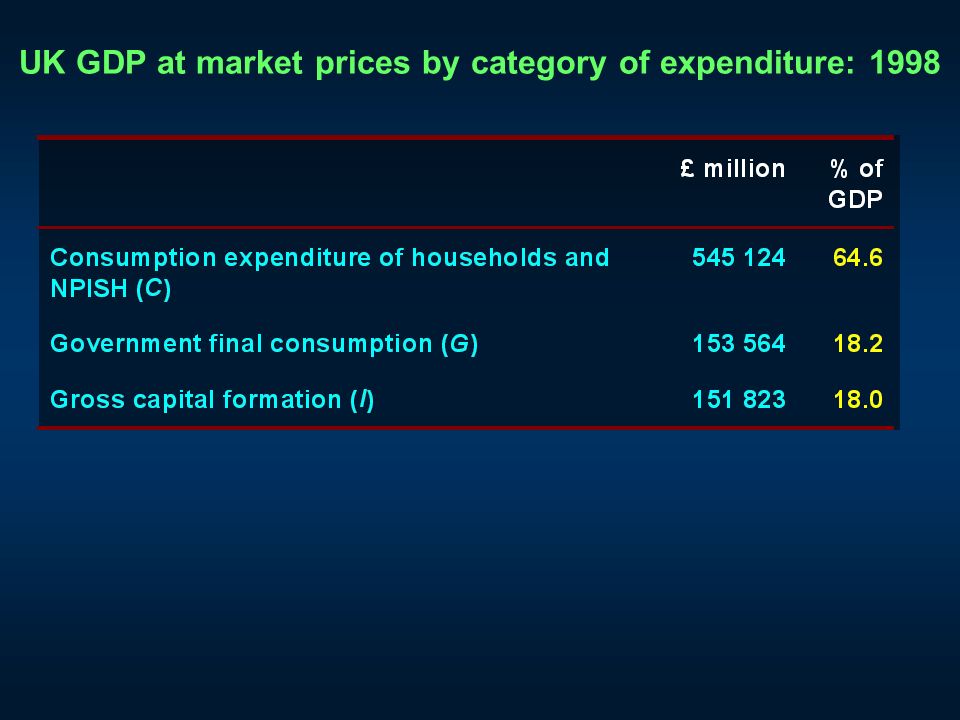
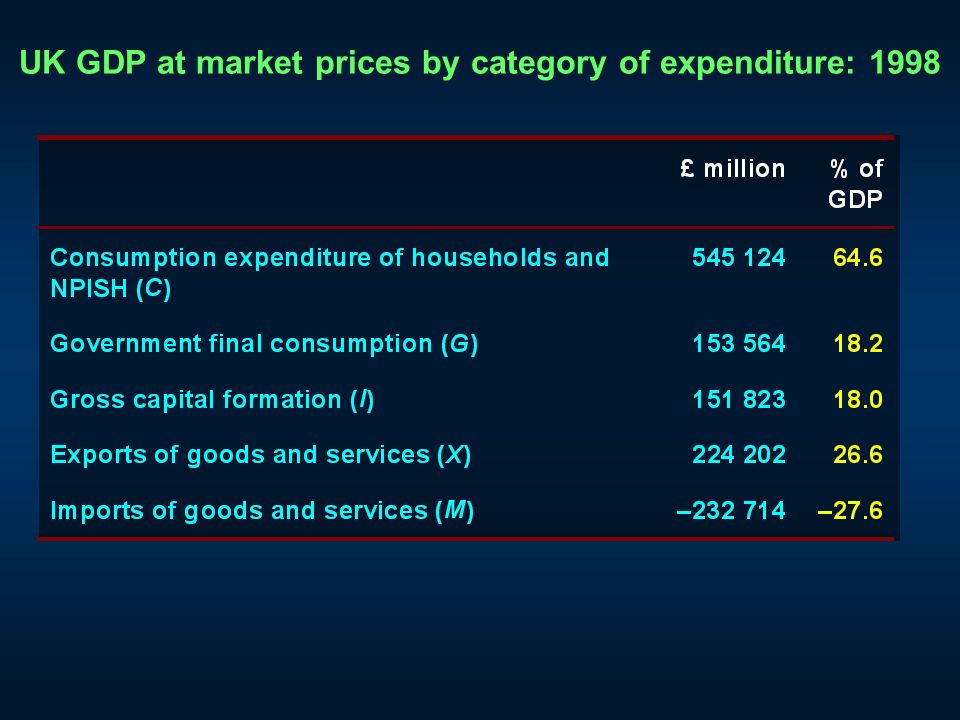
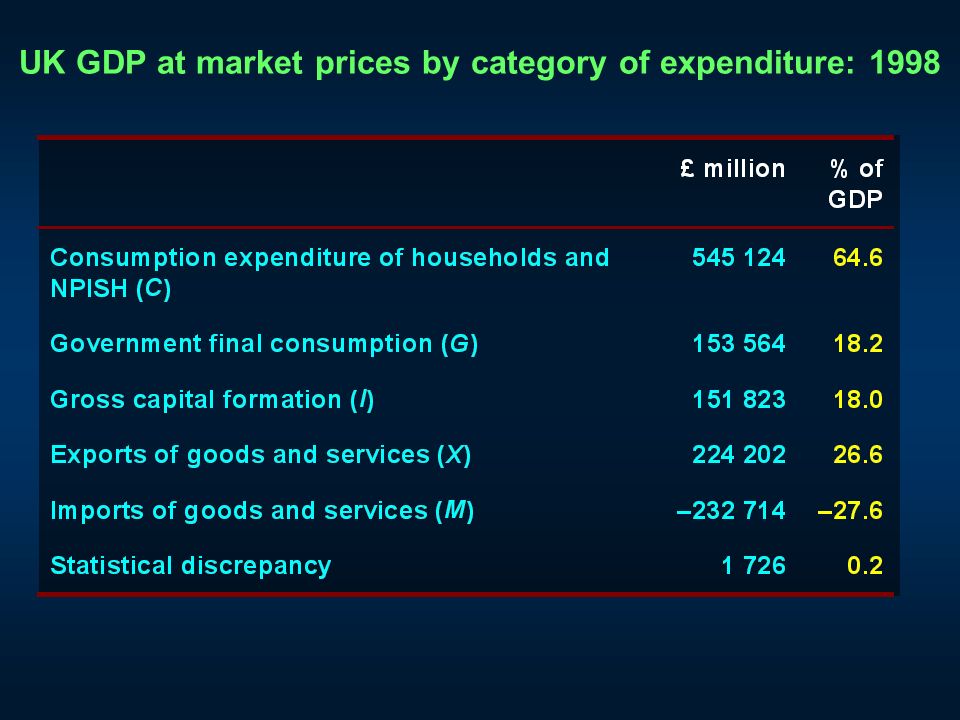
Measuring national income GDP: the measure of national income Methods of measuring GDP –the product approach –the income approach –the expenditure approach The product approach –measuring GVA The income approach The expenditure approach GDP: the measure of national income Methods of measuring GDP –the product approach –the income approach –the expenditure approach The product approach –measuring GVA The income approach The expenditure approach

25
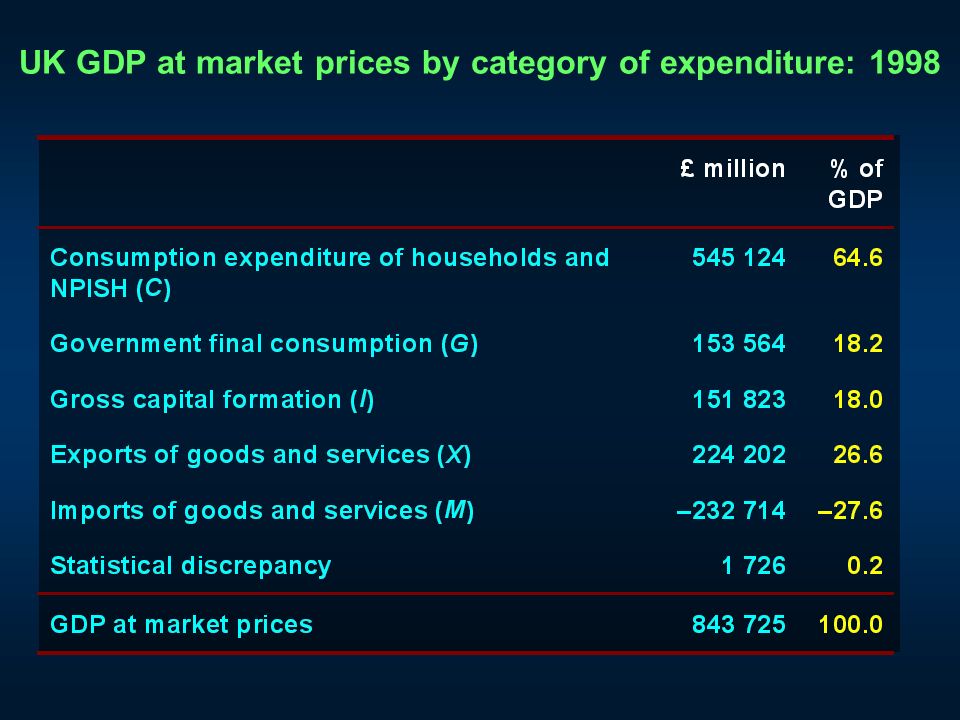
UK GDP at market prices by category of expenditure: 1998

31
Measuring national income GDP: the measure of national income The product approach The income approach The expenditure approach From GDP to net national income (NNY) GDP: the measure of national income The product approach The income approach The expenditure approach From GDP to net national income (NNY)
 GDP: the measure of national income The product approach The income approach The expenditure approach From GDP to net national income (NNY)")
32
UK GDP, GNY and NNY at market prices: 1998

34
Economic Growth and the Business Cycle Growth in actual and potential output Economic growth and the business cycle –fluctuations in actual growth Growth in actual and potential output Economic growth and the business cycle –fluctuations in actual growth

35
O National output Time Potential output Actual output The business cycle

36
Economic Growth and the Business Cycle Growth in actual and potential output Economic growth and the business cycle –fluctuations in actual growth –the phases of the business cycle Growth in actual and potential output Economic growth and the business cycle –fluctuations in actual growth –the phases of the business cycle

37
O National output Time Potential output Actual output 1 2 3 4 1 2 3 4 The business cycle

38
Economic Growth and the Business Cycle Growth in actual and potential output Economic growth and the business cycle –fluctuations in actual growth –the phases of the business cycle –trend growth Growth in actual and potential output Economic growth and the business cycle –fluctuations in actual growth –the phases of the business cycle –trend growth

39
O National output Time Potential output Actual output Trend output The business cycle

40
Economic Growth and the Business Cycle Economic growth and the business cycle –fluctuations in actual growth –the phases of the business cycle –trend growth –the business cycle in practice Economic growth and the business cycle –fluctuations in actual growth –the phases of the business cycle –trend growth –the business cycle in practice

41
Economic Growth and the Business Cycle Economic growth and the business cycle –fluctuations in actual growth –the phases of the business cycle –trend growth –the business cycle in practice the irregularity of the cycle Economic growth and the business cycle –fluctuations in actual growth –the phases of the business cycle –trend growth –the business cycle in practice the irregularity of the cycle

42
Economic Growth and the Business Cycle Economic growth and the business cycle –fluctuations in actual growth –the phases of the business cycle –trend growth –the business cycle in practice the irregularity of the cycle the length of the phases Economic growth and the business cycle –fluctuations in actual growth –the phases of the business cycle –trend growth –the business cycle in practice the irregularity of the cycle the length of the phases

43
Economic Growth and the Business Cycle Economic growth and the business cycle –fluctuations in actual growth –the phases of the business cycle –trend growth –the business cycle in practice the irregularity of the cycle the length of the phases the magnitude of the phases Economic growth and the business cycle –fluctuations in actual growth –the phases of the business cycle –trend growth –the business cycle in practice the irregularity of the cycle the length of the phases the magnitude of the phases

44
Economic Growth and the Business Cycle Causes of actual growth –aggregate demand –aggregate demand relative to potential output Actual growth in practice –experience since 1970 Causes of actual growth –aggregate demand –aggregate demand relative to potential output Actual growth in practice –experience since 1970

45
Annual growth rate (%) UK Growth rates in selected industrial countries
 UK Growth rates in selected industrial countries")
46
Annual growth rate (%) UK Growth rates in selected industrial countries
 UK Growth rates in selected industrial countries")
47
Annual growth rate (%) UK France Growth rates in selected industrial countries
 UK France Growth rates in selected industrial countries")
48
Annual growth rate (%) UK France Growth rates in selected industrial countries
 UK France Growth rates in selected industrial countries")
49
Annual growth rate (%) UK France Germany Growth rates in selected industrial countries
 UK France Germany Growth rates in selected industrial countries")
50
Annual growth rate (%) UK France Germany Growth rates in selected industrial countries
 UK France Germany Growth rates in selected industrial countries")
51
Annual growth rate (%) UK France USA Germany Growth rates in selected industrial countries
 UK France USA Germany Growth rates in selected industrial countries")
52
Annual growth rate (%) UK France USA Germany Growth rates in selected industrial countries
 UK France USA Germany Growth rates in selected industrial countries")
53
Annual growth rate (%) UK France USA Germany Japan Growth rates in selected industrial countries
 UK France USA Germany Japan Growth rates in selected industrial countries")
54
Annual growth rate (%) UK France USA Germany Japan Growth rates in selected industrial countries
 UK France USA Germany Japan Growth rates in selected industrial countries")
55
Economic Growth and the Business Cycle Causes of potential growth –increases in the quantity of factors capital labour land and raw materials the problem of diminishing returns –increases in factor productivity Policies to achieve growth –demand-side and supply-side policies –market-orientated & interventionist policies Causes of potential growth –increases in the quantity of factors capital labour land and raw materials the problem of diminishing returns –increases in factor productivity Policies to achieve growth –demand-side and supply-side policies –market-orientated & interventionist policies

56
Unemployment The meaning of 'unemployment' Official measures of unemployment –claimant unemployment do claimant statistics give a true picture of unemployment? –standardised unemployment (ILO/OECD) The meaning of 'unemployment' Official measures of unemployment –claimant unemployment do claimant statistics give a true picture of unemployment? –standardised unemployment (ILO/OECD)
 The meaning of unemployment Official measures of unemployment –claimant unemployment do claimant statistics give a true picture of unemployment. –standardised unemployment (ILO/OECD).")
57
Unemployment rates in selected industrial countries UK

58
Unemployment rates in selected industrial countries

59
UK France Unemployment rates in selected industrial countries

60
UK France Unemployment rates in selected industrial countries

61
UK France Germany Unemployment rates in selected industrial countries

62
UK France Germany Unemployment rates in selected industrial countries

63
UK France USA Germany Unemployment rates in selected industrial countries

64
UK France USA Germany Unemployment rates in selected industrial countries

65
UK France USA Germany Japan Unemployment rates in selected industrial countries

66
UK France USA Germany Japan Unemployment rates in selected industrial countries

67
UK France USA Germany Japan OECD Unemployment rates in selected industrial countries

68
UK France USA Germany Japan OECD Unemployment rates in selected industrial countries

69
Unemployment Unemployment and the labour market –the aggregate demand and supply of labour –equilibrium in the model Unemployment and the labour market –the aggregate demand and supply of labour –equilibrium in the model

70
QeQe Aggregate demand and supply of labour O Average (real) wage rate No. of workers AS L AD L WeWe
 wage rate No. of workers AS L AD L WeWe")
71
Unemployment Unemployment and the labour market –the aggregate demand and supply of labour –equilibrium in the model –disequilibrium unemployment Unemployment and the labour market –the aggregate demand and supply of labour –equilibrium in the model –disequilibrium unemployment

72
O Average (real) wage rate No. of workers AS L AD L WeWe W2W2 BA Disequilibrium unemployment Q2Q2 Q1Q1

73
Unemployment Unemployment and the labour market –the aggregate demand and supply of labour –equilibrium in the model –disequilibrium unemployment –equilibrium unemployment Unemployment and the labour market –the aggregate demand and supply of labour –equilibrium in the model –disequilibrium unemployment –equilibrium unemployment

74
Equilibrium unemployment O Average (real) wage rate No. of workers AD L WeWe AS L e QeQe
 wage rate No. of workers AD L WeWe AS L e QeQe")
75
Q2Q2 QeQe O Average (real) wage rate No. of workers AS L AD L WeWe N e d Equilibrium unemployment
 wage rate No. of workers AS L AD L WeWe N e d Equilibrium unemployment")
76
Equilibrium and disequilibrium unemployment O Average (real) wage rate No. of workers AD L WeWe e QeQe AS L

77
O Average (real) wage rate No. of workers AS L AD L WeWe W2W2 ba e Disequilibrium unemployment Equilibrium and disequilibrium unemployment

78
O Average (real) wage rate No. of workers AS L AD L WeWe W2W2 ba e N c Equilibrium unemployment Disequilibrium unemployment Equilibrium and disequilibrium unemployment

79
Unemployment Disequilibrium unemployment –real-wage (classical) unemployment –demand-deficient (cyclical) unemployment –unemployment arising from a growth in the labour supply Disequilibrium unemployment –real-wage (classical) unemployment –demand-deficient (cyclical) unemployment –unemployment arising from a growth in the labour supply
 unemployment –demand-deficient (cyclical) unemployment –unemployment arising from a growth in the labour supply Disequilibrium unemployment –real-wage (classical) unemployment –demand-deficient (cyclical) unemployment –unemployment arising from a growth in the labour supply")
80
Unemployment Equilibrium unemployment –frictional (search) unemployment –structural unemployment changing pattern of demand technological unemployment regional unemployment –seasonal unemployment Equilibrium unemployment –frictional (search) unemployment –structural unemployment changing pattern of demand technological unemployment regional unemployment –seasonal unemployment
 unemployment –structural unemployment changing pattern of demand technological unemployment regional unemployment –seasonal unemployment Equilibrium unemployment –frictional (search) unemployment –structural unemployment changing pattern of demand technological unemployment regional unemployment –seasonal unemployment")
81
Aggregate Demand and Supply The aggregate demand curve

82
O Price level National output AD Aggregate demand and aggregate supply

83
Aggregate Demand and Supply The aggregate demand curve –Why aggregate demand curves slope downwards import effect The aggregate demand curve –Why aggregate demand curves slope downwards import effect

84
O Price level National output AD Aggregate demand and aggregate supply

85
Aggregate Demand and Supply The aggregate demand curve –Why aggregate demand curves slope downwards import effect interest-rate effect The aggregate demand curve –Why aggregate demand curves slope downwards import effect interest-rate effect

86
O Price level National output AD Aggregate demand and aggregate supply

87
Aggregate Demand and Supply The aggregate demand curve –Why aggregate demand curves slope downwards import effect interest-rate effect savings effect The aggregate demand curve –Why aggregate demand curves slope downwards import effect interest-rate effect savings effect

88
O Price level National output AD Aggregate demand and aggregate supply

89
Aggregate Demand and Supply The aggregate demand curve –Why aggregate demand curves slope downwards import effect interest-rate effect savings effect The aggregate supply curve The aggregate demand curve –Why aggregate demand curves slope downwards import effect interest-rate effect savings effect The aggregate supply curve

90
O Price level National output AS AD Aggregate demand and aggregate supply

91
Aggregate Demand and Supply The aggregate demand curve –Why aggregate demand curves slope downwards import effect interest-rate effect savings effect The aggregate supply curve –Why aggregate supply curves generally slope upwards The aggregate demand curve –Why aggregate demand curves slope downwards import effect interest-rate effect savings effect The aggregate supply curve –Why aggregate supply curves generally slope upwards

92
O Price level National output AS AD Aggregate demand and aggregate supply

93
Aggregate Demand and Supply The aggregate demand curve –Why aggregate demand curves slope downwards import effect interest-rate effect savings effect The aggregate supply curve –Why aggregate supply curves generally slope upwards Equilibrium The aggregate demand curve –Why aggregate demand curves slope downwards import effect interest-rate effect savings effect The aggregate supply curve –Why aggregate supply curves generally slope upwards Equilibrium

94
O Price level National output AS AD PePe Aggregate demand and aggregate supply

95
O Price level National output AS AD PePe P2P2 a b Aggregate demand and aggregate supply

96
Aggregate Demand and Supply The aggregate demand curve –Why aggregate demand curves slope downwards import effect interest-rate effect savings effect The aggregate supply curve –Why AS curves generally slope upwards Equilibrium –Effect of a shift in the AD curve The aggregate demand curve –Why aggregate demand curves slope downwards import effect interest-rate effect savings effect The aggregate supply curve –Why AS curves generally slope upwards Equilibrium –Effect of a shift in the AD curve

97
Inflation Defining inflation The costs of inflation –redistribution –uncertainty –balance of payments –resources used to cope with inflation Experience of inflation since 1965 Defining inflation The costs of inflation –redistribution –uncertainty –balance of payments –resources used to cope with inflation Experience of inflation since 1965

98
UK Inflation rates in selected industrial countries

99
UK Inflation rates in selected industrial countries

100
UK EU 15 Inflation rates in selected industrial countries

101
UK EU 15 Inflation rates in selected industrial countries

102
UK EU 15 USA Inflation rates in selected industrial countries

103
UK EU 15 USA Inflation rates in selected industrial countries

104
UK EU 15 Japan USA Inflation rates in selected industrial countries

105
UK EU 15 Japan USA Inflation rates in selected industrial countries

106
UK EU 15 Japan USA OECD Inflation rates in selected industrial countries

107
UK EU 15 Japan USA OECD Inflation rates in selected industrial countries

108
Inflation Types of inflation –demand pull Types of inflation –demand pull

109
Demand-pull inflation O Price level National output AS AD 1 P1P1 Q1Q1

110
O Price level National output AS AD 1 P1P1 Q1Q1 AD 2 Demand-pull inflation

111
O Price level National output AS AD 1 P1P1 Q1Q1 AD 2 P2P2 Q2Q2 Demand-pull inflation

112
Inflation Types of inflation –demand pull –cost push Types of inflation –demand pull –cost push

113
Inflation Types of inflation –demand pull –cost push wage push Types of inflation –demand pull –cost push wage push

114
Inflation Types of inflation –demand pull –cost push wage push profit push Types of inflation –demand pull –cost push wage push profit push

115
Inflation Types of inflation –demand pull –cost push wage push profit push import-price push Types of inflation –demand pull –cost push wage push profit push import-price push

116
Cost-push inflation O Price level National output AS 1 AD P1P1 Q1Q1

117
O Price level National output AS 1 AD P1P1 Q1Q1 AS 2 Cost-push inflation

118
O Price level National output AS 1 AD P1P1 Q1Q1 AS 2 P2P2 Q2Q2 Cost-push inflation

119
Inflation Types of inflation –demand pull –cost push wage push profit push import-price push –the interaction of demand-pull and cost- push inflation Types of inflation –demand pull –cost push wage push profit push import-price push –the interaction of demand-pull and cost- push inflation

120
The interaction of demand-pull and cost-push inflation O Price level National output AS 1 AD 1 P1P1

121
O Price level National output AS 1 AD 1 P1P1 AS 2 AD 2 P2P2 The interaction of demand-pull and cost-push inflation

122
O Price level National output AS 1 AD 1 P1P1 AD 2 P2P2 AS 3 AD 3 P3P3 AS 2 The interaction of demand-pull and cost-push inflation

123
Inflation Types of inflation –demand pull –cost push wage push profit push import-price push –the interaction of demand-pull and cost- push inflation –structural (demand shift) Types of inflation –demand pull –cost push wage push profit push import-price push –the interaction of demand-pull and cost- push inflation –structural (demand shift)
 Types of inflation –demand pull –cost push wage push profit push import-price push –the interaction of demand-pull and cost- push inflation –structural (demand shift)")
124
Inflation Types of inflation –demand pull –cost push wage push profit push import-price push –the interaction of demand-pull and cost- push inflation –structural (demand shift) –expectations and inflation Types of inflation –demand pull –cost push wage push profit push import-price push –the interaction of demand-pull and cost- push inflation –structural (demand shift) –expectations and inflation
 –expectations and inflation Types of inflation –demand pull –cost push wage push profit push import-price push –the interaction of demand-pull and cost- push inflation –structural (demand shift) –expectations and inflation")
125
Inflation Policies to tackle inflation –demand-side policies –supply-side policies Policies to tackle inflation –demand-side policies –supply-side policies

Similar presentations


 Chapters 21 & 6 Respectively.>")


: the economy- wide demand for goods and services. Aggregate demand curve relates aggregate expenditure for goods and services to.>")


>")
