Download presentation
Presentation is loading. Please wait.

1
▪ History ▪ Equipment ▪ Image Production/Manipulation

2
▪ 1895 - Roetgen discovers x-rays ▪ 1917 - Radon develops recontruction formulas ▪ 1963 - Cormack develops mathematics for x- ray absoprtion in tissue ▪ 1972 - Housfield demonstrates CT Dateline

3
▪ 1975 - first whole body CT ▪ 1979 - Housfield and Cormack win Nobel prize ▪ 1983 - EBCT ▪ 1989 - spiral CT ▪ 1991 - multi-slice CT

4
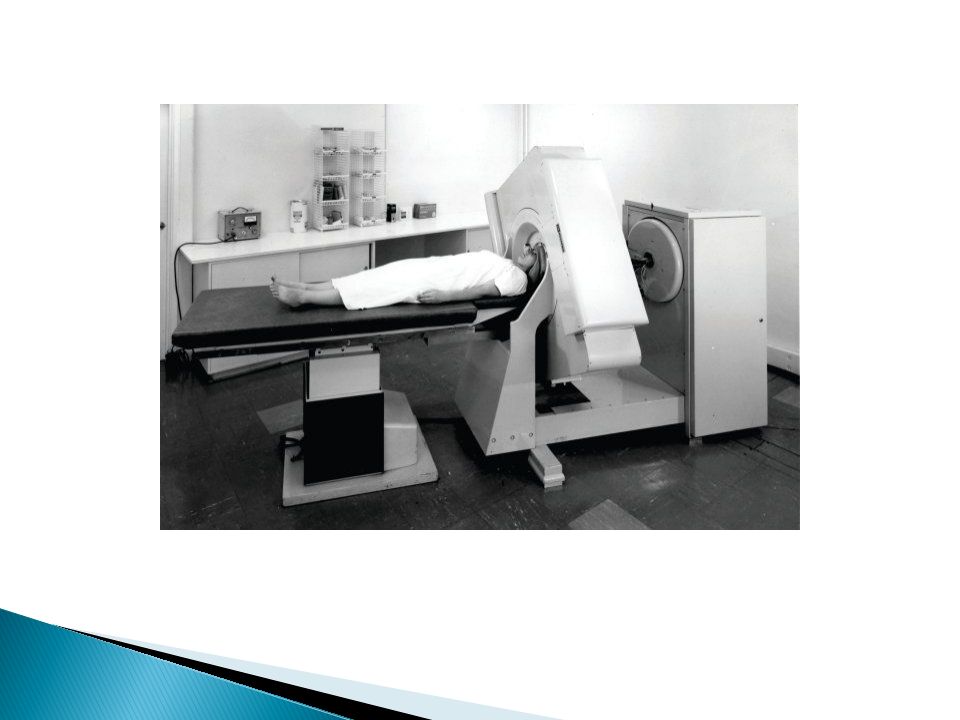
▪ Original idea was to move the patient not the beam. ▸ The intent was to produce a homogeneous or monoenergetic beam. ▪ Original scanner used a radioisotope instead of a tube.

7
▪ To date there have been four accepted generations with some consideration as EBCT to be the fourth. ▪ The first fourth generation scanner was unveiled in 1978 four years after the first scanner.

8
▪ Pencil thin beam - highly collimated ▪ Single radiation detector ▪ 180 translations at 1 degree of rotation ▪ One image projection per translation ▪ 5 minutes of scan time per image ▪ Heads only Translate/rotate

9
▪ Fan shaped beam ▪ Multiple detectors - a detector array ▪ 18 translations with 10 degrees between them. ▪ Multiple image projections per translation ▪ 30 second scan time per image ▪ Head and body imager Translate/rotate

10
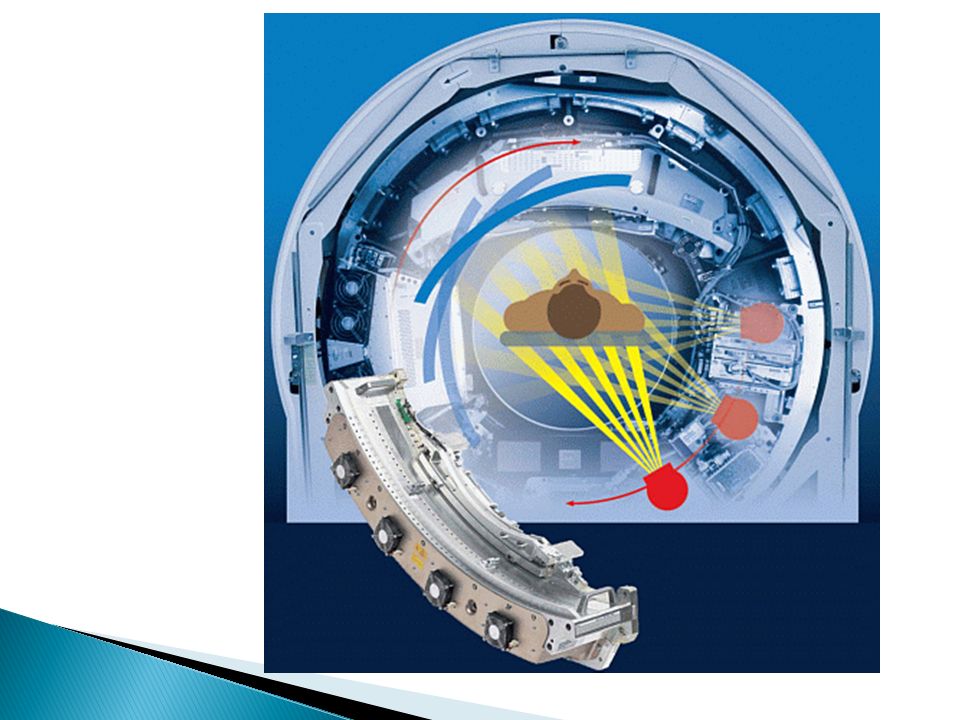
▪ Fan beam that covers the entire width of the patient ▪ Several hundred detectors in a curvilinear detector array ▪ Both the source and the detector array move ▪ Hundreds of projections are obtained during each rotation, thereby producing better spatial and contrast resolution. ▪ Scan time is reduced to one second or less per image Rotate/rotate

11
▪ Still a fan beam ▪ Thousands of detectors are now used ▪ Thousands of projections are acquired producing better image quality ▪ Sub-second scan times ▪ Various arcs of scanning are possible increasing functionality Rotate/stationary

13
▪ Intended for rapid imaging ▪ Scan time less than 100 msec ▪ No tube, instead tungsten rings are used ▪ Four rings allow four slices to be acquired simultaneously ▪ No moving parts

14
▪ Third or fourth generation scanners with constant patient movement ▪ Use slip ring technology ▪ Can cover a lot of anatomy in a short period of time

16
spiralfirst <1 s300 s scan time 1024x102480x80 matrix 1 mm13 mm slice th 15 lp/cm3 lp/cm spatial res

17
CT image circa 1971

18
▪ X-ray source ▪ Detector array ▪ Collimator ▪ High voltage generator

21
▪ 10,000 rpm anodes ▪ 8 MHU ▪ Tube is parallel the patient to reduce anode heel effect ▪ 200 - 800 mA

22
▪ Bow tie filters are used to ‘even out’ the beam intensity at the detectors ▪ Primary purpose is to harden the beam ▸ Reduces artifacts

23
▪ CT uses a high kVp to minimize photoelectric effect ▪ High kVp allows the maximum number of photons to get to the dectector array ▪ All current scanners use high frequency generators ▸ High frequency generators are much smaller than three phase units allowing for a smaller footprint and less voltage fluctuation

24
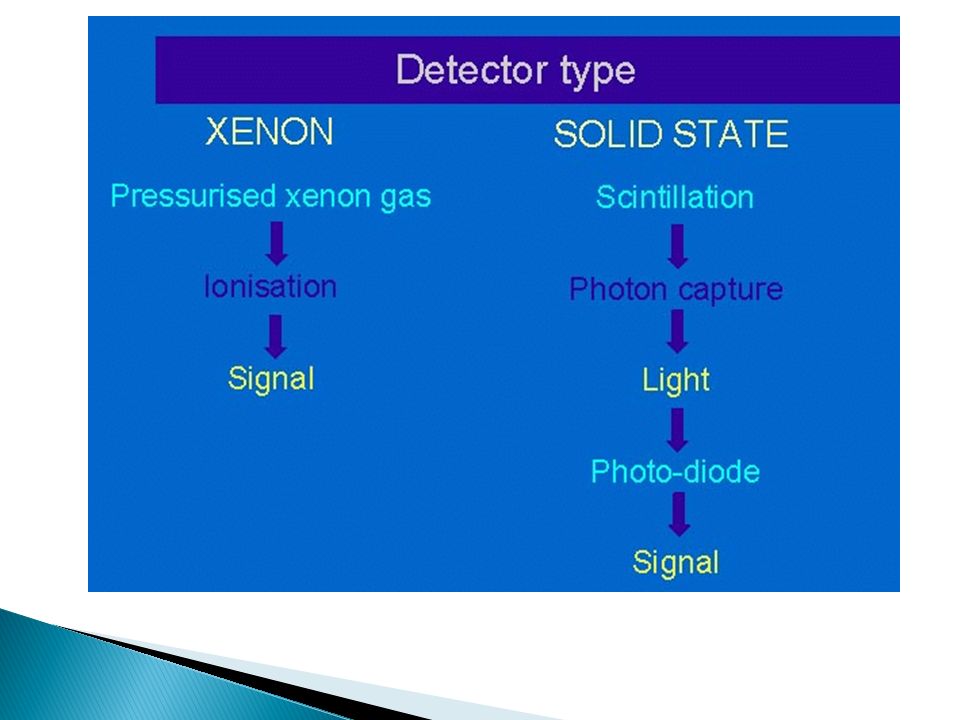
▪ Early scanners used scintillation crystal photomultiplier detectors as a single element ▪ Currently two types of detector arrays ▸ Gas filled ▸ Solid state

25
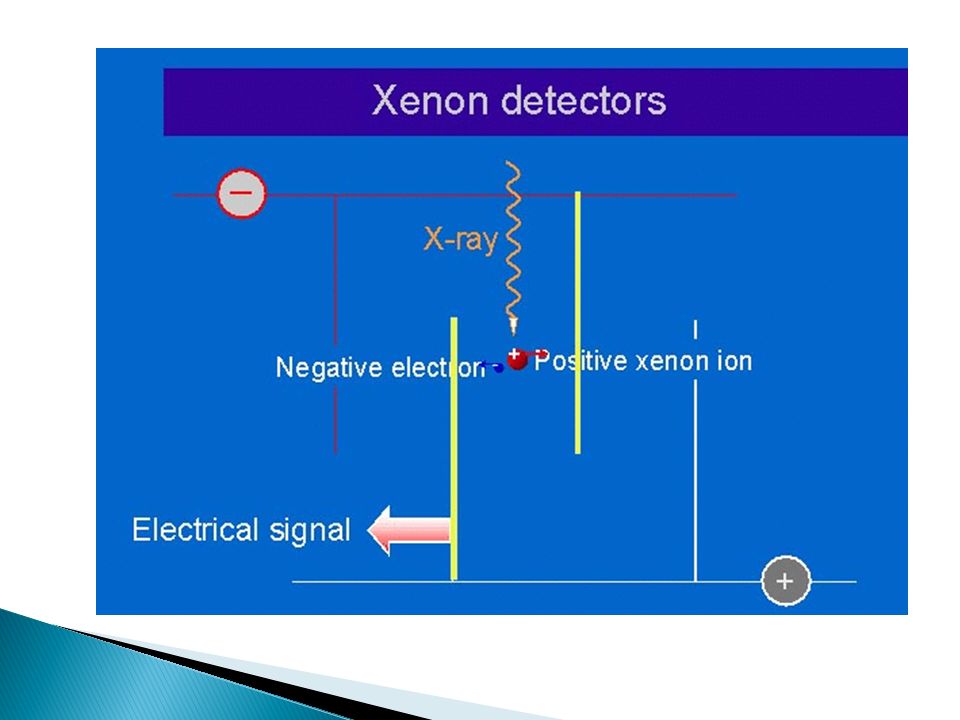
▪ Filled with high pressure xenon ▪ Fast response time with no afterglow or lag ▪ 50% dectection efficiency ▪ Can be tightly packed ▸ Less interspacing, fewer lost photons

26
▪ Ion chambers are approximately 1 mm wide ▪ Geometric efficiency is 90% for the entire array ▪ Total detector efficiency = geometric efficiency x intrinsic efficiency

28
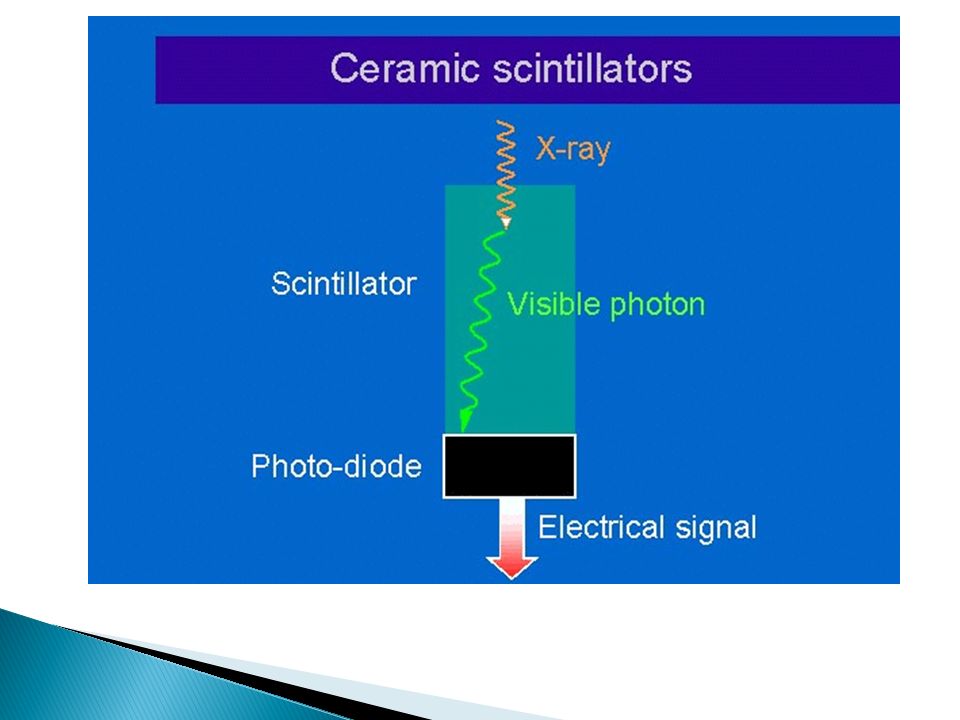
▪ Cadmium tungstate ▸ Scintillator ▪ Material is optically coupled with a photodiode ▪ Nearly 100 % efficiency ▪ Due to design they cannot be tightly packed

29
▪ 80 % total detector efficiency ▪ Automatically recalibrate ▪ Reduced noise ▪ Reduced patient dose ▪ More expensive than gas filled

32
▪ Amplifies the signal ▪ Converts the analog signal to digital(ADC) ▪ Transmits the signal to the computer Located between the detector array and the computer
 ▪ Transmits the signal to the computer Located between the detector array and the computer")
33
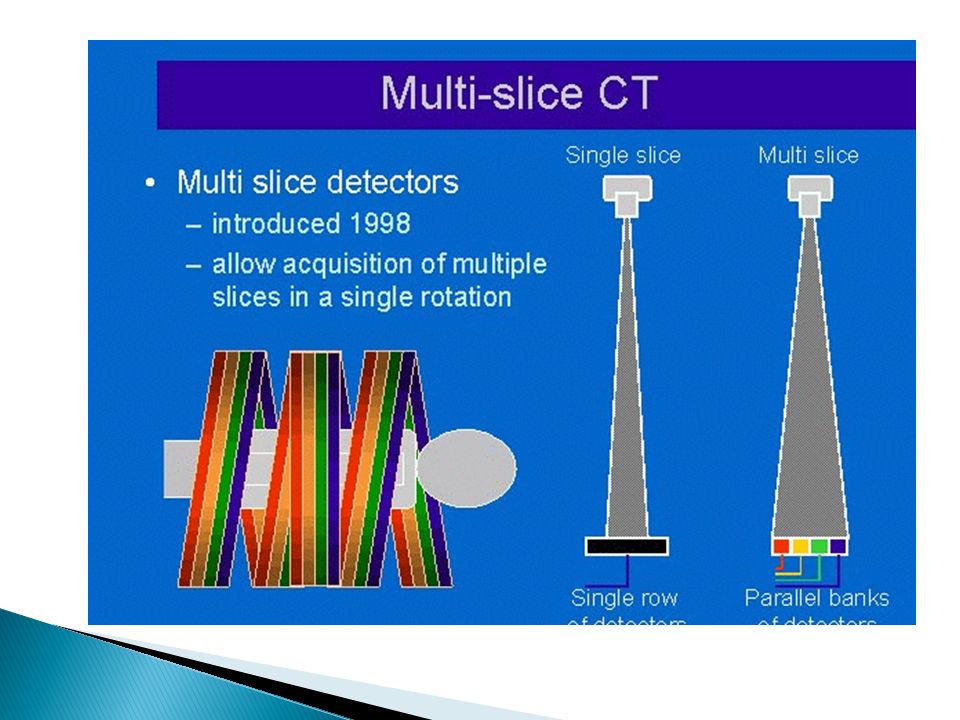
▪ Multiple detector arrays allow for multiple slices to be acquired simultaneously

34
▸ Pre-patient ▪Controls patient dose ▪Determines dose profile ▸ Post-patient ▸ Controls slice thickness

36
▪ Most common process is filtered back projection ▪ Fourier transformation ▪ Analytic ▪ Iterative

39
▪ Data acquisition ▪ Preprocessing ▸ Reformatting and convolution ▪ Image reconstruction ▪ Image display ▪ Post-processing activities

40
▪ Suppress low spatial frequencies resulting in images with high spatial resolution ▸ Bone ▸ Inner ear ▸ High-res chest

41
▪ Suppress high spatial frequencies ▪ Most commonly used filters ▪ Images appear smoother ▸ Less noisy

42
▪ Images are displayed on a matrix ▪ Today most are 512 x 512 or 1024 x 1024 ▸ The original matrix was 80 x 80 ▪ The matrix consists of pixels ▪ Pixels represent voxels

43
▪ The diameter of the reconstructed image is the FoV

44
▪ Generally, pixel size is the limiting factor in spatial resolution. ▪ The smaller the pixel the higher the spatial resolution. ▪ Pixel size (spatial resolution) is determined by matrix size and FoV.
 is determined by matrix size and FoV..")
45
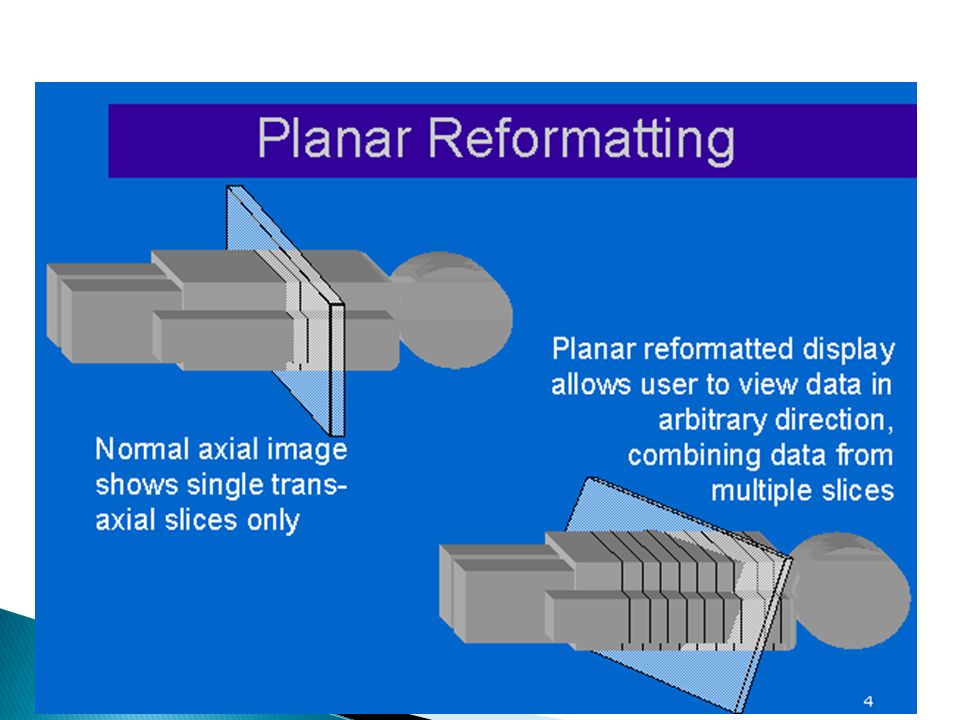
▪ Post-processing does not increase the amount of information available. It presents the original information in a different format

46
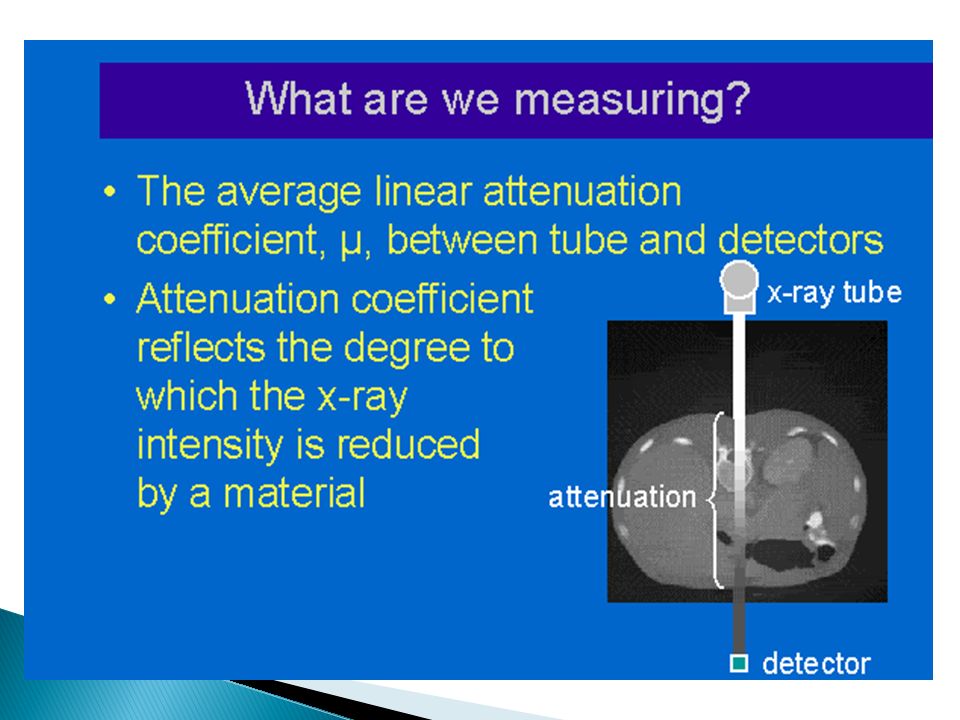
▪ This is numerical value assigned to each pixel. ▪ CT numbers are derived from the attenuation coefficient of the tissue in the voxel. ▪ CT numbers are also called Hounsfield units

47
Att CoeffCT numbertissue 0.461000bone 0.23150muscle 0.18745white matter 0.18440gray matter 0.18220blood 0.18115CSF 0.180water 0.162-100fat 0.094-200lung o.0003-1000air

48
▪ Atomic number ▪ Tissue density ▪ Beam energy

50
▪ I=I o e -µx ▪ Based on a homogenous beam Attenuation

51
▪ The higher the CT number the brighter the pixel

52
▪ Calculation ▪ Positive and Negative ▪ Numbers for various anatomical structures

53
▪ Water is 0.206 µT - µi µI X 1000

54
▪ Air = -1000 ▪ Lungs = -200 ▪ Fat = -50 to – 100 ▪ Water = 0 ▪ CSF = 15 ▪ Blood = 42-50 ▪ Gray matter = 40 ▪ White matter = 45 ▪ Muscle = 50 ▪ Bone = >500

55
▪ This is the range of CT numbers displayed. ▪ The wider the width the lower the contrast. ▸ Think scale of contrast, a long scale (wide width) has low contrast.
 has low contrast..")
56
▪ Level is the center number of the width. ▪ Usually, this represents the anatomy of interest. ▪ You can see by the similarities between CT numbers that the level doesn’t change much.

58
▪ Increase pixels increase resolution ▪ Decrease voxel size increase resolution ▪ Typically need to increase technique with higher res

59
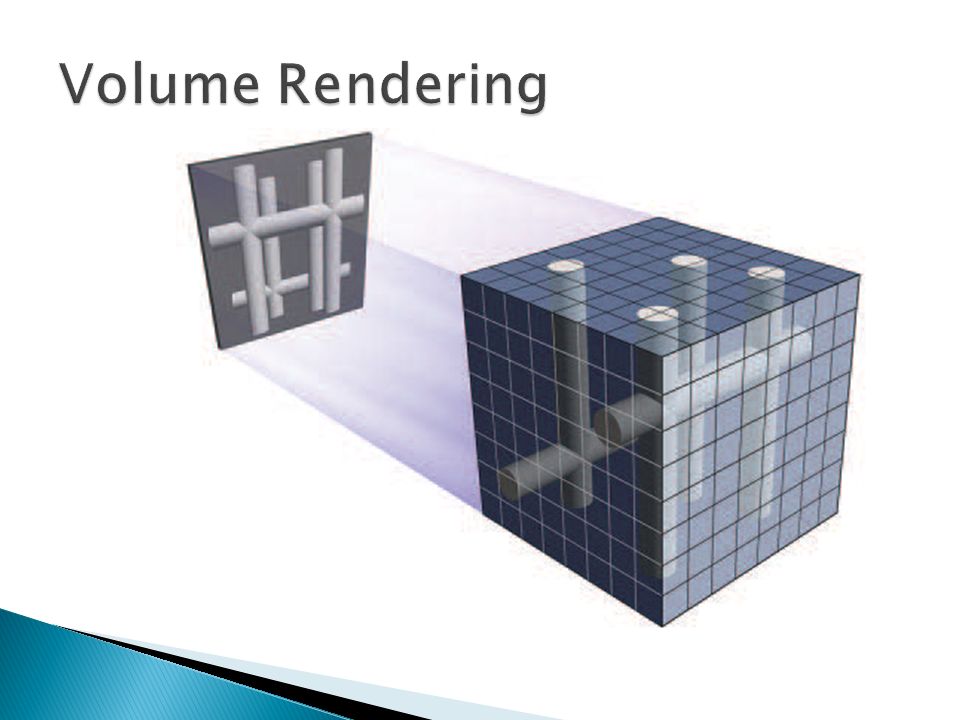
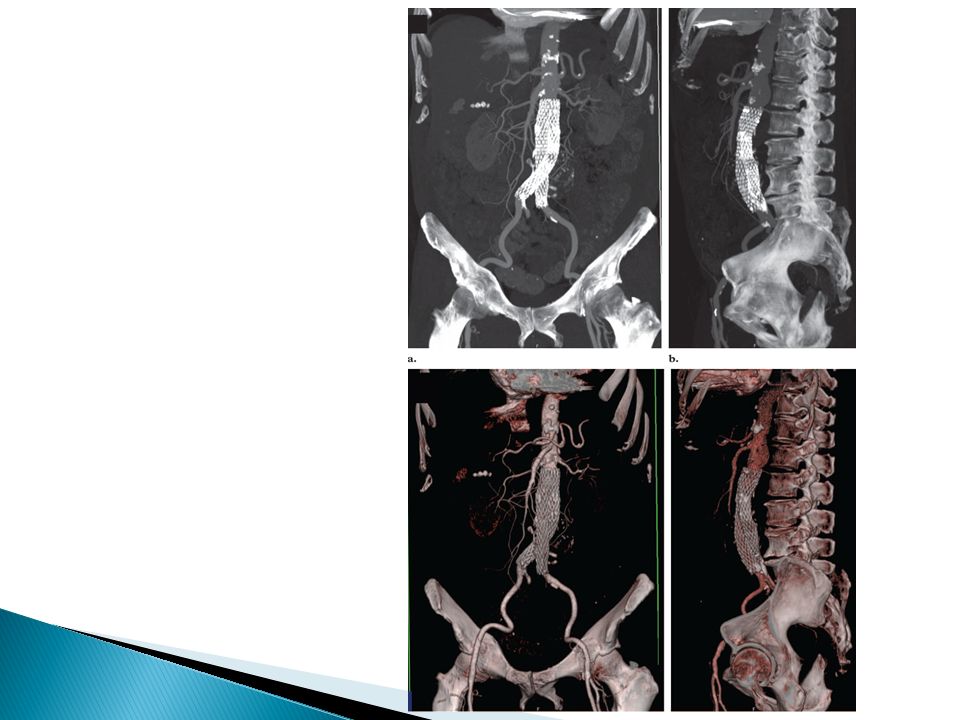
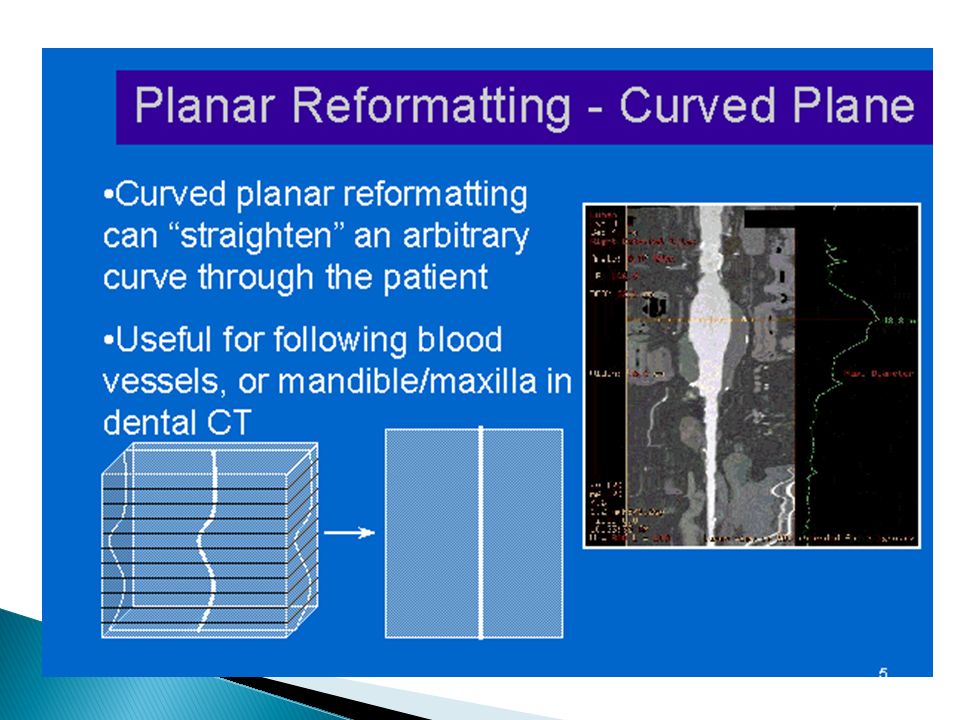
▪ The most common is maximum intensity projection (MIP) ▪ Also, volume rendering is used to provide an image with depth. Used to be called shaded- surface display (SSD). ▪ Quantitative CT uses a phantom to establish a bone mineral density exam.
. ▪ Quantitative CT uses a phantom to establish a bone mineral density exam..")
60
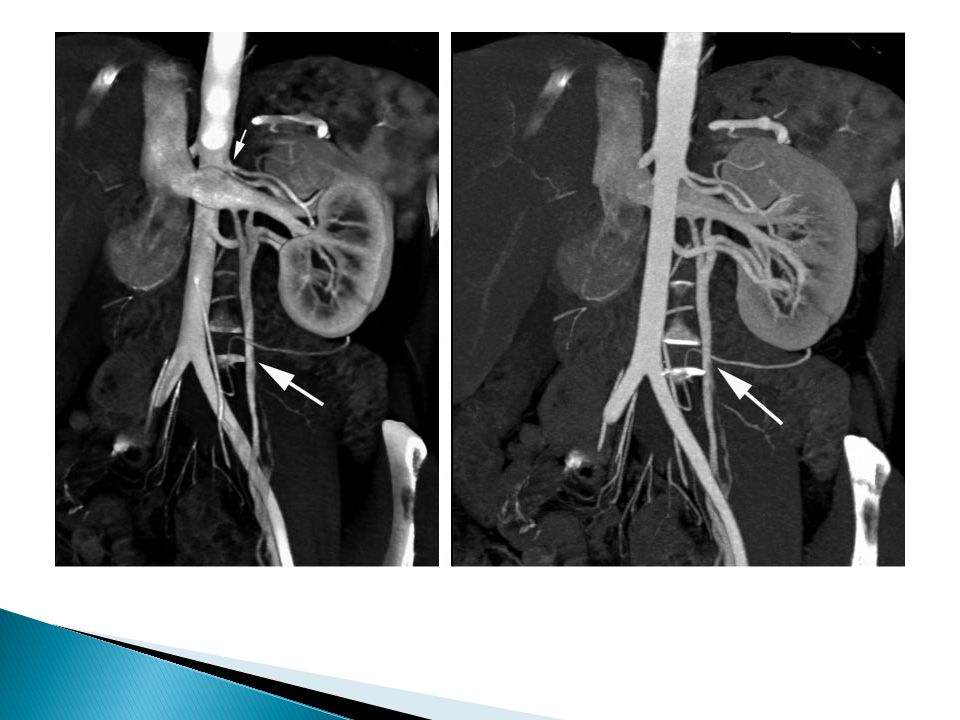
▪ This is the basis for CT angiography. ▪ Voxels are selected for their intensity along a proscribed axis of reconstruction. ▪ MIP images are volume rendered

64
▪ ROI ▪ Measurement ▸ Linear ▸ Volume ▪ Magnification

65
▪ Spiral scanners greatly improved sagittal and coronal reconstructions because they limited movement. ▪ Multi-slice scanners are even better because they have smaller slice thicknesses and isotropic voxels.

66
Axial image Conventional CT Spiral

69
▪ Source moves, detectors probably not ▪ Source stops and starts ▪ Patients moves between exposures

70
▪ Source moves, detectors may move ▪ Patient moves during exposure

72
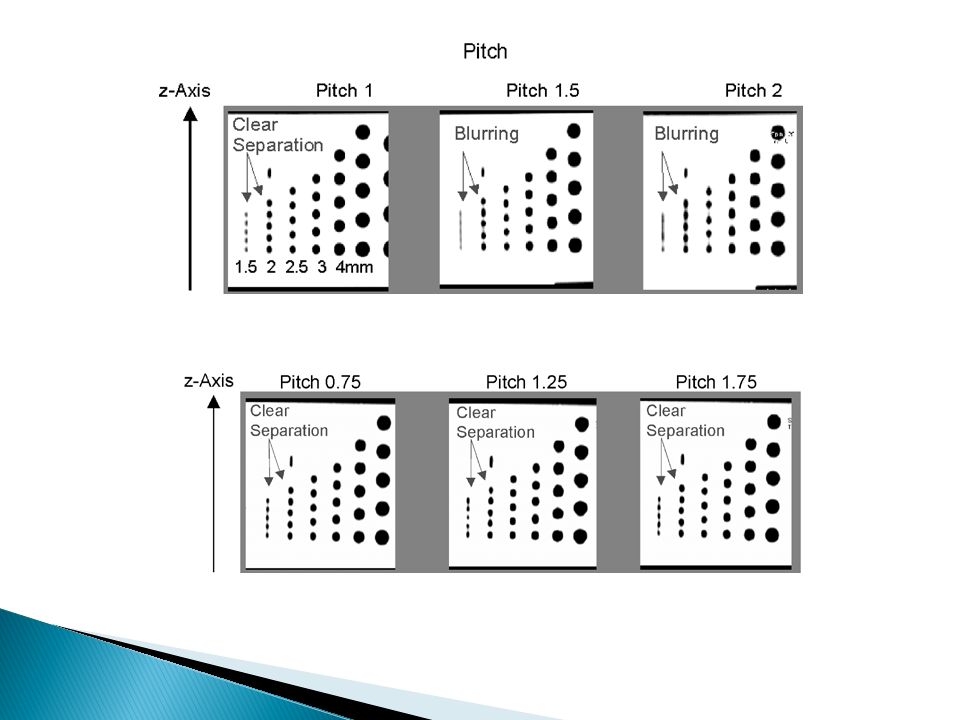
▪ Couch movement per rotation divided by slice thickness ▪ Contigous spiral: pitch = 1, 10mm of movement with a slice thickness of 10mm ▪ Extended spiral: pitch = 2, 20mm of movement with a slice thickness of 10mm. ▪ Overlapping spiral: pitch = ½

73
▪ The lower the pitch the better the z-axis resolution. ▪ The narrower the collimation the better the z- axis resolution. ▪ Increase pitch, decrease dose ▪ When pitch exceeds 1, interpolation filters must be applied

74
▪ Spiral scanners don’t acquire true axial images so interpolation becomes necessary at larger pitches. ▪ So data is interpolated and then back filtered.

76
▪ Image noise is higher for spiral CT than conventional CT regardless of the scanning parameters.

77
▪ Faster image acquisition ▪ Contrast can be followed better ▪ Reduced patient dose at pitches > 1 ▪ Physiologic imaging ▪ Improved 3d and reconstructions ▪ Less partial volume

78
▪ Fewer motion artifacts ▪ No misregistration ▪ Increased throughput ▪ Real time biopsy

Similar presentations


 of radiation directed toward the pt. and the remnant radiation emitted from the pt.>")

