Download presentation
Presentation is loading. Please wait.

1
LECTURE 3B – CHART PROJECTION

2
Introduction to Chart Projection Usually we read chart in coordinate system. A projected coordinate system is defined on a flat, two- dimensional surface. The advantage of coordinate system is the lengths, angles, and areas are constant across the two dimensions. A projected coordinate system is always based on a geographic coordinate system that can use a sphere or spheroid.

3
Introduction to Chart Projection Figure: Projected Coordinate Systems

4
This coordinate system which can be found in aeronautical chart is actually the combination of several types of chart projections. There are lots of chart projection will be discussed in this chapter such as: Mercator projections (Cylindrical) Conic projections Planar projections Introduction to Chart Projection
 Conic projections Planar projections Introduction to Chart Projection.")
5
Note that, it is impossible to get ideal chart just by using one type of projection. In fact, lots of combination must be used just to fit the ideal properties of chart. This is because every type of chart projection has its own advantages and disadvantages. Introduction to Chart Projection

6
The Globe Globe which is represented by Orthographic projection comply the requirement of equatorial aspect. On the globe, the directions, distances, shapes and areas of earth surfaces can be found in true dimensions. However, even though globe can produce accurate information of earth surfaces, there are still lots of disadvantages that restricted the use of globe in navigation.

7
The main disadvantages of globe are: Even the largest globe has a very small scale and shows relatively little detail. Costly to reproduce and update. Difficult to carry around. Bulky to store. The Globe - Disadvantages

8
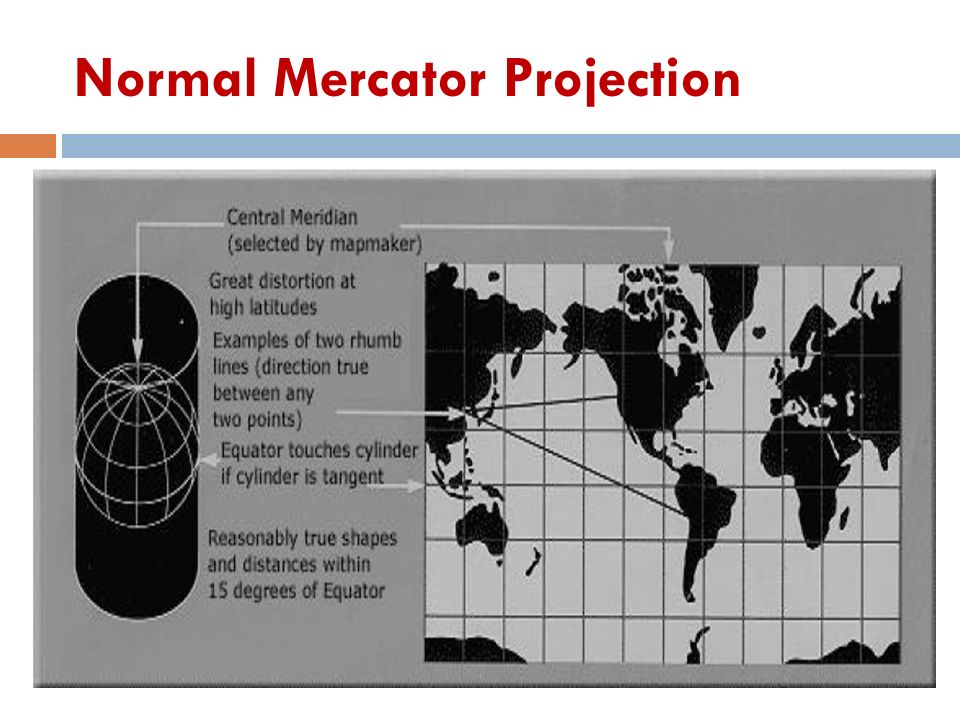
Mercator Projections The Mercator projection is one of the most common cylindrical projections, and the equator is usually its line of tangency. One of the best known map projections, the Mercator projection was devised specifically as an aid to navigation.

9
Basically there are 3 types of Mercator projections which are: Normal Mercator projection Transverse Mercator projection Oblique Mercator projection A course can be plotted easily with the Mercator projection because a course with constant azimuth (compass direction) is shown as a straight line. Mercator Projections

10
The Mercator is a regular cylindrical projection (the cylinder axis passes through the north and south poles). Distances are true only along Equator, but are reasonably correct within 15° of Equator. Special scales can be used to measure distances along other parallels. Two particular parallels can be made correct in scale instead of the Equator. Normal Mercator Projection

11
However, the areas and shapes of large areas are distorted. Distortion increases away from Equator and is extreme in polar regions. But still, Mercator projection remains in common use on nautical charts since the scale distortion is minor near the equator. Normal Mercator Projection

13
Transverse Mercator Projection For more complex cylindrical projections the cylinder is rotated, thus changing the tangent lines. Transverse Mercator use a meridian line as the tangential contact. The standard lines then run north and south, along which the scale is true. It is used for mapping large areas that are mainly north- south in extent.

14
Distances are true only along the central meridian selected by the mapmaker or else along two lines parallel to it. However all distances, directions, shapes, and areas are reasonably accurate within 15° of the central meridian. The central meridian and equator are straight lines, but all other meridians and parallels are complex curves. Graticule spacing increases away from central meridian. Distortion of distances, directions, and size of areas increases rapidly outside the 15° band. Transverse Mercator Projection

15
Oblique Mercator Projection Oblique cylinders are rotated around a great circle line located anywhere between the equator and the meridians.

16
Used to show regions along a great circle other than the Equator or a meridian. This kind of map can be made to show as a straight line the shortest distance between any two preselected points along the selected great circle. Distances are true only along the great circle (the line of tangency for this projection), or along two lines parallel to it. Oblique Mercator Projection
, or along two lines parallel to it. Oblique Mercator Projection.")
17
Distances, directions, areas, and shapes are fairly accurate within 15° of the great circle. Distortion of areas, distances, and shapes increases away from the great circle. Graticule spacing increases away from the great circle. Oblique Mercator Projection

18
Conic Projections The most simple conic projection is tangent to the globe along a line of latitude. This line is called the standard parallel. The meridians are projected onto the conical surface, meeting at the apex, or point, of the cone. Parallel lines of latitude are projected onto the cone as rings.

19
The cone is then ‘cut’ along any meridian to produce the final conic projection, which has straight converging lines for meridians and concentric circular arcs for parallels. Conic Projections

20
In general, distortion increases away from the standard parallel. Thus, cutting off the top of the cone produces a more accurate projection. Conic Projections

21
Conic projections are used for mid-latitude zones that have an east-to-west orientation. For small areas, the overall distortion is minimal. Conic Projections

22
Lambert Conic Conformal projection Distances true only along standard parallels; reasonably accurate elsewhere in limited regions. Directions reasonably accurate. Distortion of shapes and areas minimal at, but increases away from standard parallels. Shapes on large-scale maps of small areas essentially true.

23
Albers Equal Area Conic Maps showing adjacent areas can be joined at their edges only if they have the same standard parallels (parallels of no distortion) and the same scale. Conic Projections

24
Albers Equal Area Conic All areas on the map are proportional to the same areas on the Earth. Directions are reasonably accurate in limited regions. Distances are true on both standard parallels. Maximum scale error is 1.25% on map Scale true only along standard parallels. Conic Projections

25
Planar Projections Planar projections project map data onto a flat surface touching the globe. A planar projection is also known as an azimuthal projection or a zenithal projection. This type of projection is usually tangent to the globe at one point and the point of contact may be the North Pole, the South Pole, a point on the equator, or any point in between.

26
This point specifies the aspect and is the focus of the projection. The focus is identified by a central longitude and a central latitude. Possible aspects are polar, equatorial, and oblique. Planar Projections

27
Characteristics of Planar Projections: Directions from the focus are accurate. Great circles passing through the focus are represented by straight lines; thus the shortest distance from the center to any other point on the map is a straight line. Planar Projections

28
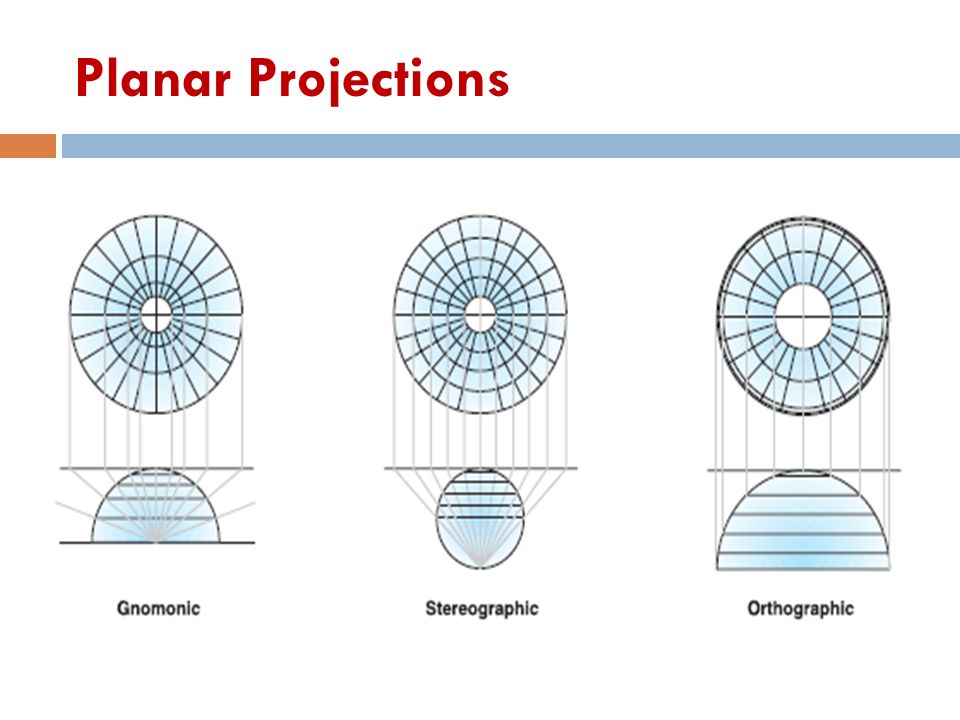
Some planar projections view surface data from a specific point in space. Perspective points may be the center of the earth, a surface point directly opposite from the focus, or a point external to the globe, as if seen from a satellite or another planet. The examples of planar projections are: Gnomonic Projection Stereographic Projection Orthographic Projection Planar Projections

29
The Gnomonic projection views the surface data from the center of the earth. Whereas the Stereographic projection views it from pole to pole. The Orthographic projection views the earth from an infinite point, as if viewed from deep space. Planar Projections

Similar presentations