Download presentation
Presentation is loading. Please wait.

1
Air Pollution Ch 17

2
Overview The Earth’s atmosphere Outdoor pollution and solutions Stratospheric ozone depletion Acidic deposition and consequences Indoor air pollution and solutions

3
Central Case: Charging toward cleaner air in London London has had bad air pollution for centuries that has killed thousands Today, smog from traffic is a problem The “congestion-charging” program charges drivers to drive into central London during the week Congestion decreased, fewer accidents occurred and the air became cleaner

4
The atmosphere Atmosphere = the thin layer of gases that surrounds Earth Absorbs radiation and moderates climate Transports and recycles water and nutrients 78% nitrogen gas, 21% oxygen gas, 1% other gases Its four layers differ in temperature, density and composition Minute concentrations of permanent (remain at stable concentrations) and variable gases (varying concentrations) Human activity is changing the amounts of some gases
 and variable gases (varying concentrations) Human activity is changing the amounts of some gases")
5
The atmosphere’s composition

6
The first two layers of the atmosphere Troposphere = bottommost layer Air for breathing, weather Temperature declines with altitude Tropopause = limits mixing between troposphere and the layer above it Stratosphere = 11-50 km (7-31 mi) above sea level Drier and less dense, with little vertical mixing Colder in its lower regions Contains UV radiation-blocking ozone, 17-30 km (10-19 mi) above sea level
 above sea level Drier and less dense, with little vertical mixing Colder in its lower regions Contains UV radiation-blocking ozone, km (10-19 mi) above sea level")
7
The two highest levels of the atmosphere Mesosphere = 50-80 km (31-56 mi) above sea level Extremely low air pressure Temperatures decrease with altitude Thermosphere = atmosphere’s top layer Extends upward to 500 m (300 mi)
 above sea level Extremely low air pressure Temperatures decrease with altitude Thermosphere = atmosphere’s top layer Extends upward to 500 m (300 mi)")
8
The atmosphere’s four layers

9
Atmospheric properties Atmospheric pressure = measures the force per unit area produced by a column of air Decreases with altitude Relative humidity = the ratio of water vapor a given volume of air contains to the amount it could contain at a given temperature Temperature = varies with location and time

10
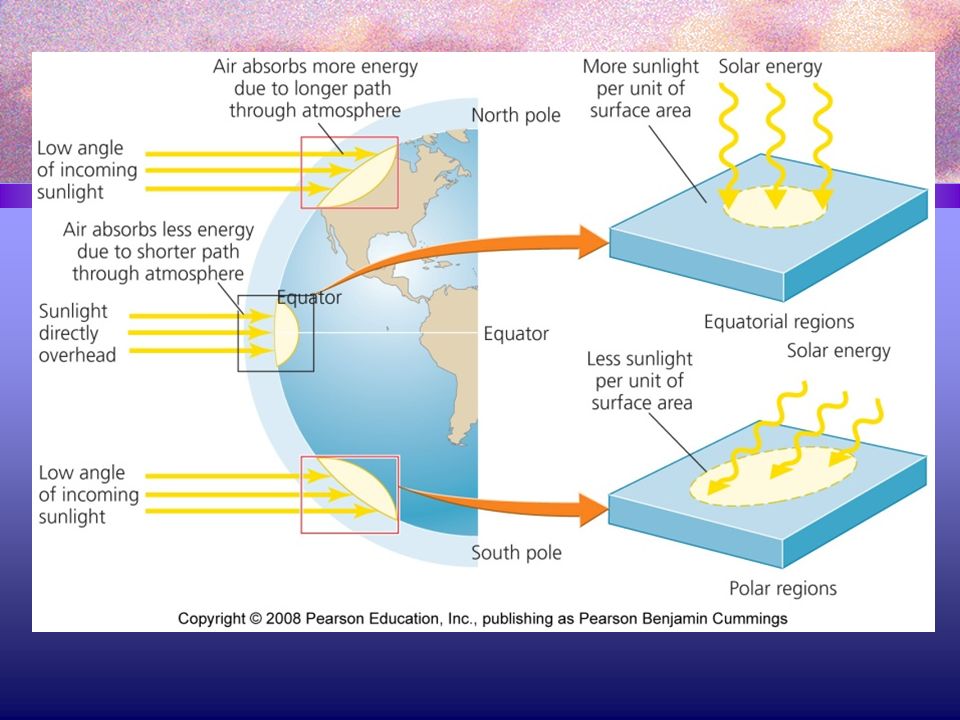
Solar energy heats the atmosphere The spatial relationship between the Earth and sun determines the amount of solar energy striking the Earth Energy from the sun Heats air Moves air Creates seasons Influences weather and climate Solar radiation is highest near the equator

12
Solar energy creates seasons Because the Earth is tilted Each hemisphere tilts toward the sun for half the year Results in a change of seasons Equatorial regions are unaffected by this tilt, so days average 12 hours through the year

13
Solar energy causes air to circulate Air near Earth’s surface is warmer and moister than air at higher latitudes Convective circulation = less dense, warmer air rises and creates vertical currents Rising air expands and cools Cool air descends and becomes denser, replacing warm air Influences both weather and climate

14
The atmosphere drives weather and climate Weather = specifies atmospheric conditions over short time periods and within a small geographic areas Climate = describes patterns of atmospheric conditions across large geographic regions over long periods of time Mark Twain said “Climate is what we expect; weather is what we get”

15
Air masses produce weather Front = the boundary between air masses that differ in temperature, moisture, and density Warm Front = the boundary where warm moist air replaces colder, drier air Cold Front = the boundary where colder, drier air displaces warmer, moister air

16
Air masses have different atmospheric pressures High-pressure system = air that moves away from a center of high pressure as it descends Brings fair weather Low-pressure system = air moves toward the low atmospheric pressure at the center of the system and spirals upward Clouds and precipitation

17
Thermal inversion Usually, tropospheric air temperature decreases as altitude increases Warm air rises, causing vertical mixing Thermal inversion = a layer of cool air occurs beneath a layer of warmer air Inversion layer = the band of air in which temperature rises with altitude Denser, cooler air at the bottom of the layer resists mixing

18
The atmosphere Convective currents contribute to climatic patterns and affect moisture distribution Hadley cells = near the equator, surface air warms, rises, and expands Releases moisture and heavy rainfall near the equator Ferrel cells and polar cells = lift air Creates precipitation at 60 degrees latitude north and south Causes air to descend at 30 degrees latitude

19
Global wind patterns The atmospheric cells interact with Earth’s rotation to produce global wind patterns As Earth rotates, equatorial regions spin faster Coriolis effect = the north-south air currents of the convective cells appear to be deflected from a straight path Results in curving global wind patterns

20
Climate patterns and moisture distribution

21
Wind patterns Doldrums = near the equator Few winds Trade winds = between the equator and 30 degrees latitude Blow from east to west Westerlies = from 30 to 60 degrees latitude Originate from the west and blow east People used these winds to sail their ships across the ocean

22
Ultra Fine Particles Fine Particles Large Particles Sea salt nuclei Carbon black Pollens Cement dust Oil smoke Combustion nuclei Metallurgical dust and fumes Photochemical smog Insecticide dusts Coal dust Average particle diameter (micrometers or microns) 0.0010.012.510.0100.0 Tobacco smoke Paint pigments Fly ash Milled flour Fig. 17.7, p. 425

23
Outdoor air pollution Air pollutants = gases and particulate material added to the atmosphere Can affect climate or harm people Air pollution = the release of pollutants Outdoor (ambient) air pollution = pollution outside Has recently decreased due to government policy and improved technologies in developed countries Developing countries and urban areas still have significant problems
 air pollution = pollution outside Has recently decreased due to government policy and improved technologies in developed countries Developing countries and urban areas still have significant problems")
24
Outdoor Air Pollutants Air pollution: presence of one or more chemicals in the atmosphere in sufficient quantities and duration that cause harm to life or alter climate COx, NOx, SOx Volatile organic cmpds, (VOCs) Suspended particulate matter SPM Photochemical oxidants Radioactive substances Hazardous air pollutants (HAPS)
 Suspended particulate matter SPM Photochemical oxidants Radioactive substances Hazardous air pollutants (HAPS)")
25
Dust storms = Hundreds of millions of tons of dust are blown westward across the Atlantic Ocean by trade winds every year From Africa to the Americas Unsustainable farming and grazing, erosion and desertification Natural sources pollute: dust storms

26
Natural sources pollute: volcanoes Release large quantities of particulate matter, sulfur dioxide & other gases Can remain for months or years Aerosols = reflect sunlight back into space and cool the atmosphere and surface

27
Natural sources pollute: fires Pollutes atmosphere with soot and gases Over 60 million ha of forests and grasslands burn per year Severe fires are caused by human interaction Cleared forests, harsh droughts, and climate change (El Niño)
")
28
Types of outdoor air pollution Air pollution can come from mobile or stationary sources Point Sources = specific spots where large quantities of pollutants are discharged (power plants and factories) Nonpoint Sources = more diffuse, consisting of many small sources (automobiles) Primary Pollutants = directly harmful and can react to form harmful substances (soot and carbon dioxide) Secondary Pollutants = form when primary pollutants interact or react with constituents or components of the atmosphere (tropospheric ozone and sulfuric acid)
 Nonpoint Sources = more diffuse, consisting of many small sources (automobiles) Primary Pollutants = directly harmful and can react to form harmful substances (soot and carbon dioxide) Secondary Pollutants = form when primary pollutants interact or react with constituents or components of the atmosphere (tropospheric ozone and sulfuric acid)")
29
Legislation addresses pollution Congress passed a series of laws starting in 1955 The Clean Air Act of 1970 Sets standards for air quality, limits on emissions Provides funds for pollution-control research Allows citizens to sue parties violating the standards The Clean Air Act of 1990 Strengthens standards for auto emissions, toxic air pollutants, acidic deposition, stratospheric ozone depletion Introduced emissions trading

30
Clean Air Act EPA establish national ambient air quality standards NAAQS for 6 criteria pollutants Primary standard set to protect human health Secondary standard prevent env and property damage Compliance a problem

31
The EPA sets standards Environmental Protection Agency (EPA) sets nationwide standards for emissions of toxic pollutants States monitor air quality and develop, implement, and enforce regulations within their borders If a state’s plans for implementation are not adequate, the EPA can take over enforcement
 sets nationwide standards for emissions of toxic pollutants States monitor air quality and develop, implement, and enforce regulations within their borders If a state’s plans for implementation are not adequate, the EPA can take over enforcement")
32
Criteria pollutants: carbon monoxide Criteria pollutants = pollutants judged to pose especially great threats to human health Carbon monoxide (CO) A colorless, odorless gas Produced primarily by incomplete combustion of fuel Poses risk to humans and animals, even in small concentrations
 A colorless, odorless gas Produced primarily by incomplete combustion of fuel Poses risk to humans and animals, even in small concentrations")
33
Criteria pollutants: sulfur and nitrogen dioxide Sulfur dioxide (SO 2 ) = colorless gas with a strong odor Coal emissions from electricity generation and industry Can form acid precipitation Nitrogen dioxide (NO 2 ) = highly reactive, foul smelling reddish brown gas Nitrogen oxides (NO x ) = nitrogen and oxygen react at high temperatures Vehicle engine and industrial combustion, electrical utilities Contributes to smog and acid precipitation
 = colorless gas with a strong odor Coal emissions from electricity generation and industry Can form acid precipitation Nitrogen dioxide (NO 2 ) = highly reactive, foul smelling reddish brown gas Nitrogen oxides (NO x ) = nitrogen and oxygen react at high temperatures Vehicle engine and industrial combustion, electrical utilities Contributes to smog and acid precipitation")
34
Criteria pollutants: tropospheric ozone Tropospheric ozone (O 3 ) = a colorless gas with a strong odor A secondary pollutant Results from interactions of sunlight, heat, nitrogen oxides, and volatile carbons A major component of smog Poses a health risk as a result of its instability
 = a colorless gas with a strong odor A secondary pollutant Results from interactions of sunlight, heat, nitrogen oxides, and volatile carbons A major component of smog Poses a health risk as a result of its instability")
35
Criteria pollutants: particulate matter and lead Particulate matter = solid or liquid particles suspended in the atmosphere Primary pollutants: dust and soot Secondary pollutants: sulfates and nitrates Damages respiratory tissue when inhaled Most is wind-blown dust Lead = particulate pollutant added to gas and used in industrial metal smelting Bioaccumulates and causes nervous system malfunction Banned in gasoline in developed, but not in developing countries

36
Areas in the U.S. fail air quality standards

37
Agencies monitor pollutants State and local agencies also monitor, calculate, and report to the EPA the emissions of pollutants Four criteria pollutants: carbon monoxide, sulfur dioxide, particulate matter, and lead All nitrogen oxides Not tropospheric ozone (no emissions to monitor) Volatile organic compounds (VOCs) = carbon- containing chemicals used emitted by vehicle engines and industrial processes
 Volatile organic compounds (VOCs) = carbon- containing chemicals used emitted by vehicle engines and industrial processes")
38
U.S. air pollution In 2006, the U.S. emitted 137 million tons of the six major pollutants

39
Air pollution has decreased since 1970 Total emissions of the six monitored pollutants have declined Despite increased population, energy consumption, miles traveled, and gross domestic product

40
Reasons for the decline in U.S. pollution Cleaner-burning vehicles and catalytic converters decrease carbon monoxide Permit-trading programs and clean coal technologies reduce SO 2 emissions Scrubbers = technologies that chemically convert or physically remove pollutants before they leave the smokestacks Phaseout of leaded gasoline Improved technologies and federal policies

41
Toxic substances also pollute Toxic air pollutants = substances known to cause cancer; reproductive defects; or neurological, development, immune system, or respiratory problems Some are produced naturally: hydrogen sulfide Most are produced by humans: smelting, sewage treatment, industry Not monitored as closely as the six criteria pollutants Monitoring is improving

42
Recent policies have been contentious President G.W. Bush has pushed proposals that would overturn key aspects of legislation New source reviews = old utility plants have to install the best available technology when upgrading The Bush administration proposed abolishing this requirement and dropped lawsuits against violators Clear Skies Initiative = establishes a market-based can-and- trade program for some pollutants Stopped in the Senate, because it would increase pollution The EPA had skewed its analysis to promote the legislation

43
Burning fossil fuels produces industrial smog Smog = unhealthy mixtures of air pollutants over urban areas Industrial (gray air) smog = industries burn coal or oil Occurs in cooler, hilly areas Government regulations in developed countries reduced smog Coal-burning industrializing countries face significant health risks
 smog = industries burn coal or oil Occurs in cooler, hilly areas Government regulations in developed countries reduced smog Coal-burning industrializing countries face significant health risks")
44
Thermal inversion Usually, tropospheric air temperature decreases as altitude increases Warm air rises, causing vertical mixing Thermal inversion = a layer of cool air occurs beneath a layer of warmer air Inversion layer = the band of air in which temperature rises with altitude Denser, cooler air at the bottom of the layer resists mixing

45
Photochemical (brown air) smog Produced by a series of reactions Hot, sunny cities surrounded by mountains Light-driven reactions of primary pollutants and normal atmospheric compounds Morning traffic exhaust releases pollutants Irritates eyes, noses, and throats Vehicle inspection programs in the U.S. have decreased smog

46
17.16 Industrial smogPhotochemical smog

47
Photochemical Smog Primary and secondary air pollutants Rx facilitated by sunlight >100 compounds, of which O3 is worst problem N2+O2 2NO yellowish, choking odor 2NO+O2 2NO2 brown color 3NO2 + H2O 2HNO3 + NO NO2 + UV NO + O O + O2 O3 Photochemical reactions and oxidants

48
Photochemical Oxidants NO2, O3, PANs React with and oxidize certain compounds in the atmosphere that are not usually oxidized Traces of photochemical oxidants or aldehydes in the atmosphere can irritate respiratory tracts and kill trees Spotted leaves in Raleigh, NC

49
Air quality is a rural issue, too Airborne pesticides from farms Industrial pollutants drifting from cities, factories and power plants Feedlots, where cattle, hogs, or chickens are raised in dense concentrations Voluminous amounts of methane, hydrogen sulfide, and ammonia People living or working nearby have high rates of respiratory problems

50
Industrializing nations face increasing pollution Outdoor pollution is increasing Factories and power plants do not control emissions Citizens burn traditional fuels (wood and charcoal) China has the world’s worst air pollution 80% of Chinese cities have emissions above the safety threshold Asian brown cloud = a 2-mile thick layer of pollution that reduces sunlight, affects climate, decreases productivity, and kills thousands each year
 China has the world’s worst air pollution 80% of Chinese cities have emissions above the safety threshold Asian brown cloud = a 2-mile thick layer of pollution that reduces sunlight, affects climate, decreases productivity, and kills thousands each year")
51
Synthetic chemicals deplete stratospheric ozone Ozone layer = ozone in the lower stratosphere 12 ppm concentrations effectively block incoming damaging ultraviolet radiation Chlorofluorocarbons (CFCs) = chemicals that attack ozone 1 million metric tons/year were produced Releases chlorine atoms that split ozone
 = chemicals that attack ozone 1 million metric tons/year were produced Releases chlorine atoms that split ozone")
52
The hole in the ozone Ozone hole = ozone levels over Antarctica had declined by 40-60% Depletion also in the Arctic and globally Causes skin cancer, harms crops and decreases ocean productivity

53
The Montreal Protocol addressed ozone depletion Montreal Protocol = 180 nations agreed to cut CFC production in half Follow-up agreements deepened cuts, advanced timetables and addresses other ozone-depleting chemicals Today, production and use of ozone-depleting chemicals has decreased 95% The ozone layer is beginning to recover Challenges still face us CFCs will remain in the stratosphere for a long time Nations can ask for exemptions to the ban

54
The Montreal Protocol is a success Considered the biggest environmental success story Policymakers included industry in helping solve the problem Implementation of the plan allowed an adaptive management strategy that changed strategies in response to new scientific data, technological advances, and economic figures The Montreal Protocol can serve as a model for international environmental cooperation

55
Acid deposition is another transboundary issue Acidic deposition = the deposition of acid, or acid-forming pollutants, from the atmosphere onto Earth’s surface Acid rain = precipitation of acid Atmospheric deposition = the wet or dry deposition on land of pollutants

56
Sources of acid deposition Originates from burning fossil fuels that release sulfur dioxide and nitrogen oxides These compounds react with water to form sulfuric and nitric acids

57
Effects of acid deposition Nutrients are leached from topsoil Soil chemistry is changed Metal ions (aluminum, zinc, etc.) are converted into soluble forms that pollute water Widespread tree mortality Affects surface water and kills fish Damages agricultural crops Erodes stone buildings, corrodes cars, erases writing on tombstones
 are converted into soluble forms that pollute water Widespread tree mortality Affects surface water and kills fish Damages agricultural crops Erodes stone buildings, corrodes cars, erases writing on tombstones")
58
pH of precipitation in the U.S. Many regions of acidification are downwind of major sources of pollution

59
Acid deposition has not been greatly reduced New technologies such as scrubbers have helped SO 2 emissions are lower But, NO x emissions are higher Acid deposition’s effects are worse than predicted The Clean Air Act cannot restore ecosystems More must be done to control acid deposition

60
Indoor air pollution Indoor air contains higher concentrations of pollutants than outdoor air 6,000 people die per day from indoor air pollution The average U.S. citizen spends 90% of the time indoors Exposed to synthetic materials that have not been comprehensively tested To reduce heat loss and improve energy efficiency, building ventilation systems were sealed off ventilation and windows put in that did not open, trapping pollutants inside

61
Indoor Air Pollution People spend 70+% of time inside, exacerbating problems of air pollution High risk members of population are infants, children, elderly, pregnant women, sick people, people w respiratory or heart problems, factory workers, and smokers Problems include cancer, headaches, flu like symptoms, chronic fatigue – sick building syndrome Problems drive up absenteeism, health care costs, and reduce productivity

62
Indoor air pollution in the developing world Stems from burning Wood, charcoal, dung, crop wastes Little to no ventilation Fuel burning pollution causes an estimated 1.6 million deaths per year Soot and carbon monoxide Causes pneumonia, bronchitis, allergies, cataracts, asthma, heart disease, cancer and death

63
3 greatest indoor pollutants Cigarette smoke Formaldehyde (outgassed from common household materials) 1 in 5K people will develop cancer Radioactive radon-222 gas often associated with coal deposits and uranium-238, phosphate, granite and shale-lung cancer and smokers at much greater risk
 1 in 5K people will develop cancer Radioactive radon-222 gas often associated with coal deposits and uranium-238, phosphate, granite and shale-lung cancer and smokers at much greater risk")
64
Tobacco smoke and radon The most dangerous indoor pollutants in the developed world Secondhand smoke from cigarettes is especially dangerous Containing over 4000 dangerous chemicals Causes eye, nose, and throat irritation Smoking has declined in developed nations Radon causes 20,000 deaths a year in the U.S. A radioactive gas resulting from natural decay of rock; soil; or water, which can seep into buildings Most homes are now radon resistant

65
Outlet vents for furnaces and dryers Slab joints Wood stove Cracks in floor Clothes dryer Furnace Radon-222 gas Slab Radium-222 Soil Uranium-238 Sump pump Cracks in wall Open window Openings around pipes Openings around pipes Fig. 17.17, p. 436

66
Radon risk across the U.S.

67
Asbestos This is not as great a problem in US as it once was-illegal to have in buildings as insulation material. Led to asbestosis, lung cancer, mesothelioma Now a problem in developing countries.

68
Respiratory diseases Lung cancer Asthma Chronic bronchitis emphysema

69
Nasal cavity Oral cavity Pharynx (throat) Trachea (windpipe) Bronchus Right lung Bronchioles Fig. 17.18a, p. 437 (see figure 17.18b) (see figure 17.18c)
 (see figure 17.18c).")
70
Squamous cell carcinoma

71
Volatile Organic Compounds (VOCs) The most diverse group of indoor air pollutants Released by everything from plastics and oils to perfumes and paints Most VOCs are released in very small amounts Unclear health implications due to low concentrations Also include pesticides, which are found indoors more often than outdoors due to seepage Formaldehyde, which leaks from pressed wood and insulation, irritates mucous membranes and induces skin allergies
 The most diverse group of indoor air pollutants Released by everything from plastics and oils to perfumes and paints Most VOCs are released in very small amounts Unclear health implications due to low concentrations Also include pesticides, which are found indoors more often than outdoors due to seepage Formaldehyde, which leaks from pressed wood and insulation, irritates mucous membranes and induces skin allergies")
72
Sources of indoor air pollution

73
Living organisms can pollute indoors Tiny living organisms can also pollute Includes dust mites and animal dander worsen asthma Fungi, mold, mildew, airborne bacteria cause severe allergies, asthma, and other respiratory ailments Sick building syndrome = a sickness produced by indoor pollution with general and nonspecific symptoms Solved by using low-toxicity building materials and good ventilation

74
We can reduce indoor air pollution In developed countries: Use low-toxicity material Monitor air quality Keep rooms clean Limit exposure to chemicals In developing countries: Dry wood before burning Cook outside Use less-polluting fuels (natural gas)
")
75
Conclusion Indoor air pollution is a potentially serious health threat We can significantly minimize risks Outdoor air pollution has been addressed by government legislation and regulation in developed countries Reduction in outdoor air pollution represents some of the greatest strides in environmental protection There is still room for improvement, especially in developing countries

76
Primary Pollutants Secondary Pollutants Sources Natural Stationary COCO 2 SO 2 NONO 2 Most hydrocarbons Most suspended particles SO 3 HNO 3 H 2 SO 4 H2O2H2O2 O3O3 PANs MostandsaltsNO 3 – Mobile SO 4 2 – Fig. 17.4, p. 422

77
Solar radiation Ultraviolet radiation NO Nitric oxide Photochemical smog H 2 O Water NO 2 Nitrogen dioxide Hydrocarbons O 2 Molecular oxygen HNO 3 Nitric acid PANs Peroxyacyl nitrates Aldehydes (e.g., formaldehyde) O 3 Ozone O Atomic oxygen Fig. 17.5, p. 424

78
Nitric oxide Nitrogen dioxideOzone 40 30 20 10 0 6789 111212345678 A.M.NoonP.M. Time Parts per million Fig. 17.6, p. 424 Daily Pattern of Changes of Conc PhotochemicalSmog

79
Industrial Smog Grey air smog Sulfuric acid Sulfur dioxide Particulates Aerosols (suspended droplets) C + O2 CO2 2C + O2 2CO S + O2 SO2 (coal and smelting of PbS) 2SO2 + O2 2SO3 SO3 + H2O H2SO4 2NH3+H2SO4 (NH4)2SO4 salt
 C + O2 CO2 2C + O2 2CO S + O2 SO2 (coal and smelting of PbS) 2SO2 + O2 2SO3 SO3 + H2O H2SO4 2NH3+H2SO4 (NH4)2SO4 salt")
80
Factors Contributing to Smog Local climate Topography Population density Amount of industry Fuels used in industry, heating, and transportation Reduced by precipitation and wind Increased by tall buildings in close proximity, mountains, high temperatures

81
Temperature Inversions Normally warm air w pollutants rises and mixes with cool air above; resulting turbulence disperses pollution If the warm air cannot rise due to cold layer underneath then pollutants concentrate in cooler denser layer near the ground

82
Warmer air Inversion layer Cool layer Mountain Valley Decreasing temperature Increasing altitude Fig. 17.8a, p. 426 Temperature Inversions Subsidence inversion Mass warm air at high altitude moves over colder air in valley (Raleigh)
.")
83
Inversion layer Mountain range Sea breeze Descending warm air mass Decreasing temperature Increasing altitude Fig. 17.8b, p. 426 Temperature Inversion Radiation inversion Air near ground cools (sea breezes) warm air over traps pollutants Sun rises and warms surface, radiation inversion disappears by noon and disperses night pool of pollution
 warm air over traps pollutants Sun rises and warms surface, radiation inversion disappears by noon and disperses night pool of pollution.")
84
Acid Deposition Secondary pollutants form nitric acid and sulfuric acid in addition to sulfates and nitrate salts Retention time 2-14 days Back to surface as wet deposition (rain, snow, fog) or acid anhydrides Acid anhydrides fall first and closer to site of pollution Fall downwind of pollution source-sometimes long distances across oceans and continents
 or acid anhydrides Acid anhydrides fall first and closer to site of pollution Fall downwind of pollution source-sometimes long distances across oceans and continents")
85
Wind Transformation to sulfuric acid (H 2 SO 4 ) and nitric acid (HNO 3 ) Nitric oxide (NO) Acid fog Ocean Sulfur dioxide (SO 2 ) and NO Windborne ammonia gas and particles of cultivated soil partially neutralize acids and form dry sulfate and nitrate salts Dry acid deposition (sulfur dioxide gas and particles of sulfate and nitrate salts) Farm Lakes in deep soil high in limestone are buffered Lakes in shallow soil low in limestone become acidic Wet acid deposition (droplets of H 2 SO 4 and HNO 3 dissolved in rain and snow) Fig. 17.9, p. 428 Acid deposition

86
Soil type ameliorates or exacerbates acid deposition Yorktown formations – large deposits of CaCO3 act as a buffer (however, they are dissolving and form sinkholes-Grafton sinkholes) Thin acid soils are most affected by acid deposition (over granite that has no buffering capacity)
 Thin acid soils are most affected by acid deposition (over granite that has no buffering capacity)")
87
Wind Effects Moves acidic emissions (acid anhydrides) from Ohio River valley to SE Canada Smelters in SE Canada affect eastern seaboard Emissions from China pollute Japan/Korea China w big coal emissions pollutes area over Indian Ocean equivalent to size of US
 from Ohio River valley to SE Canada Smelters in SE Canada affect eastern seaboard Emissions from China pollute Japan/Korea China w big coal emissions pollutes area over Indian Ocean equivalent to size of US")
88
Iran Saudi Arabia Pakistan India China Myanmar Thailand Bay of Bengal Arabian Sea Ethiopia Equator Indian Ocean Percentage of direct sunlight intercepted Very heavy 35%–45% Heavy 20%–35% Medium 10%–20% 0Miles1,000 0Kilometers1,600 Fig. 17.12a, p. 429 Haze caused by burning fossil fuels in China

89
Effects of Acid Rain on Human Health and Economy Respiratory diseases Acid rain in water leaches toxic metals (Pb & Cu) into drinking water Property damage Reduce atmospheric visibility (sulfate particles) Lower productivity of fisheries, forests, farms Local example Sandy Bottom ponds
 into drinking water Property damage Reduce atmospheric visibility (sulfate particles) Lower productivity of fisheries, forests, farms Local example Sandy Bottom ponds")
90
Water boatman Whirligig Yellow perch Lake trout Brown trout Salamander (embryonic) Mayfly Smallmouth bass Mussel 6.56.05.55.04.54.03.5 pH Fig. 17.13, p. 430

91
Prevention Reduce air pollution by improving energy eficiency Reduce coal use Increase natural gas use Increase use of renewable resources Burn low-sulfur coal Remove SO2 particulates, andNOx from smokestack gases Remove NOx from motor vehicles’ exhaust Tax emissions of SO2

92
CLEAN UP PREVENTION PREVENTION PREVENTION clean up is never totally possible Add lime to neutralize acidified lakes $$$$$$ Add phosphate fertilizer to neutralize acidified lakes Soil-kiss it off; $$$$$$ add lime

93
Electrostatic Precipitator Dirty gas Dust discharge Electrodes Cleaned gas Fig. 17.22a, p. 442

94
Cleaned gas Dirty gas Baghouse Filter Dust discharge Bags Fig. 17.22b, p. 442

95
Cyclone Separator Dirty gas Dust discharge Cleaned gas Fig. 17.22c, p. 442

96
Dirty gas Dirty water Clean water Wet Scrubber Wet gas Cleaned gas Fig. 17.22d, p. 442

97
PREVENTION Reduce personal transportation Improve engines Restrict driving Coat various materials and filter houses to reduce pollutants Set stricter standards Use less polluting substances

98
Clean up Dilute Circulate, bring in fresh air Use exhaust hoods and fans

99
prevention Alternative energy sources!

Similar presentations


 by.>")