Download presentation
Presentation is loading. Please wait.

1
Fa1so

2
Air pollution and vulnerability of children to respiratory infections Jonathan Grigg Centre for Paediatrics Queen Mary University London

7
Indoor (PM 2.5 μg/m 3 )Outdoor (PM 2.5 μg/m 3 ) Indoor smoking allowed12029
Outdoor (PM 2.5 μg/m 3 ) Indoor smoking allowed12029")
8
http://news.sciencemag.org/climate/2013/

11
Nitrogen dioxide is a marker for PM

14
no association between PM 10 /NO 2 with; –occurrence respiratory infections –severity of symptoms

16
2922 paediatric flu admissions

17
RR95%CI Mean temperature0.770.6 to 0.9 PM 10 1.061.05 to 1.07 mean 10 day lag (moving average)
")
18
http://breathe-drydengoodwin.net

19
part of the INMA study (Spain) 2,200 infants modeled pre- and post-natal exposure to NO 2 outcome at 12 to18 months “has a doctor told you your son/daughter has had a chest infection?”
 2,200 infants modeled pre- and post-natal exposure to NO 2 outcome at 12 to18 months has a doctor told you your son/daughter has had a chest infection")
20
high correlation between pre-and post- natal exposure 10 μg/m 3 increase in average outdoor NO 2 during pregnancy was associated with –LRTI relative risk= 1.05 (0.98 to 1.12) –ear infections rr = 1.18 (0.98 to 1.41)
 –ear infections rr = 1.18 (0.98 to 1.41)")
25
PM 10 p<0.01 NO 2 p<0.001 Odds Ratio

26
for 10μg/m 3 increase (on the day and the day before) in exposure of a CF patient there is an increase risk for exacerbation of; –4.3% for PM 10 –10.6% for NO 2
 in exposure of a CF patient there is an increase risk for exacerbation of; –4.3% for PM 10 –10.6% for NO 2")
30
histopathological analysis 4 accidental deaths biomass exposed Peruvian children 3/4 “bronchitis” Am J Respir Crit Care Med. 2012; 185(6):687-8 María Alejandra Mena M.D., Fernando Woll M.D.,et al
:687-8 María Alejandra Mena M.D., Fernando Woll M.D.,et al.")
31
Am J Respir Crit Care Med. 2012; 185(6):687-8
:687-8")
36
http://eng.nema.go.kr vulnerable people avoid outdoor activity wash hands and feet on returning home check windows

37
1,025,990 pneumonia admissions 36% children

39
p value Day of dust storm0.27 1 day post0.007 2 days post0.03 3 days post0.001 4 days post0.116 5 days post0.76

42
at least 1 type of ETS exposure was associated with statistically significant increases in risk –12 of 14 studies positive for risk of hospitalization or ED visit for laboratory confirmed RSV bronchiolitis

45
J Pediatr 2013;162-21 117 children admitted with influenza 40% exposed to second hand smoke

46
SHS exposed –increased need for intensive care –increased need for intubation –increased length of stay J Pediatr 2013;162-21

49
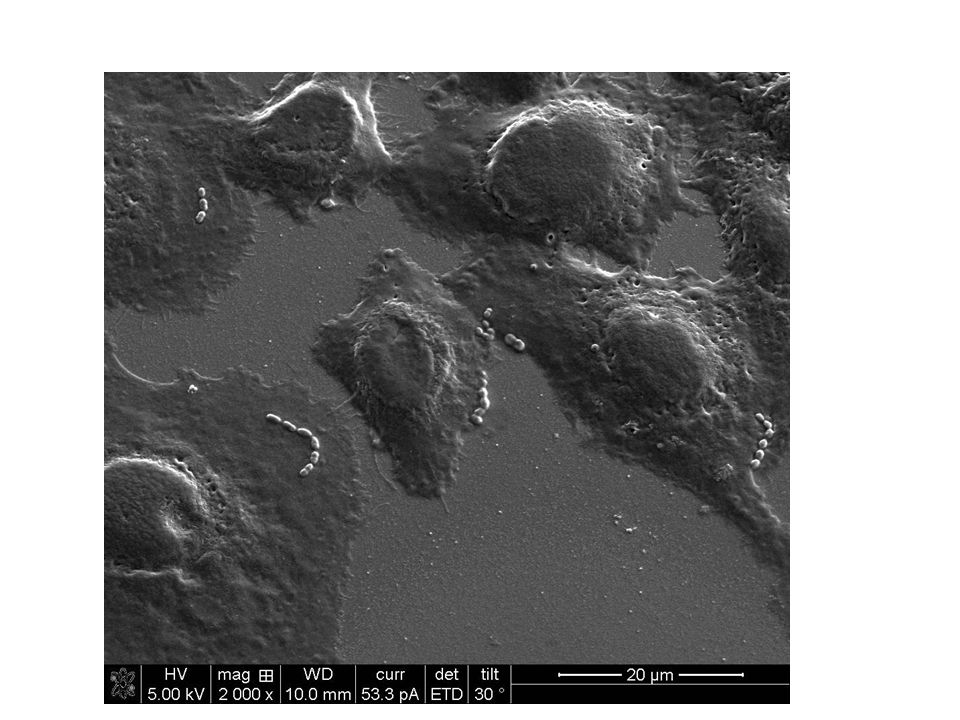
Bacterial cell wall CHoP PAFR Host airway cell wall

58
increasing evidence of an association between air pollution and both bacterial and viral respiratory tract infections more studies needed –to establish biological plausibility –biomarkers of vulnerability –linking individual exposure to risk

Similar presentations


Dr.Krock Dr.Vysetti Dr.Vysetti.>")


, ranging in severity: Acute bronchitis - an acute respiratory tract infection in.>")


