Download presentation
Presentation is loading. Please wait.

1
University of Minnesota – School of Nursing Spring Research Day Glycemic Control of Critically Ill Patients Lynn Jensen, RN; Jessica Swearingen, BCPS, PharmD; Peggy Hoeft, RN; Pam Richardson, RN; Robert Miner, MD Abbott Northwestern Hospital

2
Objectives Understand benefits of intensive (“tight”) glycemic control in critically ill patients Understand benefits of intensive (“tight”) glycemic control in critically ill patients Describe the Intensive Insulin ICU protocol implementation experience at Abbott Northwestern (ANW) Hospital Describe the Intensive Insulin ICU protocol implementation experience at Abbott Northwestern (ANW) Hospital Share patient outcome data associated with ANW Intensive Insulin ICU protocol utilization Share patient outcome data associated with ANW Intensive Insulin ICU protocol utilization
 glycemic control in critically ill patients Understand benefits of intensive ( tight ) glycemic control in critically ill patients Describe the Intensive Insulin ICU protocol implementation experience at Abbott Northwestern (ANW) Hospital Describe the Intensive Insulin ICU protocol implementation experience at Abbott Northwestern (ANW) Hospital Share patient outcome data associated with ANW Intensive Insulin ICU protocol utilization Share patient outcome data associated with ANW Intensive Insulin ICU protocol utilization")
3
Hyperglycemia in the Critically Ill Patient Population Hyperglycemia occurs in >50% in ICU patients Hyperglycemia occurs in >50% in ICU patients Multiple etiologies (e.g., counterregulatory hormone release, medications) Multiple etiologies (e.g., counterregulatory hormone release, medications) Historically, hyperglycemia treated only at very high blood glucose levels Historically, hyperglycemia treated only at very high blood glucose levels Hyperglycemia-related adverse effects (e.g., osmotic diuresis, impaired immune function) well established Hyperglycemia-related adverse effects (e.g., osmotic diuresis, impaired immune function) well established More recent evidence suggests close correlation between hyperglycemia & clinical outcome More recent evidence suggests close correlation between hyperglycemia & clinical outcome
 Multiple etiologies (e.g., counterregulatory hormone release, medications) Historically, hyperglycemia treated only at very high blood glucose levels Historically, hyperglycemia treated only at very high blood glucose levels Hyperglycemia-related adverse effects (e.g., osmotic diuresis, impaired immune function) well established Hyperglycemia-related adverse effects (e.g., osmotic diuresis, impaired immune function) well established More recent evidence suggests close correlation between hyperglycemia & clinical outcome More recent evidence suggests close correlation between hyperglycemia & clinical outcome")
4
Hyperglycemia Clinical Trials in Critically Ill Patients Open heart surgery patients with history of DM & mean BG >206 mg/dL post-op had increased risk for: Open heart surgery patients with history of DM & mean BG >206 mg/dL post-op had increased risk for: –leg & chest wound infections –pneumonia –urinary tract infections AMI patients with history of DM or hyperglycemia on hospital admission randomized to tight control (BG 126-200 mg/dL) for 3 months or usual care AMI patients with history of DM or hyperglycemia on hospital admission randomized to tight control (BG 126-200 mg/dL) for 3 months or usual care –mortality at 1 yr & 3.4 yrs by 7.5% & 11%, respectively –reinfarction & new cases of CHF decreased Golden et al. Diabetes Care 1999;22(9):1408-14; Malmberg et al. J Am Coll Cardiol 1995;26(1):57-65
: ; Malmberg et al. J Am Coll Cardiol 1995;26(1):")
5
Hyperglycemia Clinical Trials in Critically Ill Patients Mechanically ventilated, surgical ICU patients Mechanically ventilated, surgical ICU patients –majority of patients had no history of DM –randomized to tight control or standard care –after transfer from ICU both groups received standard care Results Results –mortality by 3.4% for tight control group –mortality in patients with ICU stay >5 days by 9.6% –significant in deaths due to sepsis & MODS –tight control blood transfusions (28.6% vs. 31%); dialysis (4.8% vs. 8.2%); mechanical ventilation >14 days (7.5% vs. 11.9%); or ICU stay >14 days (11.4% vs. 15.7%) Van den Berghe et al. NEJM 2001;345(19):1359-67.
; dialysis (4.8% vs. 8.2%); mechanical ventilation >14 days (7.5% vs. 11.9%); or ICU stay >14 days (11.4% vs. 15.7%) Van den Berghe et al. NEJM 2001;345(19):")
6
Observational trial in Med/Surg/Neuro/Cardiac ICU Observational trial in Med/Surg/Neuro/Cardiac ICU Before & after design Before & after design –historical controls vs. consecutive protocol patients –protocol group received insulin infusion after 2 successive BG levels >200 mg/dL –BG goal <140 mg/dL Results Results –mean BG from 152.3 mg/dL to 130.7 mg/dL –protocol significantly mortality from 20.9% to 14.8% –most striking in mortality for septic shock, neurologic & surgical patients –BG>200 mg/dL from 16.7% to 7.1% –hypoglycemia did not increase (0.35% vs. 0.34%) Hyperglycemia Clinical Trials in Critically Ill Patients Krinsley et al. Mayo Clin Proc 2004;79(8)992-1000
 Hyperglycemia Clinical Trials in Critically Ill Patients Krinsley et al. Mayo Clin Proc 2004;79(8)")
7
ANW Intensive Insulin Protocol Implementation Experience Multidisciplinary team of physicians, pharmacists & nurses from each ICU Multidisciplinary team of physicians, pharmacists & nurses from each ICU Revision of existing Med/Surg/Neuro ICU protocol Revision of existing Med/Surg/Neuro ICU protocol Desktop computer protocol developed Desktop computer protocol developed New protocol implemented in all ICUs May 2004 New protocol implemented in all ICUs May 2004 Nurses in all ICUs educated Nurses in all ICUs educated Additional resources available during first 5 days of protocol implementation Additional resources available during first 5 days of protocol implementation

8
ANW blood glucose goal range: 90-120 mg/dL ANW blood glucose goal range: 90-120 mg/dL All protocol patients received: All protocol patients received: –insulin infusion –hourly blood glucose checks until within goal range, then every two hours Data collected on: Data collected on: –mean blood glucose –efficacy attaining goal range –episodes of hypoglycemia –patient outcomes ANW Intensive Insulin Protocol Implementation Experience

9
Continued to make changes to protocol & provide feedback Continued to make changes to protocol & provide feedback Challenges during implementation Challenges during implementation –physician (surgeon) acceptance –limited glucometer availability –multiple patient sticks/blood draws –nursing acceptance due to workload –computer dosing based on last 2 BG values ANW Intensive Insulin Protocol Implementation Experience
 acceptance –limited glucometer availability –multiple patient sticks/blood draws –nursing acceptance due to workload –computer dosing based on last 2 BG values ANW Intensive Insulin Protocol Implementation Experience")
10
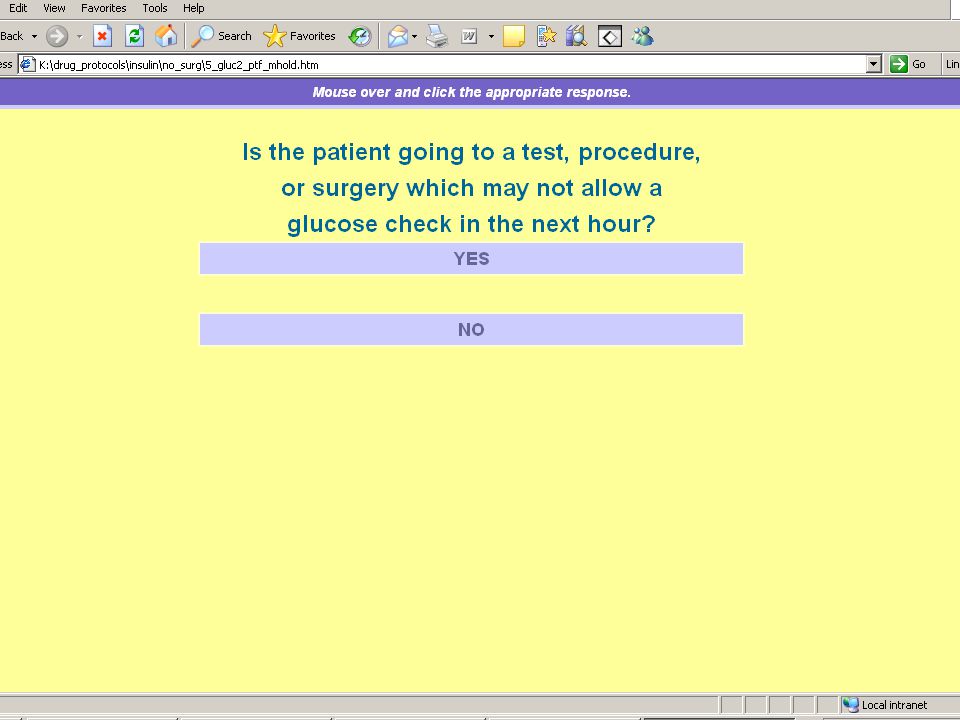
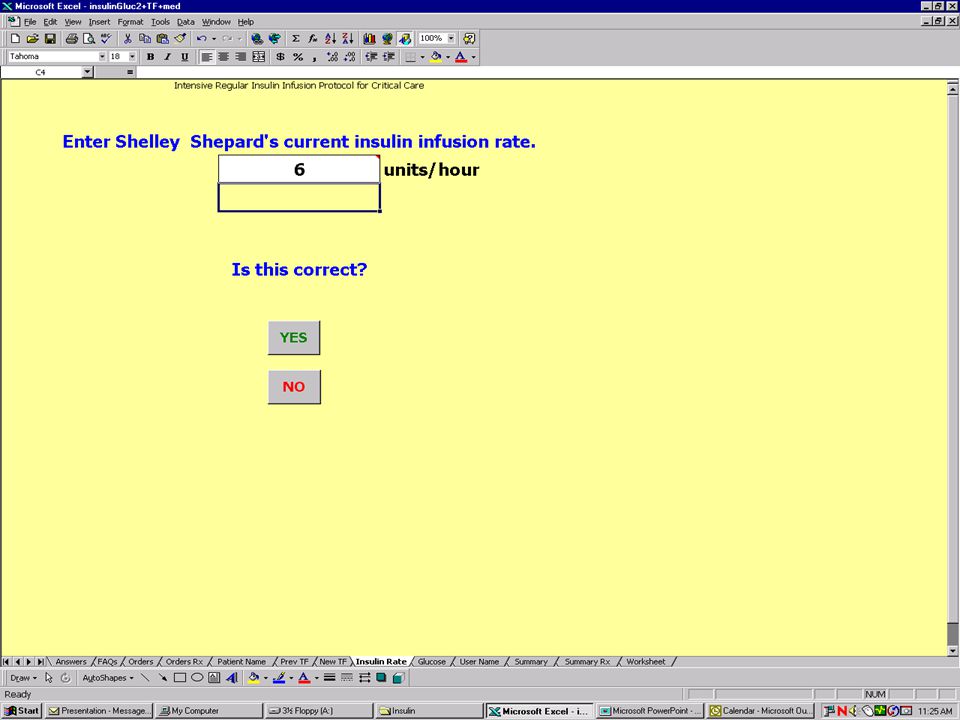
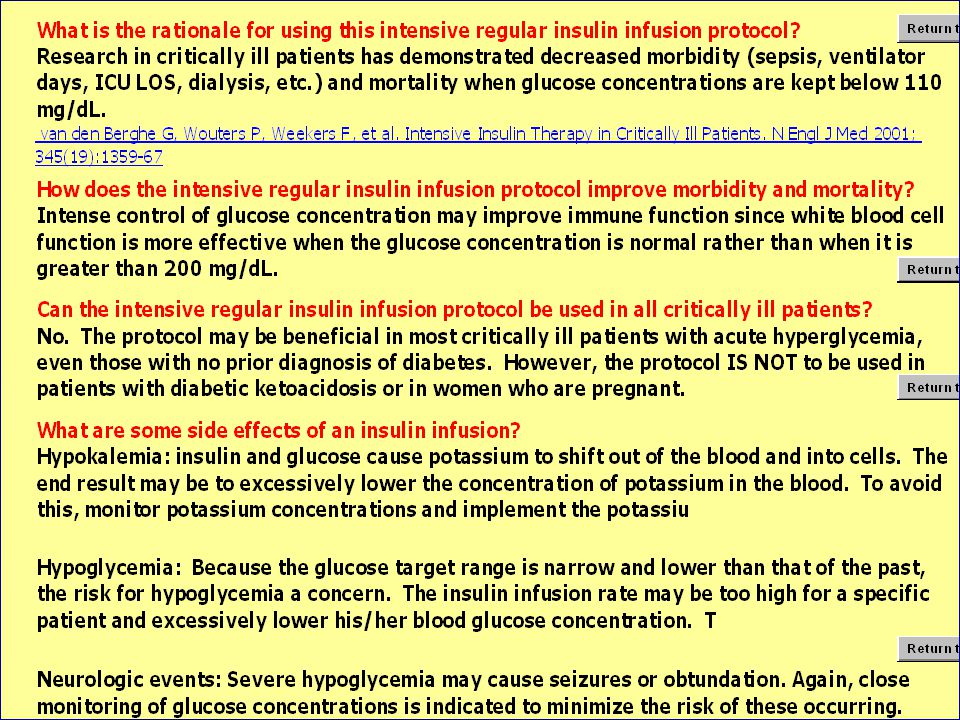
Protocol Example ANW Intensive Insulin Protocol Implementation Experience

21
ANW Intensive Insulin Protocol Data CVICUCCU Pre-protocol (81 patients; 5227 BG values) Post-protocol (139 patients; 14192 BG values) Pre-protocol (25 patients; 1639 BG values) Post-protocol (65 patients; 8141 BG values) BG in goal range (90– 120 mg/dL) 22%36%20%33% Mean BG (mg/dL) 158133162138 BG ≥ 200 mg/dL 18%7%23%10% BG < 60 mg/dL 0.6% 1.1%0.6%
 Post-protocol (139 patients; BG values) Pre-protocol (25 patients; 1639 BG values) Post-protocol (65 patients; 8141 BG values) BG in goal range (90– 120 mg/dL) 22%36%20%33% Mean BG (mg/dL) BG ≥ 200 mg/dL 18%7%23%10% BG < 60 mg/dL 0.6% 1.1%0.6%")
22
ANW Intensive Insulin Protocol Data Patient DemographicsPre-Protocol (n = 50) Post-Protocol (n = 50) Mean Age (years)66.865.6 Sex (% male)5967 Ventilated (%)7680 History of Diabetes (%)8474 High Risk for Hyperglycemia (%)7061 Admit Diagnosis (%) -Cardiovascular6975 -Renal105 -Pulmonary610 -Other1510
 Post-Protocol (n = 50) Mean Age (years) Sex (% male)5967 Ventilated (%)7680 History of Diabetes (%)8474 High Risk for Hyperglycemia (%)7061 Admit Diagnosis (%) -Cardiovascular6975 -Renal105 -Pulmonary610 -Other1510")
23
ANW Intensive Insulin Protocol Data OutcomesPre-Protocol (n = 50) Post-Protocol (n = 50) Mean Blood Glucose (mg/dL)168133 Hypoglycemic Events (%)0.220.23 Hospital Mortality (%)1411 New Onset Renal Dysfunction (%)4431 Mean Hospital Length of Stay (days)1713 Blood Product Administration (%)6152
 Post-Protocol (n = 50) Mean Blood Glucose (mg/dL) Hypoglycemic Events (%) Hospital Mortality (%)1411 New Onset Renal Dysfunction (%)4431 Mean Hospital Length of Stay (days)1713 Blood Product Administration (%)6152")
24
Conclusions Tight glycemic control can significantly improve morbidity & mortality in critically ill surgical patients Tight glycemic control can significantly improve morbidity & mortality in critically ill surgical patients Barriers to implementation can be overcome Barriers to implementation can be overcome Nurses can significantly impact mortality & patient outcome by managing blood glucose more tightly Nurses can significantly impact mortality & patient outcome by managing blood glucose more tightly

25
Any Questions?

Similar presentations


![INSULIN THERAPY IN ICU Dr SANJAY KALRA, D.M. [AIIMS]](/1/259452/big_thumb.jpg "INSULIN THERAPY IN ICU Dr SANJAY KALRA, D.M. [AIIMS]>")


 for severe sepsis and septic shock treatment>")


![MODELING METHOD Glucose-Insulin System Model CLINICAL DATA DATA: Are taken from the SPRINT [3] TGC cohort totalling 393 patients and ~40,000 patient hours.](/14/4293157/big_thumb.jpg "MODELING METHOD Glucose-Insulin System Model CLINICAL DATA DATA: Are taken from the SPRINT [3] TGC cohort totalling 393 patients and ~40,000 patient hours.>")


