Download presentation
Presentation is loading. Please wait.

1
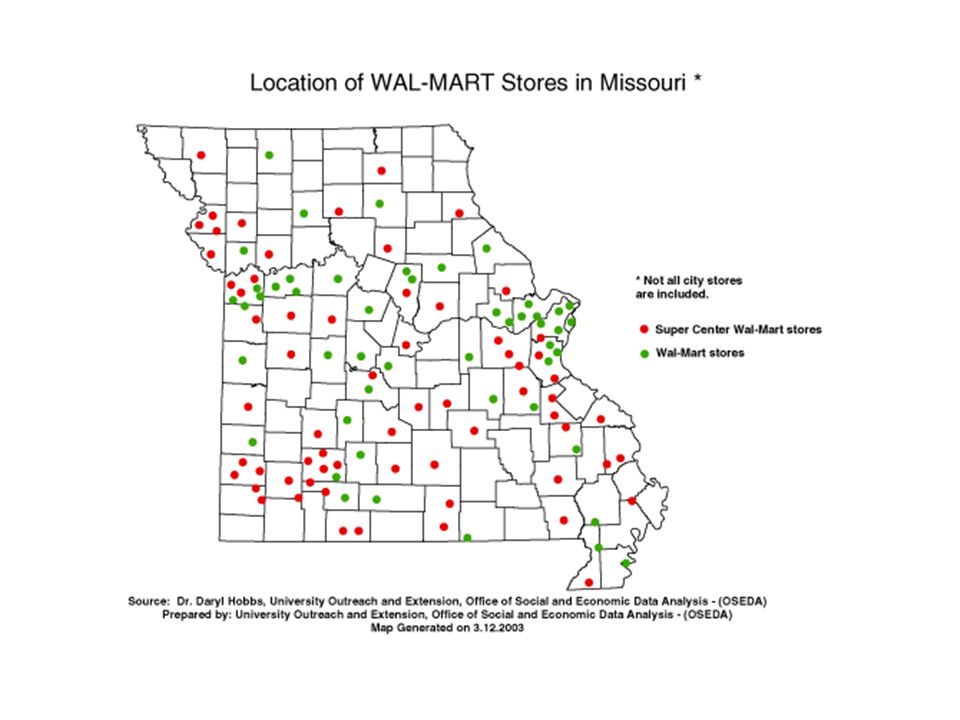
“Missouri’s Changing Face: Opportunities and Challenges of Tomorrow” by Dr. Daryl J. Hobbs March 15,2004 http://www.oseda.missouri.edu Missouri Department of Natural Resources Conference on Demographic Change

4
New Economic Development Considerations 1.Globalization 2.Revolution in Telecommunications 3.Cost of Living 4.Quality of Life

6
Number of Missouri Local Governments by Type - States: 1997 Source: U.S. Census Bureau, Statistical Abstract of the United States: 2000

7
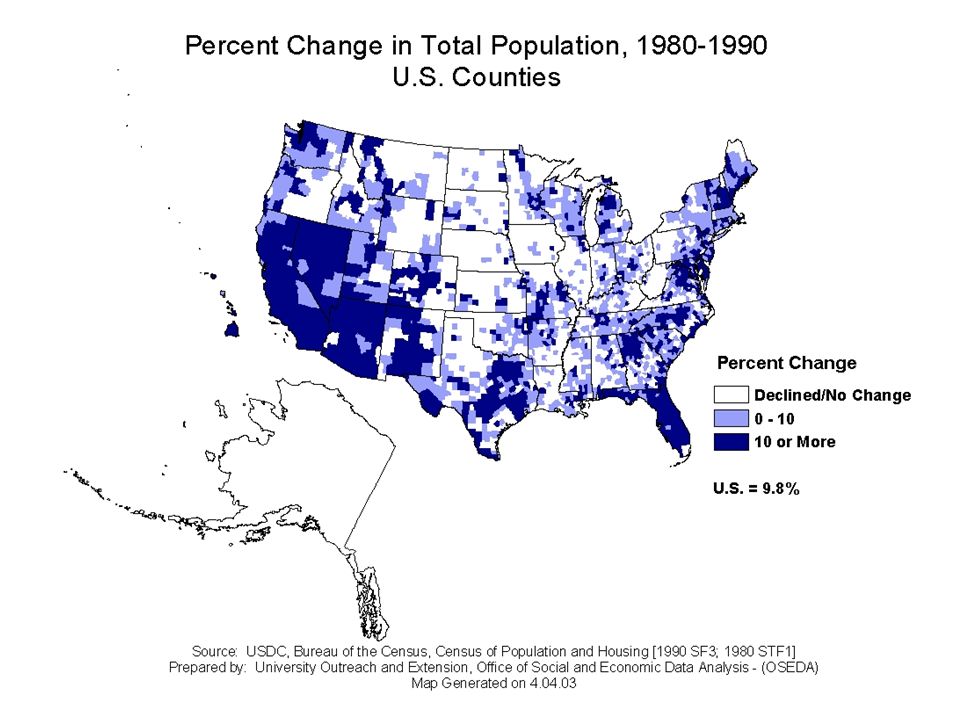
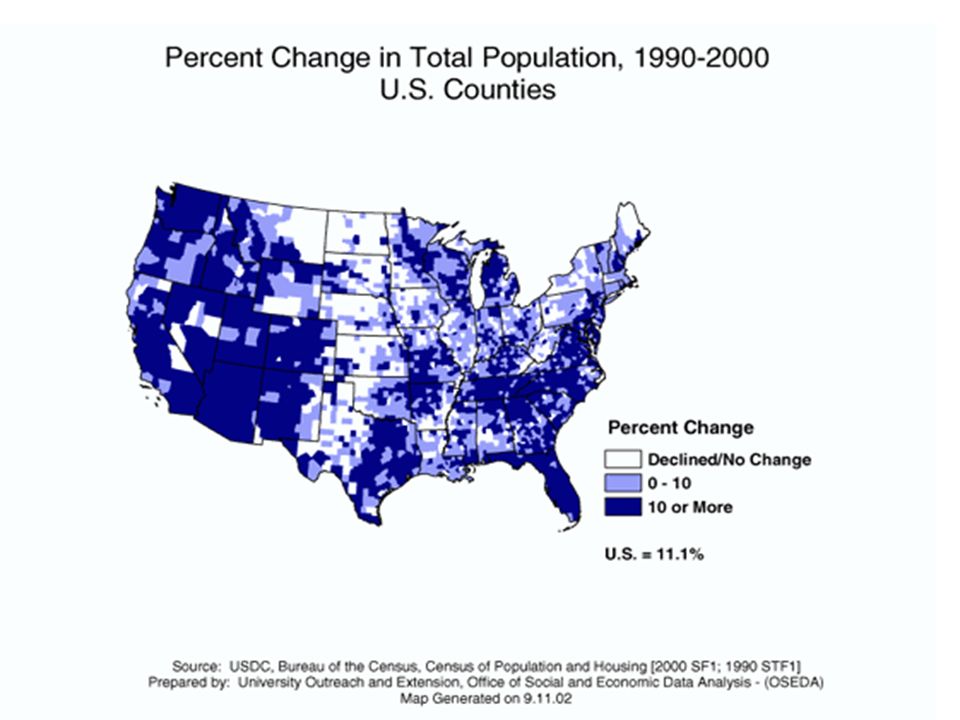
Change in Population 1980-2000 Missouri’s population increased from 4,917,000 in 1980 to 5,117,000 in 1990 – an increase of 4.1 percent. Population increased from 5,117,000 in 1990 to 5,595,000 in 2000 – an increase of 9.3 percent – more than double the increase during the 1980s. However, national population which increased by 9.8 percent during the 1980s increased by 13.1 percent in 2000. There were 29 states whose population increased by a larger percentage than Missouri during the 1990s. Therefore, even though Missouri population increased by more than twice the rate in the 1990s than during the 1980s, it dropped from being the 15 th most populated state in 1990 to 17 th in 2000.

11
Missouri’s Metro and Non-Metro Population SOURCE: USDC, Bureau of the Census, Census of Population and Housing [2000 SF1; 1990 STF1] Table produced by: University Outreach and Extension, Office of Social and Economic Data Analysis (Feb. 2002)
![Missouri’s Metro and Non-Metro Population SOURCE: USDC, Bureau of the Census, Census of Population and Housing [2000 SF1; 1990 STF1] Table produced by: University Outreach and Extension, Office of Social and Economic Data Analysis (Feb.](http://images.slideplayer.com/33/8226880/slides/slide_11.jpg "2002).")
19
Characteristics of Population, 2000

20
Households

25
Percent Change in Missouri Population by Age Cohorts, 1990-2000 SOURCE: USDC, Bureau of the Census, Census of Population and Housing, Summary File 1 (2000); Summary Tape File 1 (1990) Produced by: The Office of Social and Economic Data Analysis, UOE [E.J. Cleveland, Nov. 2001]

31
Impact of Transfer Payments

32
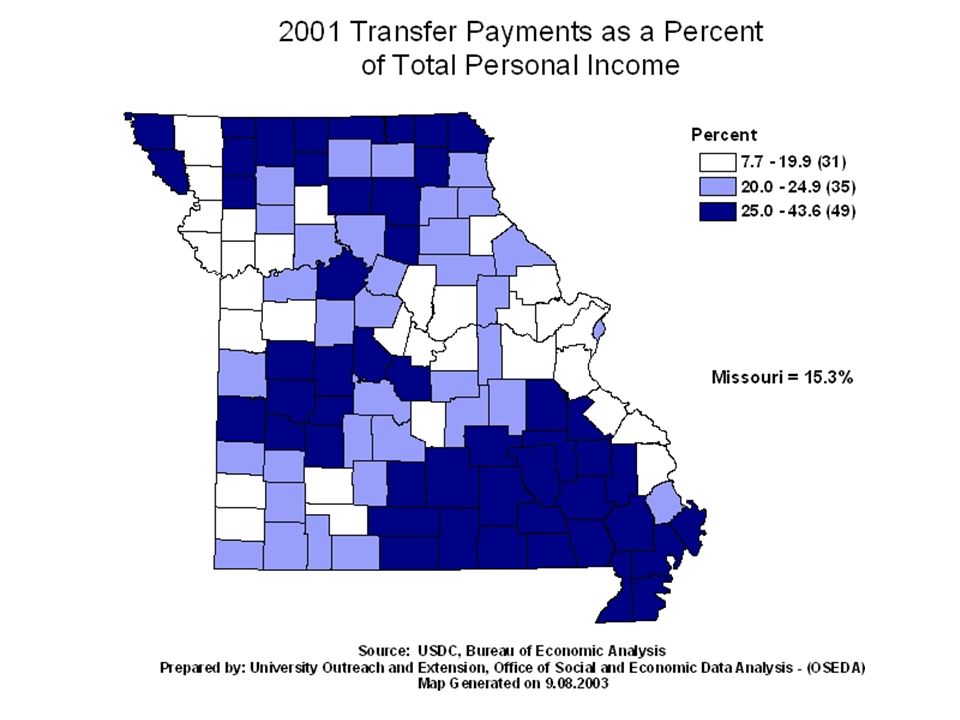
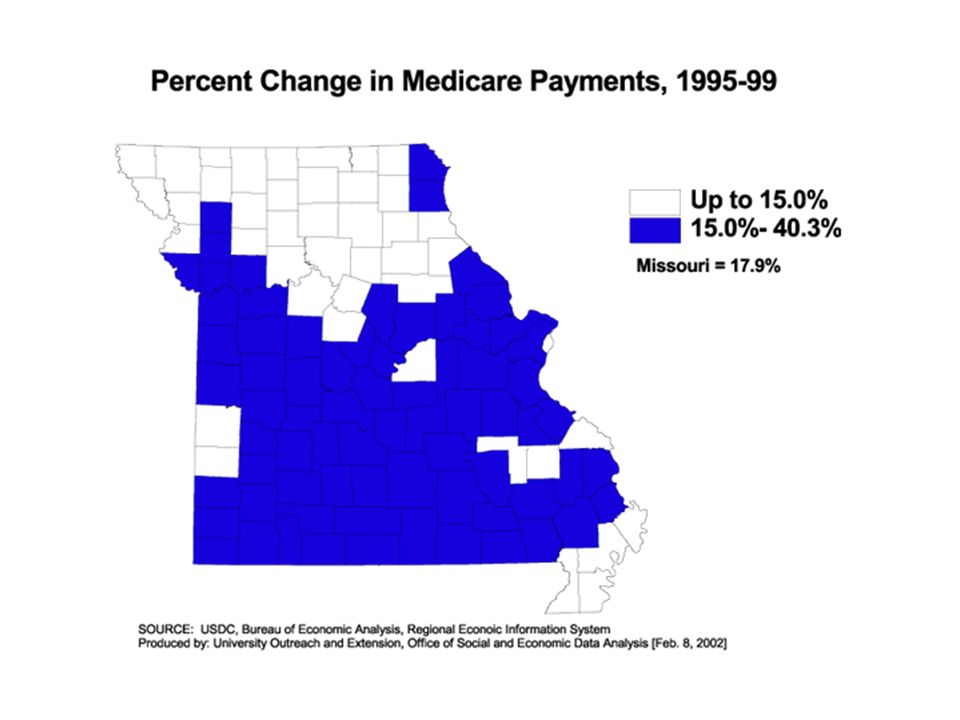
Transfer Payments as a Percent of Total Personal Income 2000 Transfer payments have become an important part of income, especially in many rural counties. Transfer payments are a part of personal income for those persons who are entitled to them. In fact, those payments are often referred to as entitlements. They include such well known programs as Social Security, Medicare, Medicaid, unemployment compensation, etc. The types of payments are shown on the following graph which indicates that 41 percent of total transfer payments are Social Security, 21 percent are Medicare and 19 percent Medicaid. Together, Social Security and Medical payments account for more than 80 percent of total transfer payments. The map shows there are 75 counties in which transfer payments account for more than 20 percent of total county personal income. In 16 of those counties transfer payments account for more than 30 percent of total personal income. It is generally in smaller rural counties in which transfer payments account for more than 20 percent of personal income. The greatest concentrations of those counties are in rural north and rural southeast.

34
Missouri Transfer Payments, 1999 ($000) Source: USDC, Bureau of Economic Analysis, Regional Economic Information System
 Source: USDC, Bureau of Economic Analysis, Regional Economic Information System")
35
Prepared by: University Outreach and Extension, Office of Social and Economic Data Analysis - (OSEDA)
")
38
Racial Minorities

41
Latino Population

42
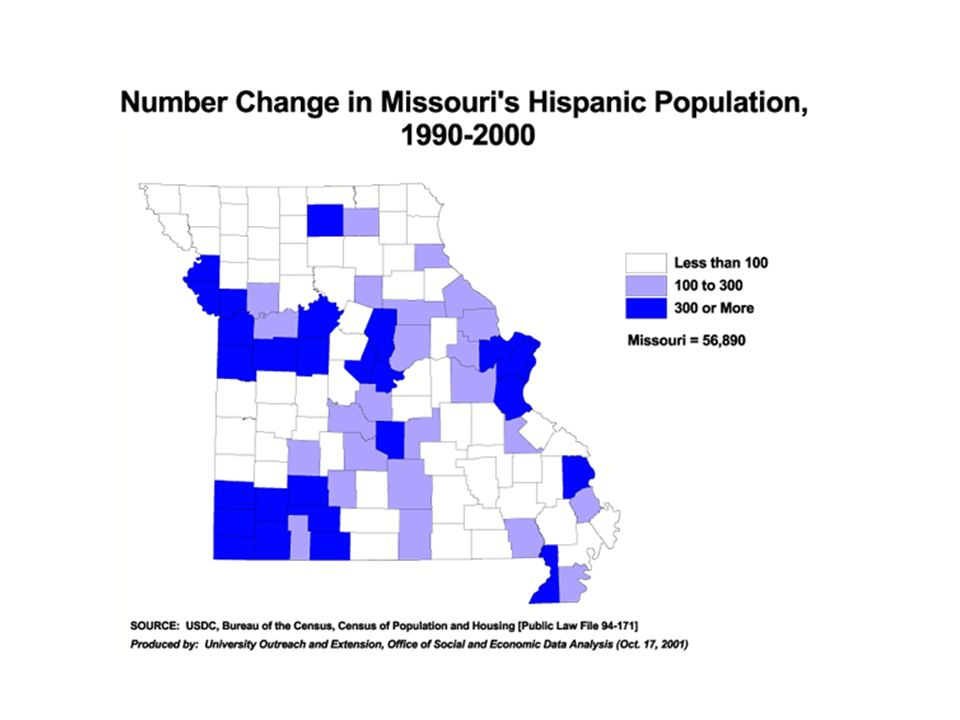
Missouri Hispanic Population, 1990-2000 NOTE: * Newton is a metropolitan county but is included in the Top 8 agriculture producing counties ** The eight Missouri counties having the greatest agricultural commodity sales also had the greatest non-metro Hispanic population increases during the 1990s Source: USDC, Bureau of the Census, "Census of Population and Housing"

44
Hispanic School Enrollment in McDonald County by School Year SOURCE: Missouri Department of Elementary and Secondary Education, Core Data Prepared by: University Outreach and Extension, Office of Social and Economic Data Analysis – (OSEDA) Chart Generated on 3.5.2002
 Chart Generated on")
45
Hispanic School Enrollment in Taney County by School Year SOURCE: Missouri Department of Elementary and Secondary Education, Core Data Prepared by: University Outreach and Extension, Office of Social and Economic Data Analysis – (OSEDA) Chart Generated on 3.5.2002
 Chart Generated on")
46
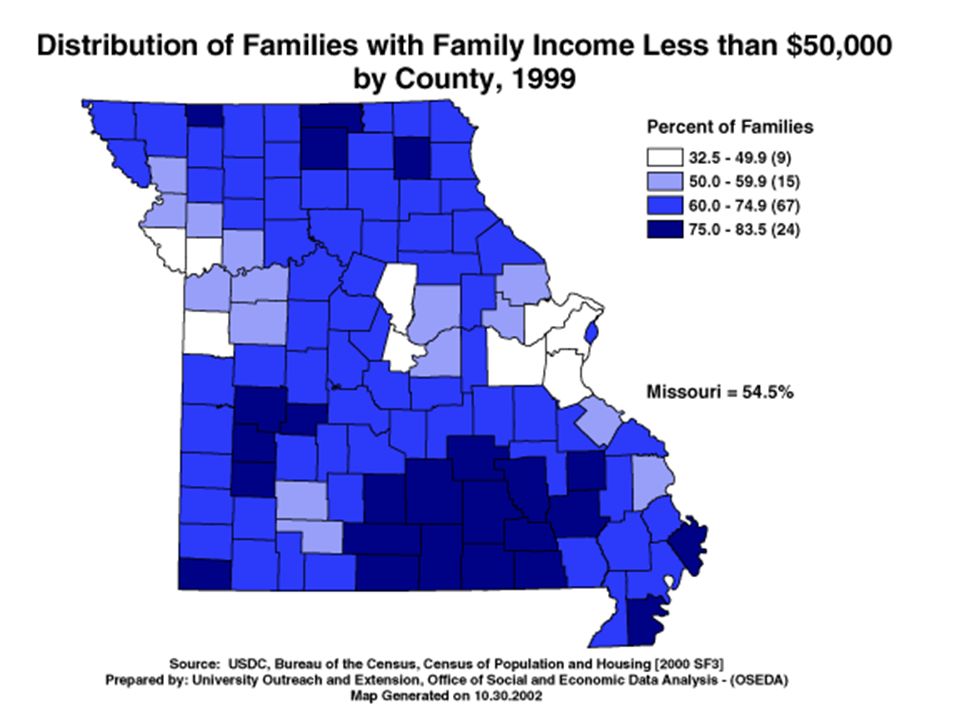
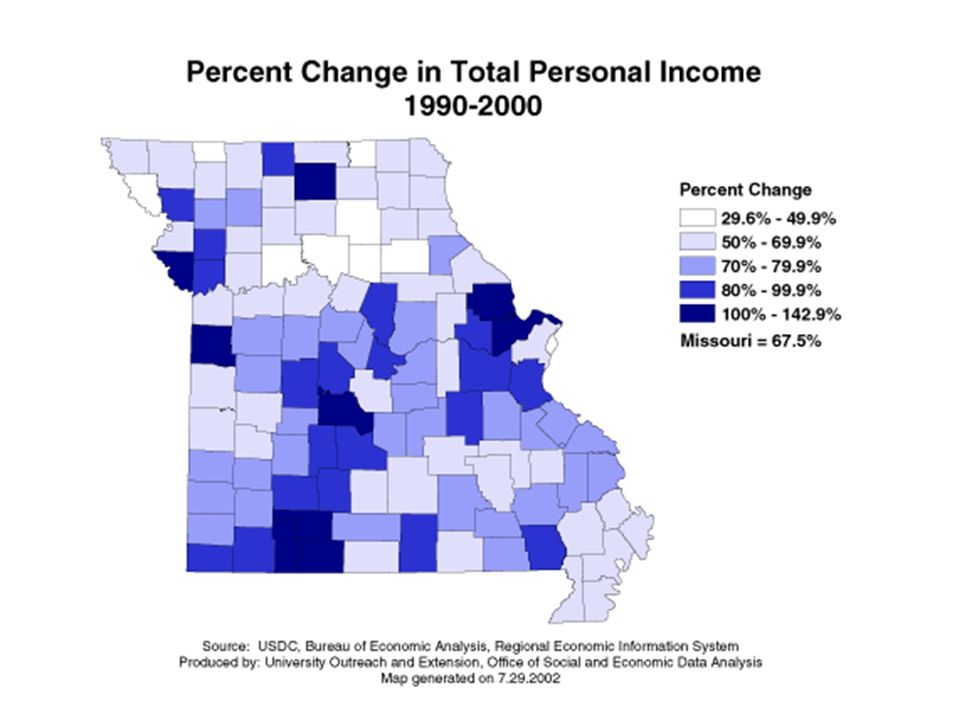
Income

51
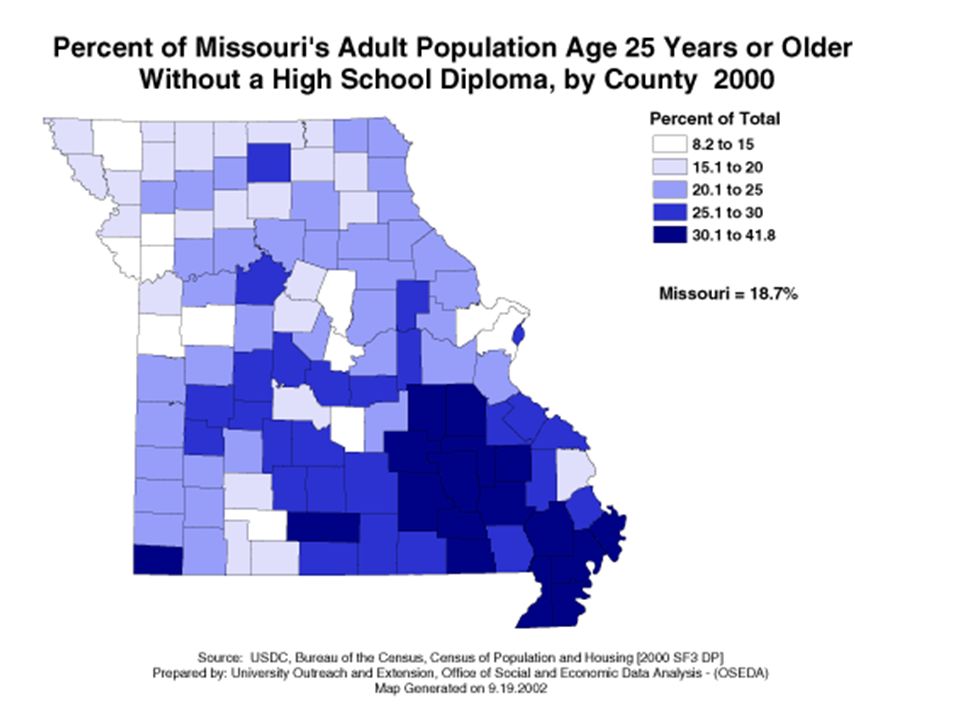
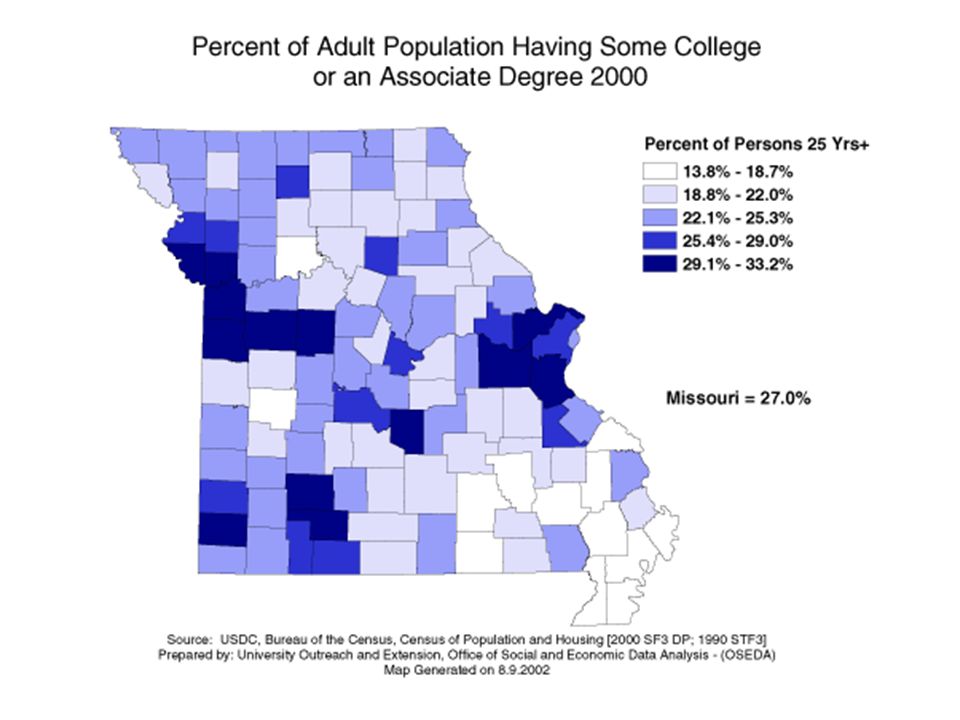
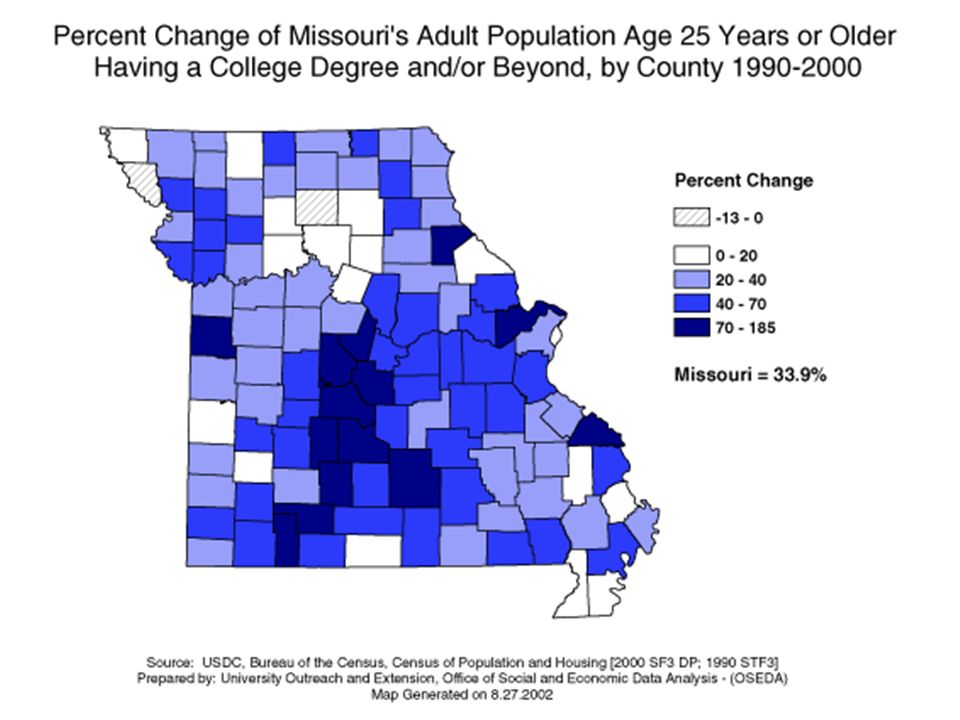
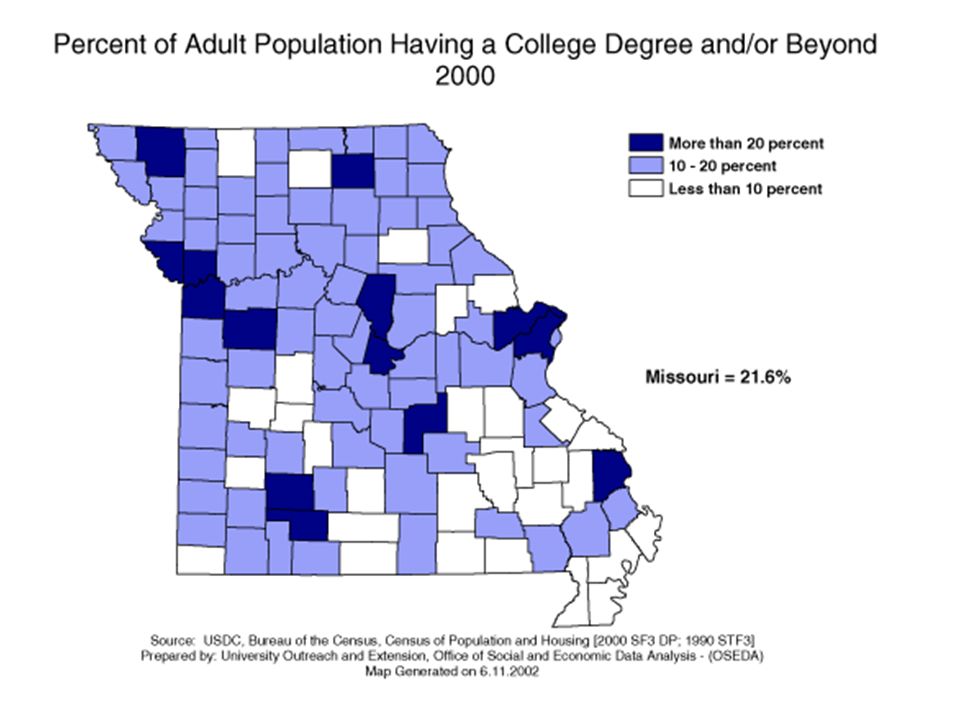
Education

58
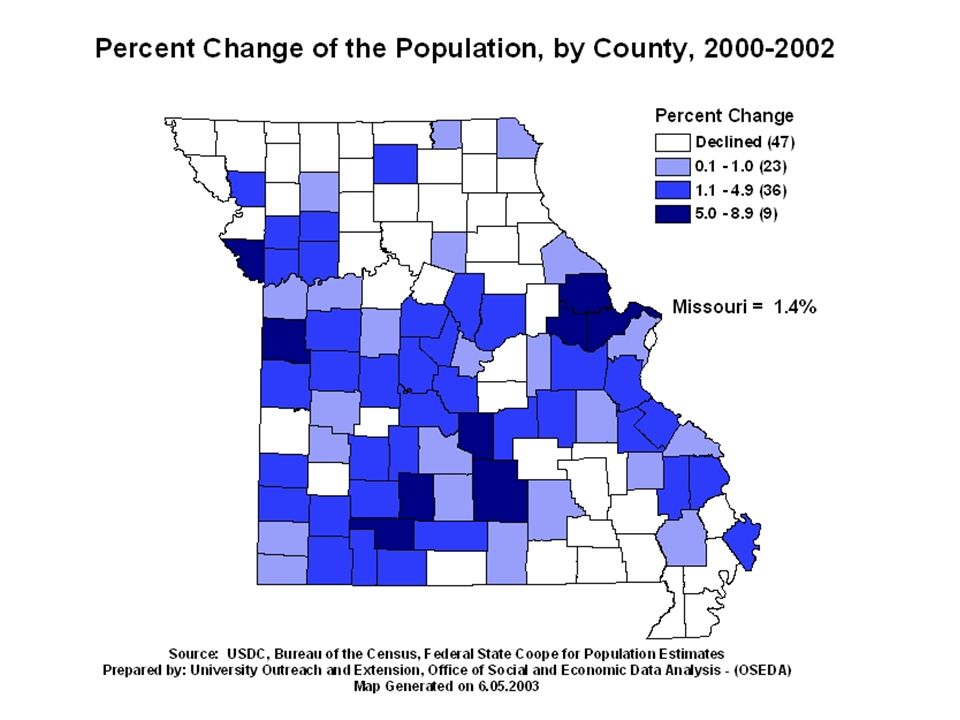
Population Change by Year, 2000-2002

60
Total Population Estimates by Year, 1990-2002 Missouri SOURCE: Federal-State Cooperative Program for Population Estimates Produced by: University Outreach and Extension – Office of Social and Economic Data Analysis (6/12/03)
")
61
Change in Total Population Estimates by Year, 1990-2002 Missouri SOURCE: Federal-State Cooperative Program for Population Estimates Produced by: University Outreach and Extension – Office of Social and Economic Data Analysis (6/12/03)
")
62
Change in Total Population Estimates by Year, 1990-2002 Southeast Missouri Extension Region SOURCE: Federal-State Cooperative Program for Population Estimates Produced by: University Outreach and Extension – Office of Social and Economic Data Analysis (6/12/03)
")
63
Change in Total Population Estimates by Year, 1990-2002 Southwest Missouri Extension Region SOURCE: Federal-State Cooperative Program for Population Estimates Produced by: University Outreach and Extension – Office of Social and Economic Data Analysis (6/12/03)
")
64
School Enrollment

65
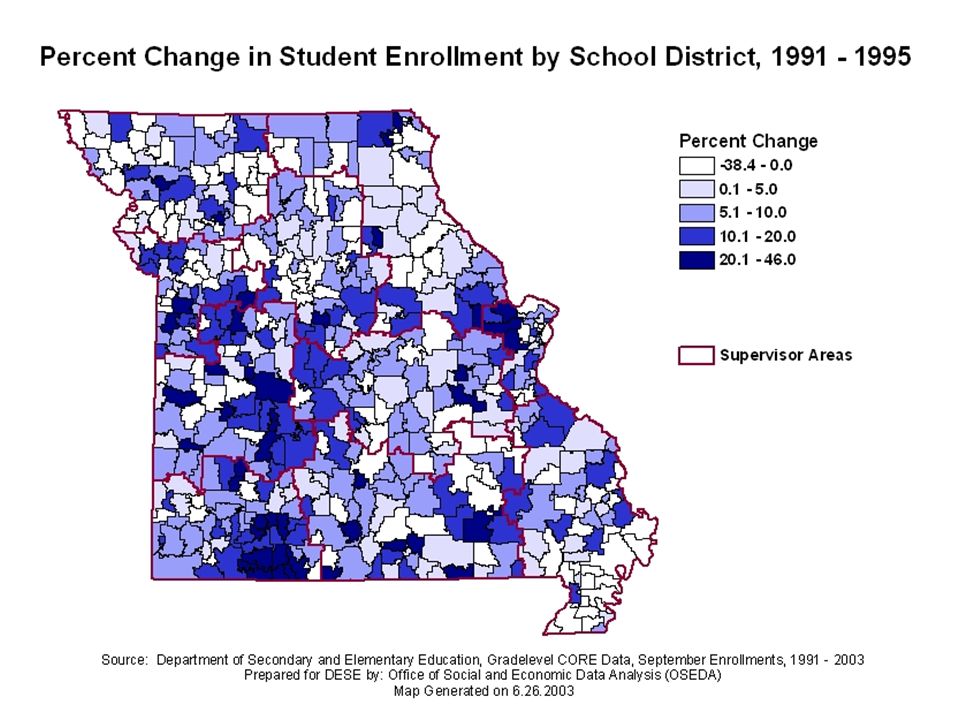
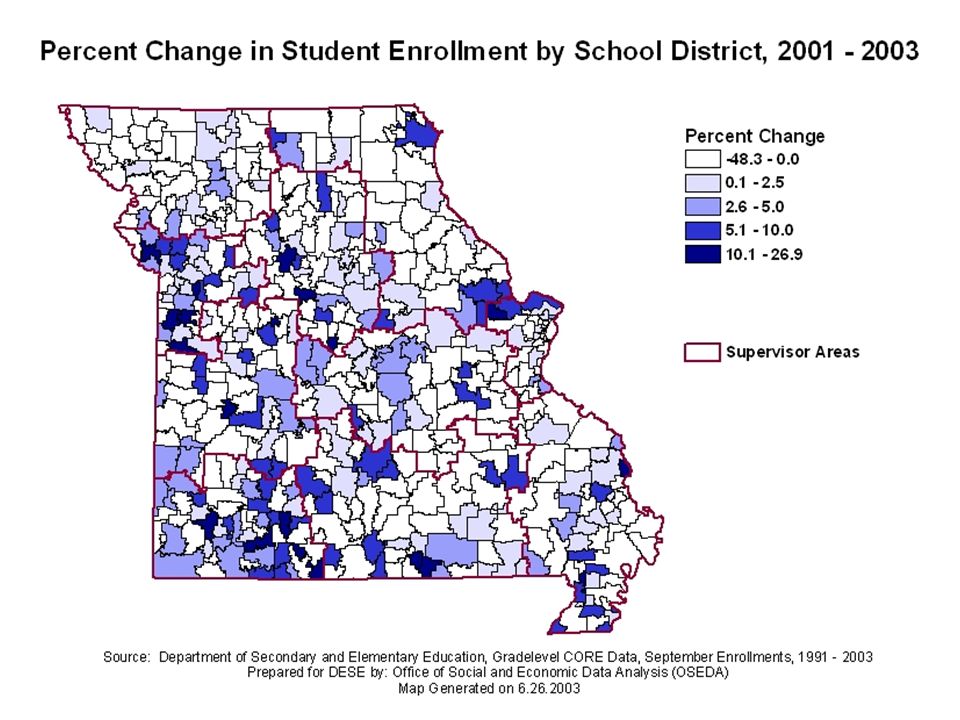
Percent Change in School Enrollment Missouri SOURCE: Missouri Department of Elementary and Secondary Education Produced by: University Outreach and Extension – Office of Social and Economic Data Analysis (6/26/03)
")
66
Annual Numerical Change in Total School Enrollment by Year, 1991-2003 (in thousands) Missouri SOURCE: Missouri Department of Elementary and Secondary Education Produced by: University Outreach and Extension – Office of Social and Economic Data Analysis (6/26/03)
 Missouri SOURCE: Missouri Department of Elementary and Secondary Education Produced by: University Outreach and Extension – Office of Social and Economic Data Analysis (6/26/03)")
70
To obtain Population Estimates for your County or City go to: http://mcdc.missouri.edu/trends/estimates.html

71
Regions New Core Based Statistical Areas

73
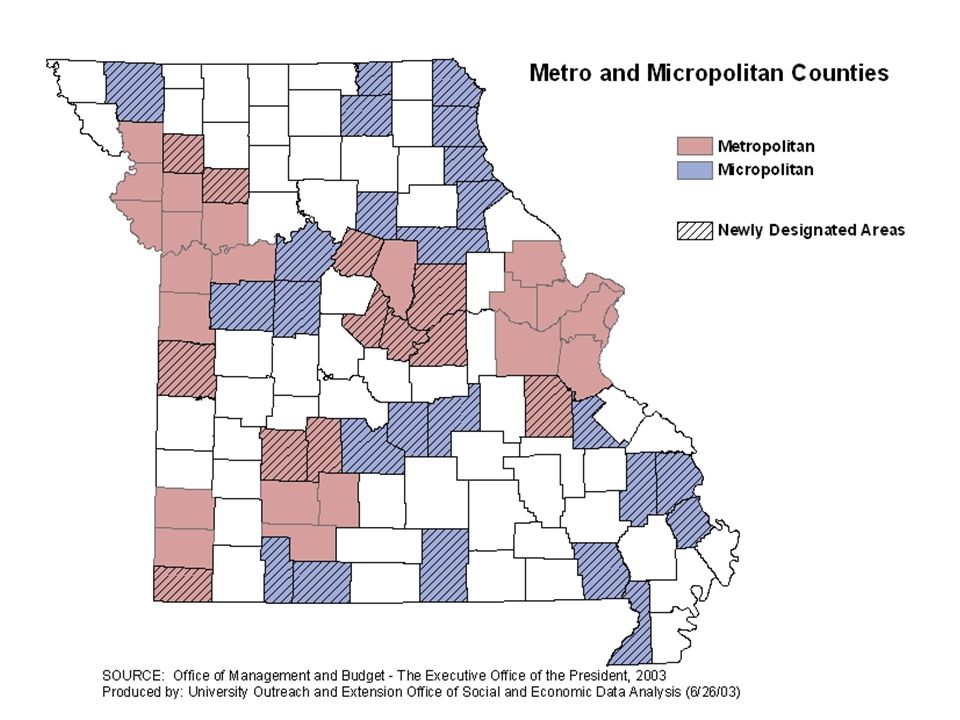
The Missouri Census Data Center has created a report that shows the just released definitions of Core Based Statistical Areas for Missouri. The CBSA's are a replacement for the metropolitan areas. We still have entities called MSA's (Metropolitan Statistical Areas) but the criteria for defining them has changed. It changed just enough to allow Jefferson City to now be classified as an MSA even though it does not have a central city of 50,000. Instead it has a "core area" with 50,000 people and it doesn't matter whether this population cluster happens to all fall within an incorporated place. Entirely new micropolitan areas have also been created based on the same concept as MSA’s except the core area does not have to be as large. Missouri has lots of these.
 but the criteria for defining them has changed. It changed just enough to allow Jefferson City to now be classified as an MSA even though it does not have a central city of 50,000. Instead it has a core area with 50,000 people and it doesn t matter whether this population cluster happens to all fall within an incorporated place. Entirely new micropolitan areas have also been created based on the same concept as MSA’s except the core area does not have to be as large. Missouri has lots of these..")
74
REGIONALIZATION WORK RETAIL TRADE HEALTH CARE IMPLICATIONS Community Public Finance

76
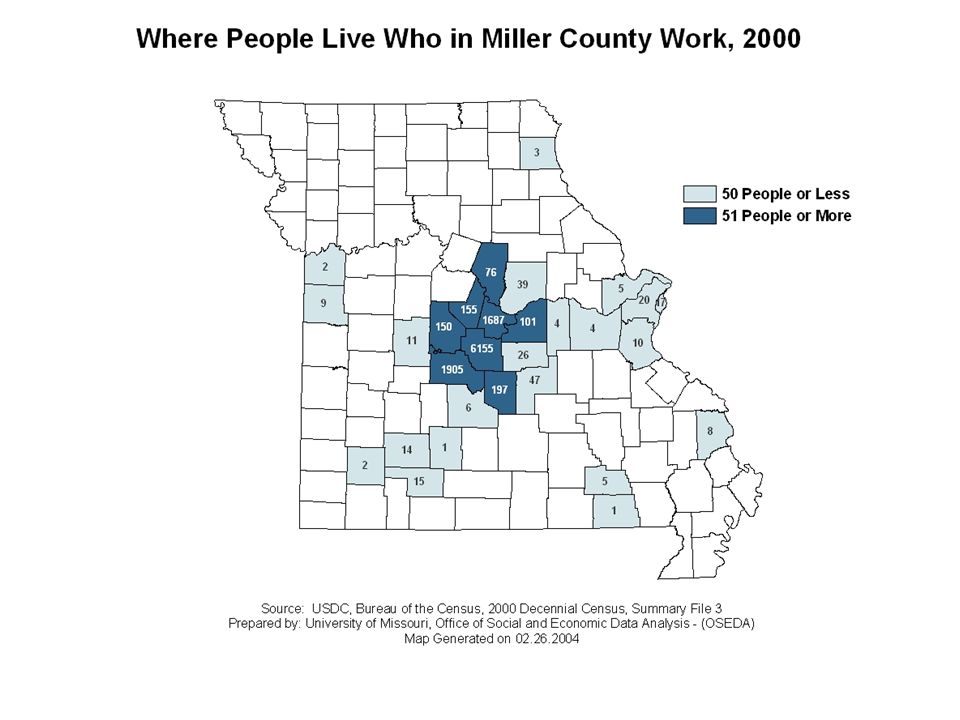
To obtain 2000 County to County Work Flow Reports go to: http://mcdc2.missouri.edu/data/workflow/reports/

84
CONSIDERATIONS REGARDING REGIONS › All Economies are Regional › Regional Centers are vital to regional viability: They are essential to growth but not necessarily the location of growth. The population of a place is not necessarily the determining factor in whether it is a regional center or not. › Missouri is one of the most economically, geographically and culturally diverse states in the U.S It would facilitate planning and delivery of services if regional boundaries were drawn so that counties within a region were relatively homogeneous while the differences between regions would be relatively great. That would facilitate more effective targeting of training and educational services. Ironically regional centers are more alike than the regions they serve. › Transportation routes are a consideration in establishing regional boundaries. A concern is accessibility and it is easier to get to some regional centers from one direction than another.

85
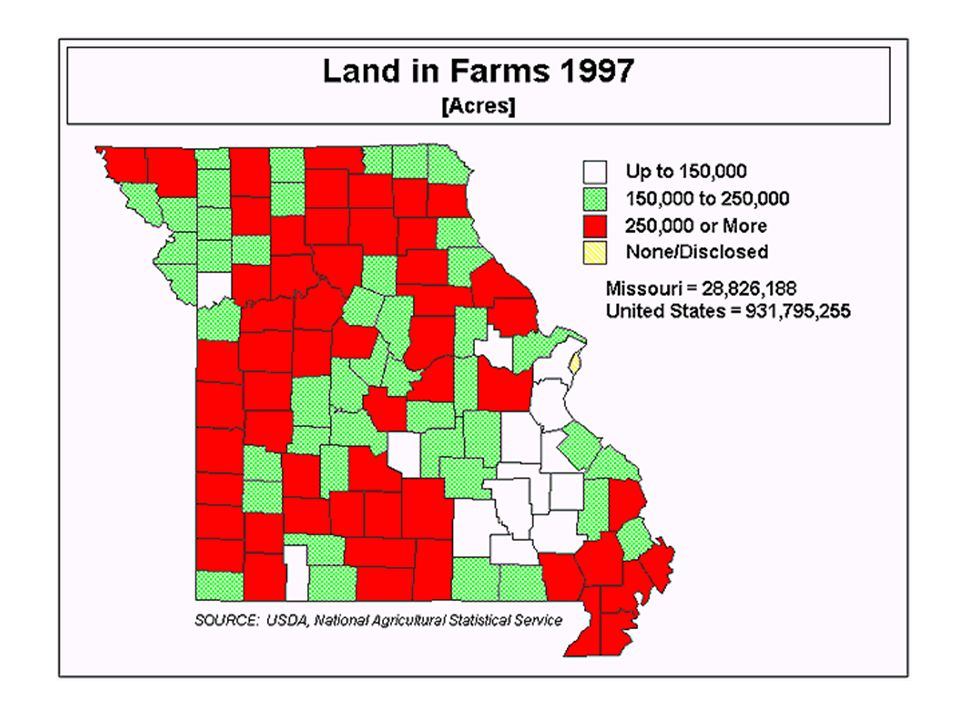
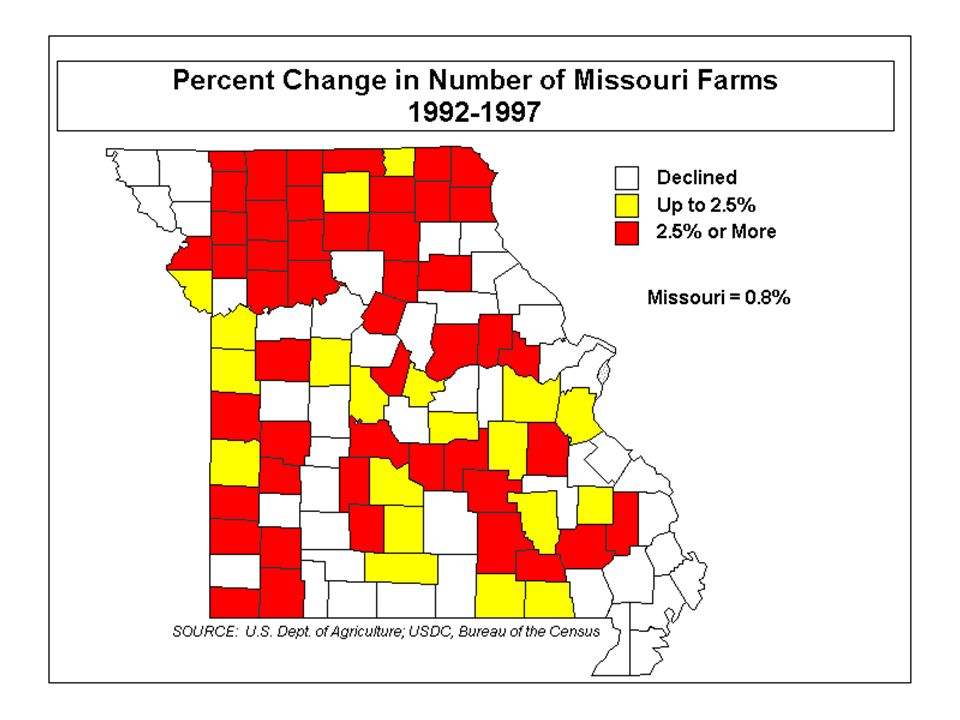
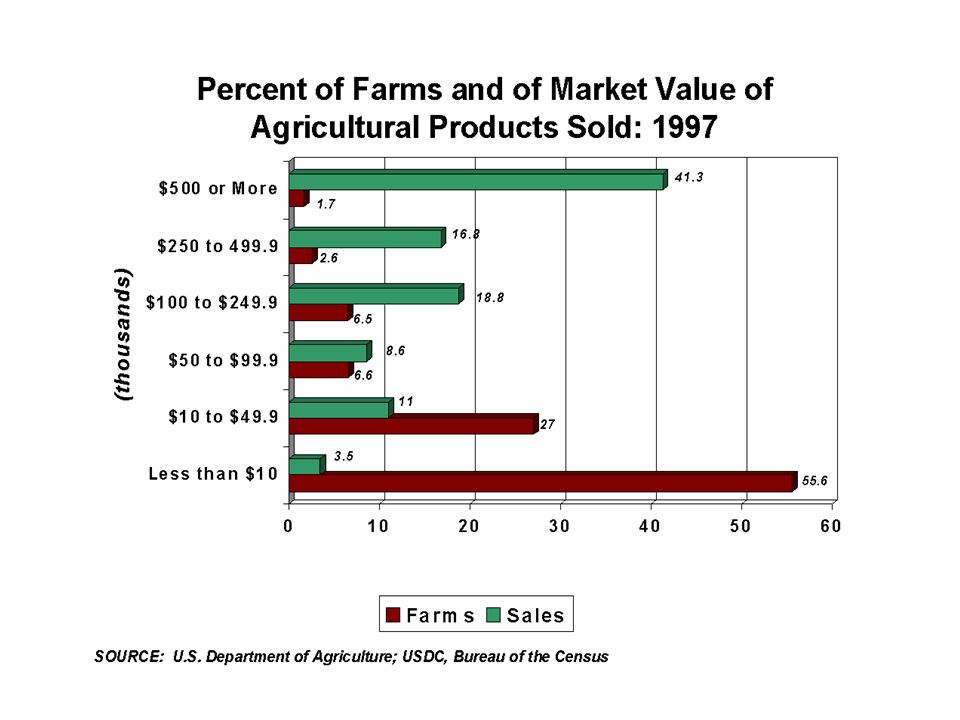
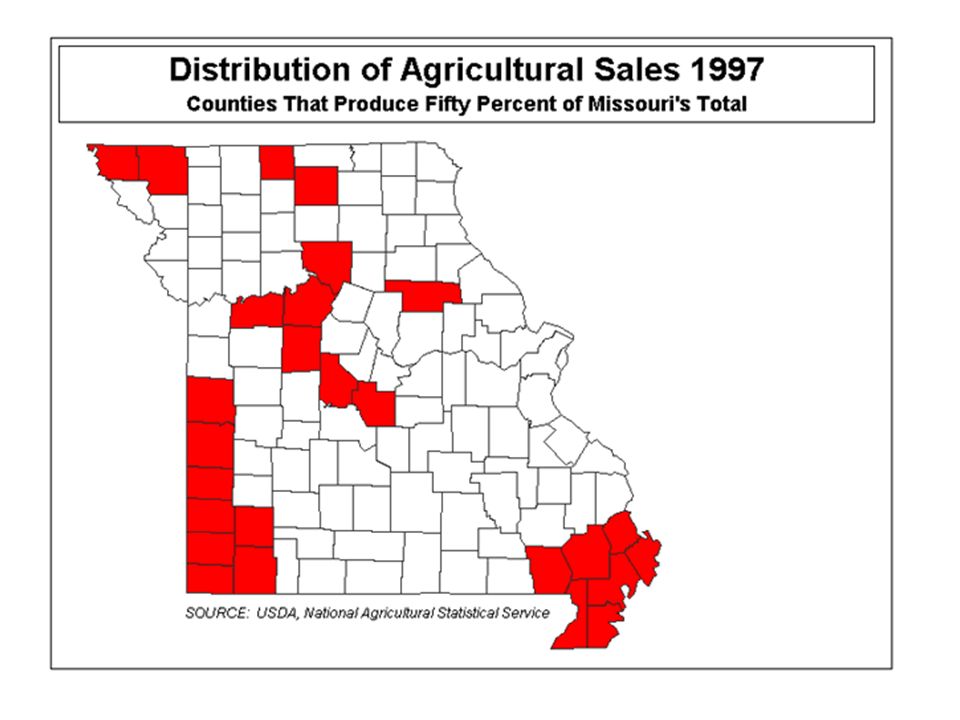
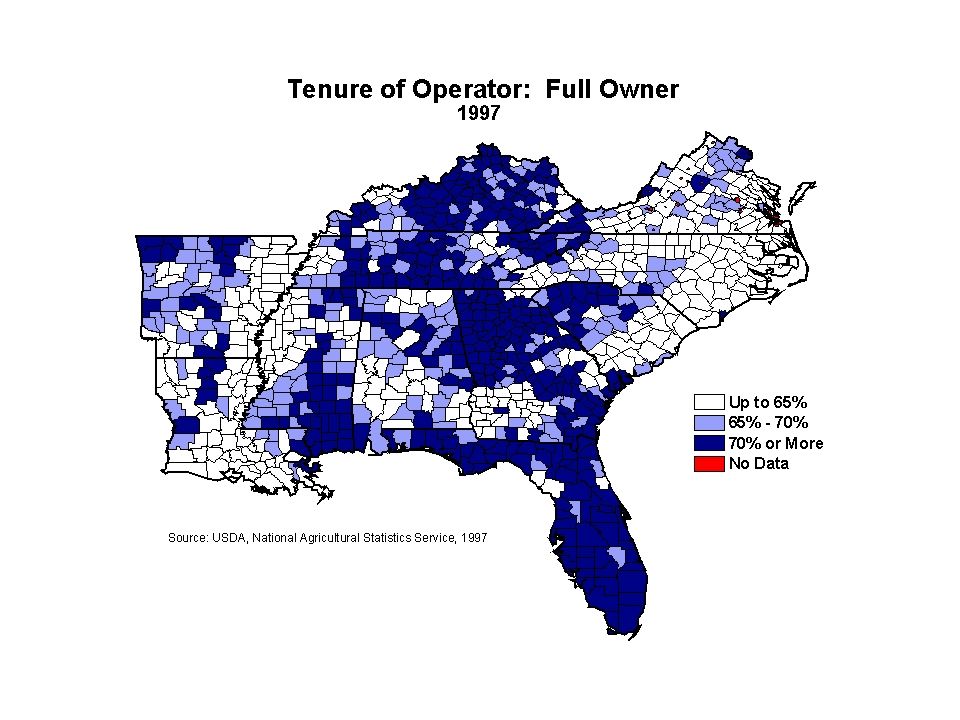
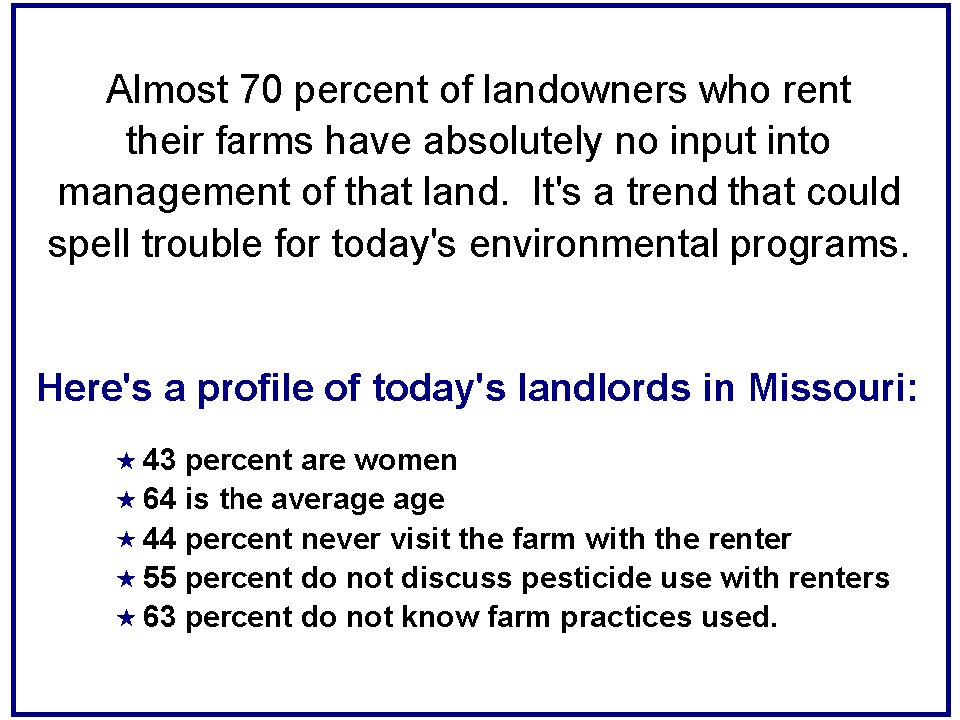
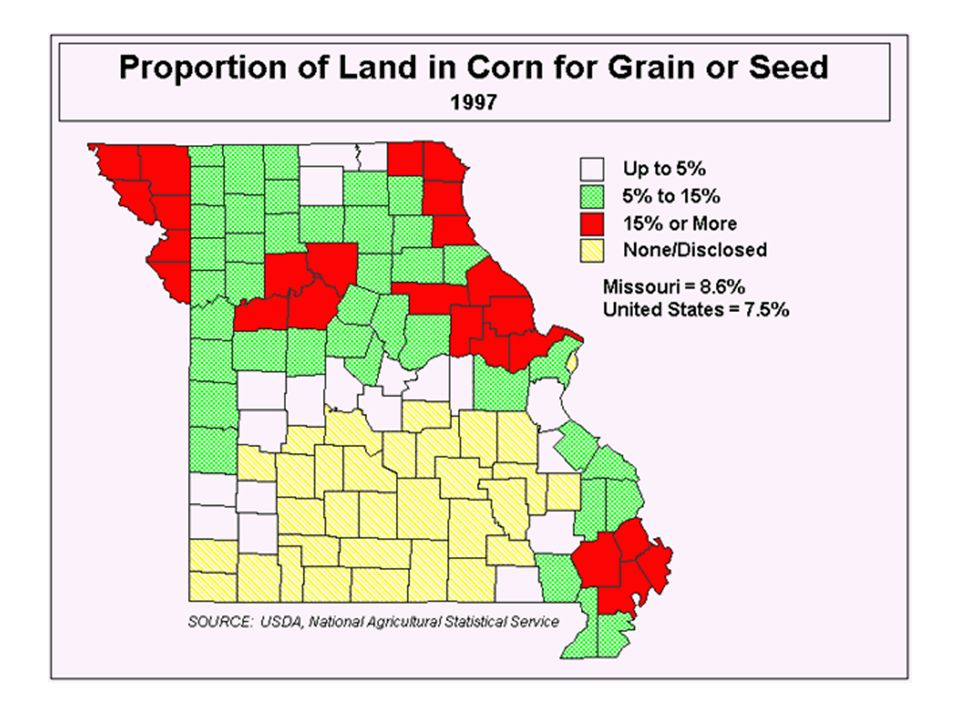
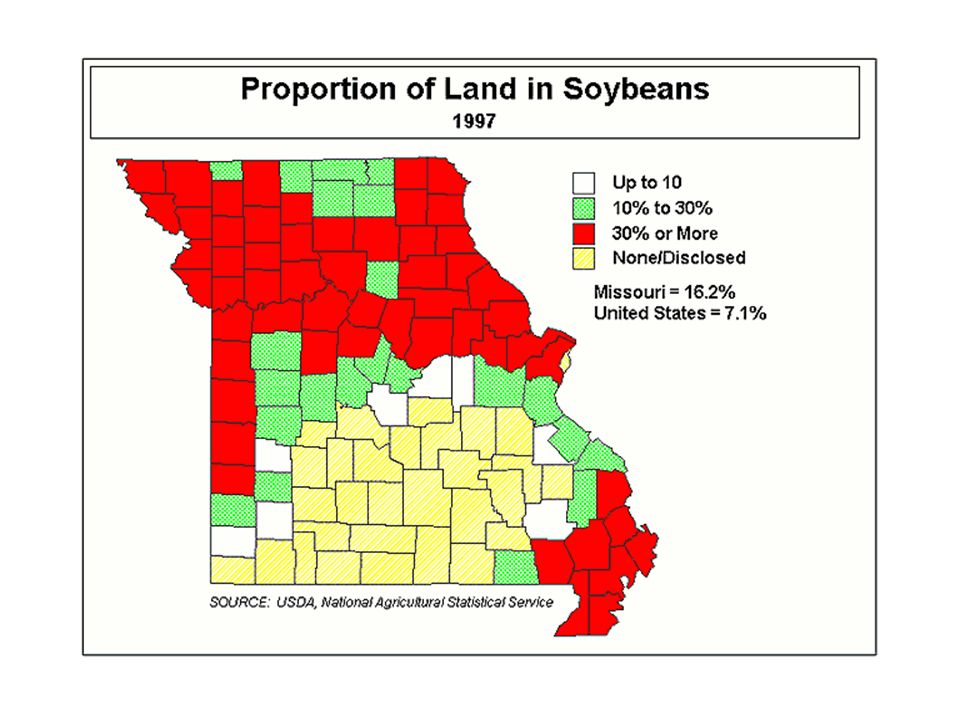
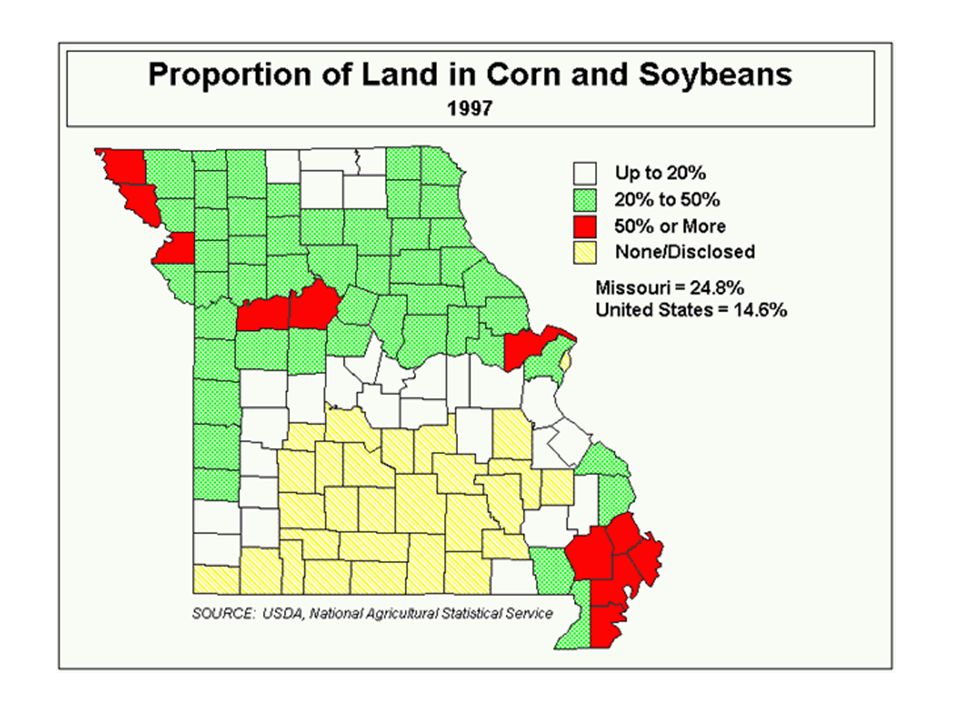
Agriculture and Land Use

Similar presentations


 University of Missouri.>")

>")