Download presentation
Presentation is loading. Please wait.

1
April 10, 2003 Missouri League of Nursing Demographic Trends Affecting Health Care in Missouri by Dr. Daryl J. Hobbs http://oseda.missouri.edu

3
Change in Population 1980-2000 Missouri’s population increased from 4,917,000 in 1980 to 5,117,000 in 1990 – an increase of 4.1 percent. Population increased from 5,117,000 in 1990 to 5,595,000 in 2000 – an increase of 9.3 percent – more than double the increase during the 1980s. However, national population which increased by 9.8 percent during the 1980s increased by 13.1 percent in 2000. There were 29 states whose population increased by a larger percentage than Missouri during the 1990s. Therefore, even though Missouri population increased by more than twice the rate in the 1990s than during the 1980s, it dropped from being the 15 th most populated state in 1990 to 17 th in 2000.

4
Missouri’s Metro and Non-Metro Population SOURCE: USDC, Bureau of the Census, Census of Population and Housing [2000 SF1; 1990 STF1] Table produced by: University Outreach and Extension, Office of Social and Economic Data Analysis (Feb. 2002)
![Missouri’s Metro and Non-Metro Population SOURCE: USDC, Bureau of the Census, Census of Population and Housing [2000 SF1; 1990 STF1] Table produced by: University Outreach and Extension, Office of Social and Economic Data Analysis (Feb.](http://images.slideplayer.com/15/4818928/slides/slide_4.jpg "2002).")
6
Migration and Change in Population 1990-2000 Population change also occurs either because more people move into a state from other places than move away or the reverse – more people can move away than move in. During the 1980s about 65,000 more people moved away from Missouri than moved in. A significant difference occurred during the 1990s. During the decade 258,585 more people moved to Missouri to live than moved away. That was the major reason for Missouri’s much greater population growth during the 1990s. In all but 15 counties (as shown on the map) more people moved into the counties during the 1990s than moved away.
 more people moved into the counties during the 1990s than moved away..")
8
Natural Change in Population 1990-2000 Population in any state, county, or town changes because of a difference in births and deaths. If there are more deaths than births population will go down. If there are more births than deaths population will go up. That is called natural change. The table shows 219,553 more births than deaths during the 1990s. The map shows that a majority of counties in rural north Missouri and many in West Central and Southeast had more deaths than births. The map also shows the greatest natural increases occurred in suburban St. Louis and Kansas City. Significant natural increases also occurred in the Columbia and Springfield areas.

10
Open Country Population as a Percent of Total Population 2000 The map shows 36 counties in which more than 60 percent of total county population lives in the open country. That is especially significant in the Southeast Ozarks and in the Lake of the Ozarks and South Central Regions. Particularly around the Lake of the Ozarks and Springfield-Branson some of the population growth has occurred as a result of new housing developments outside of towns.

12
Change in Town and Open Country Population 1990-2000 During the 1990s the population living outside the city limits of any town (open country) increased by more than 12 percent while the population living in cities, towns and villages increased by only 8 percent. The map displaying percent change in open country population shows that in 72 counties the open country population increased by more than 10 percent during the 1990s. Population change in towns and open country for each county can be found in the County Facts section of the OSEDA website. http://oseda.missouri.edu/county_facts Open country population growth has been especially significant throughout the Ozarks and on the fringes of the larger cities.

13
Percent Change in Missouri Population by Selected Age Cohorts, 1990-2000 SOURCE: USDC, Bureau of the Census, Census of Population and Housing, Summary File 1 (2000); Summary Tape File 1 (1990) Produced by: The Office of Social and Economic Data Analysis, UOE [E.J. Cleveland, Nov. 2001]

14
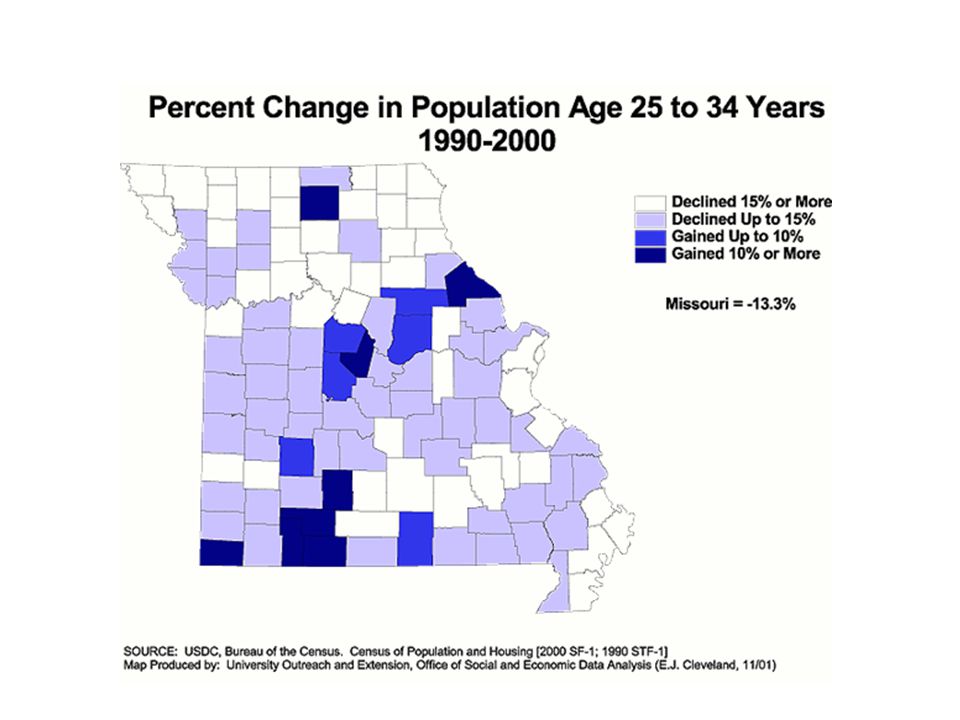
Percent Change in Population Cohorts 1990-2000 As shown on the adjoining graph by far the greatest change in the size of an age cohort was that part of the population age 35-54 at the time of the 2000 Census. That part of the population is often referred to as the “Baby Boom” generation. Because that population moved from the 25-44 age range in 1990 to 35-54 in 2000, they left behind a much smaller population. Therefore, the graph shows a 13 percent decline in the population age 25-34 by 2000. But that is only because that age group was very large in 1990 and was significantly smaller in 2000. Because the “baby boom” generation has moved beyond usual child-bearing years and left behind a much smaller cohort (18-34), the size of the 0-5 age cohort did not increase during the 1990s. The population age 65-84 increased by a very small amount during the 1990s. That is primarily because many of the people in that age cohort were born during the depression of the 1930s when birth rates were very low.
, the size of the 0-5 age cohort did not increase during the 1990s. The population age increased by a very small amount during the 1990s. That is primarily because many of the people in that age cohort were born during the depression of the 1930s when birth rates were very low..")
15
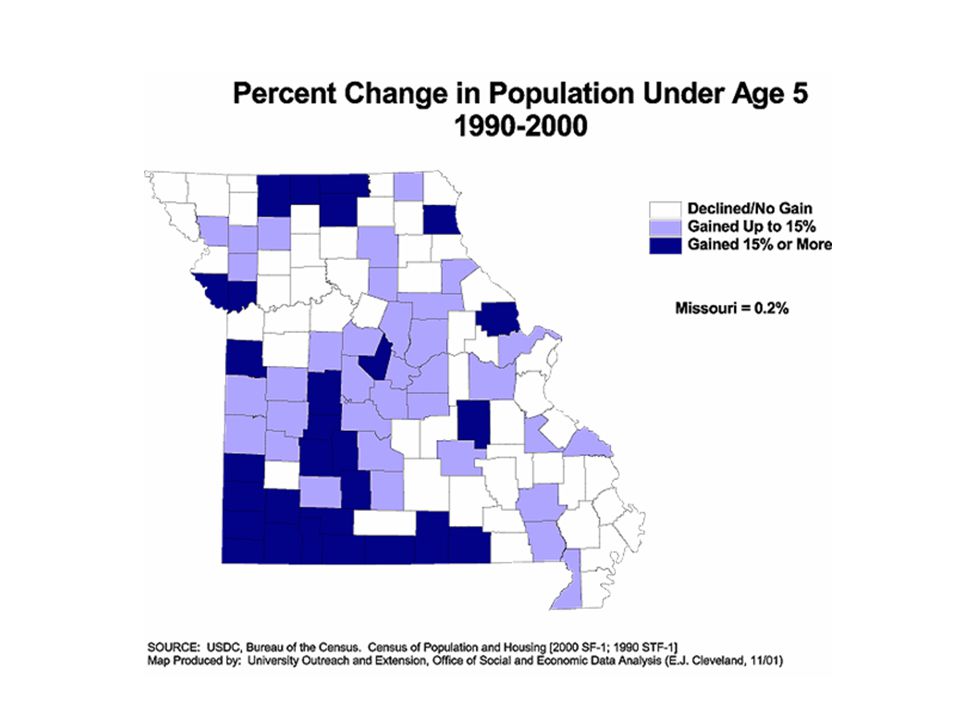
Percent Change in Population of Children 1990-2000 In nearly half of Missouri counties the number of preschool children declined from 1990 to 2000. The most significant increases in number of preschool children were in Southwest Missouri which had significant in-migration of population during the 1990s. The population age 5-17 in 2000 was, for the most part, the children of the baby boom generation. Therefore, that population cohort also increased in size during the 1990s. The greatest increases were in the Kansas City and St. Louis metropolitan areas and on a line from Columbia in Central Missouri down through the Lake of the Ozarks, Springfield and Branson.

18
Family Households with Children 2000 There were 2.2 million households in Missouri in 2000. Of those two-thirds (1.48 million) were classified as “family households”. Family households are those that are occupied by two or more persons who are related to each other. Of the family households, 699,779 had their own children under age 18 living in the household (31.9 percent of all households). There were 776,637 family households without children at home (35.4 percent of all households). Family households without children increased by 15.2 percent during the 1990s while family households with children increased by only 0.8 percent. The adjoining map shows percent of family households with children as a percent of all households. The map shows that the smallest proportion of family households with children are in rural North Missouri and the rural Southwest. The map also shows the highest proportion of family households with children to be in the Kansas City and St. Louis outlying suburban counties, as well as Central Missouri and the Springfield suburban counties.
 were classified as family households . Family households are those that are occupied by two or more persons who are related to each other. Of the family households, 699,779 had their own children under age 18 living in the household (31.9 percent of all households). There were 776,637 family households without children at home (35.4 percent of all households). Family households without children increased by 15.2 percent during the 1990s while family households with children increased by only 0.8 percent. The adjoining map shows percent of family households with children as a percent of all households. The map shows that the smallest proportion of family households with children are in rural North Missouri and the rural Southwest. The map also shows the highest proportion of family households with children to be in the Kansas City and St. Louis outlying suburban counties, as well as Central Missouri and the Springfield suburban counties..")
20
Change in Population Age 65–84 The map clearly shows the counties with the greatest increase in 65- 84 population during the 1990s to be suburban Kansas City and St. Louis, Columbia, Lake of the Ozarks and the Springfield-Branson area. This is a trend different from the previous three to four decades. It is significant that most counties in rural North, Southeast and West Central Missouri declined in population age 65-84 during the 1990s. There were 63 rural counties whose 65-84 population declined. The population of that cohort declined by 10.7 percent in the Northeast region and 8.2 percent in the Northwest region. The 65-84 population has proven to be relatively mobile, moving to locations providing services and other social, economic and environmental amenities. Their movements have a significant effect on local economies and service providers.

23
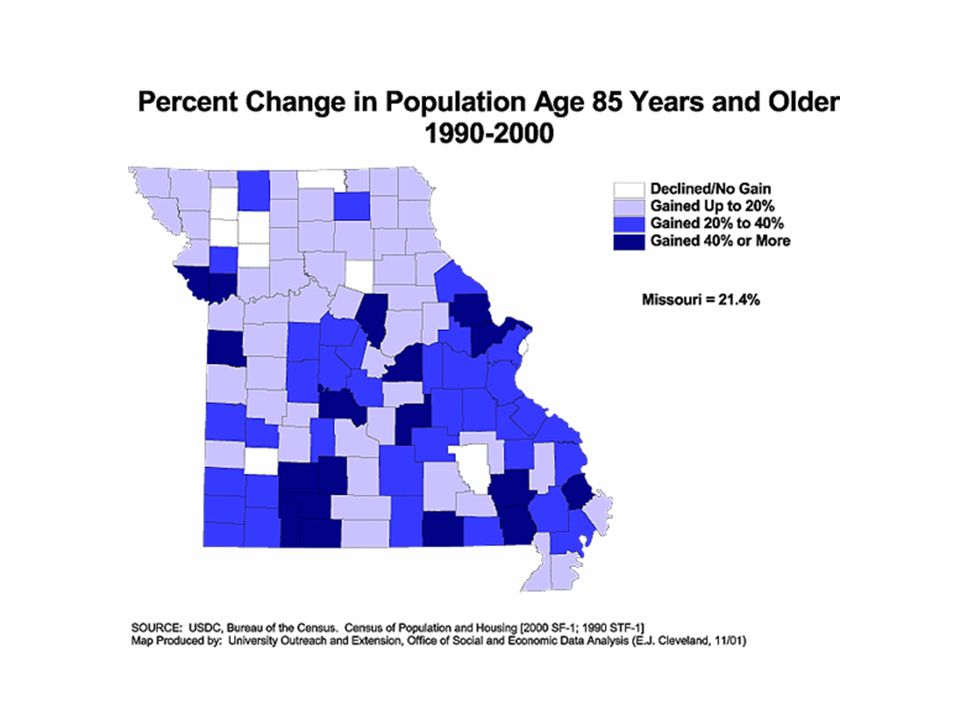
Change in Population 85 and Older 1990-2000 The population 85 and over has been one of the fastest growing cohorts of the population for the past three to four decades. People are living longer. In Missouri the 85 and over population increased by 21.4 percent during the 1990s. Only eight counties and the City of St. Louis experienced a decline during the 1990s. The greatest increases occurred in the St. Louis, Kansas City, Columbia, Springfield-Branson, and Lake of the Ozarks areas. Significant increases are also associated with counties having major health care services.

24
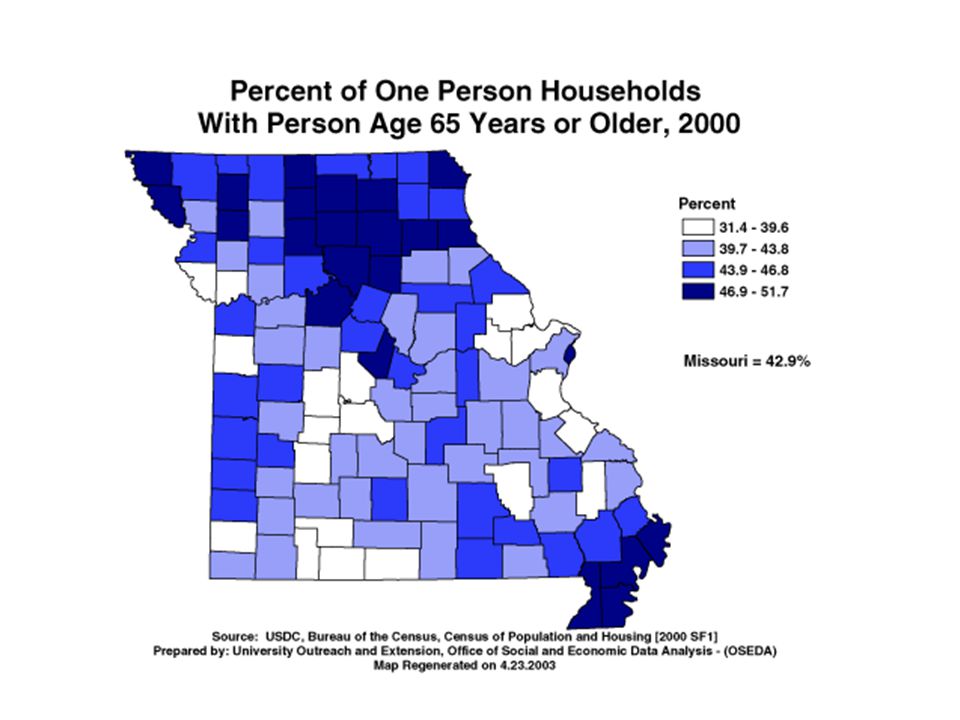
Households In Which Householder is Age 65 and Older The extent to which households are occupied by seniors is reflected in the adjoining map. There are 40 counties, all rural, in which more than 30 percent of households are headed by a person age 65 or older. The smallest percent of households headed by a senior is found in suburban counties of Kansas City, St. Louis and Springfield. There is another cluster in Central Missouri including Columbia, Jefferson City and Fulton. The next map shows that a high percent of senior households are occupied by one person age 65 or older. The highest percentage (44 percent or more) of senior households is found throughout rural north Missouri. Other clusters are found in the Southeast region, especially the Bootheel, and along the Kansas border in the West Central region.
 of senior households is found throughout rural north Missouri. Other clusters are found in the Southeast region, especially the Bootheel, and along the Kansas border in the West Central region..")
27
Households in Which Householder is Age 75 and Older As shown on the adjoining map, households in which the householder is age 75 or over account for between 10 and 18 percent of households in most counties. There is, however, a concentration of counties in the rural north region in which more than 18 percent of householders are 75 or over. The next adjoining map shows that for Missouri as a whole 51 percent of households in which the householder is 75 of older, the householder is the only occupant. The highest concentration of single occupant households is found across the rural north region. Other clusters of several counties are scattered across southern Missouri.

30
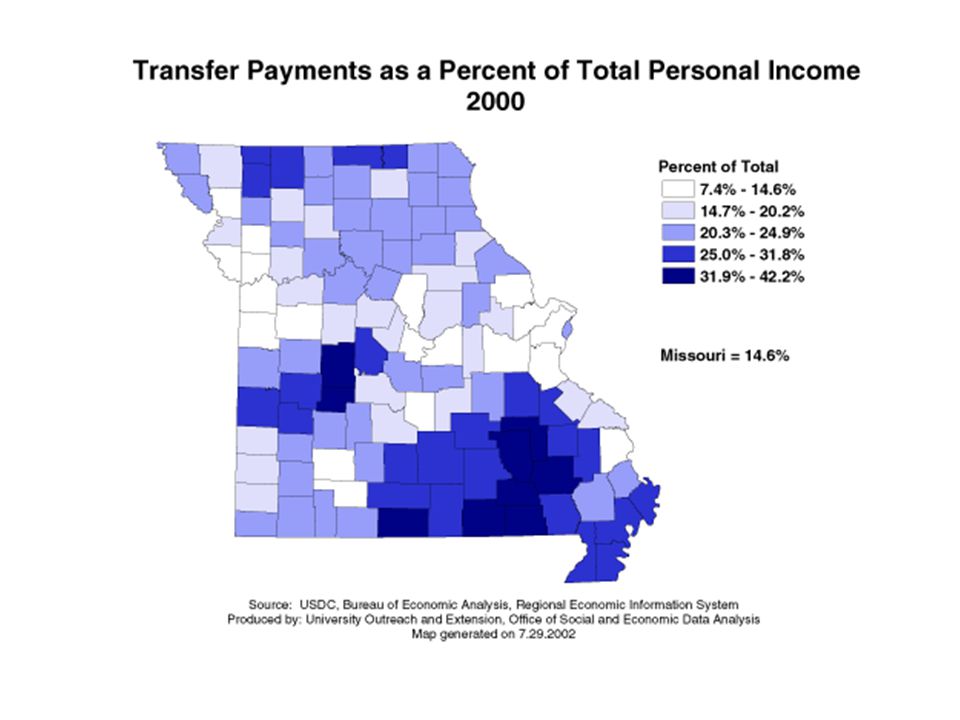
Transfer Payments as a Percent of Total Personal Income 2000 Transfer payments have become an important part of income, especially in many rural counties. Transfer payments are a part of personal income for those persons who are entitled to them. In fact, those payments are often referred to as entitlements. They include such well known programs as Social Security, Medicare, Medicaid, unemployment compensation, etc. The types of payments are shown on the following graph which indicates that 41 percent of total transfer payments are Social Security, 21 percent are Medicare and 19 percent Medicaid. Together, Social Security and Medical payments account for more than 80 percent of total transfer payments. The map shows there are 75 counties in which transfer payments account for more than 20 percent of total county personal income. In 16 of those counties transfer payments account for more than 30 percent of total personal income. It is generally in smaller rural counties in which transfer payments account for more than 20 percent of personal income. The greatest concentrations of those counties are in rural north and rural southeast.

32
Source: USDC, Bureau of Economic Analysis, Regional Economic Information System Prepared by: University Outreach and Extension, Office of Social and Economic Data Analysis - (OSEDA)
")
33
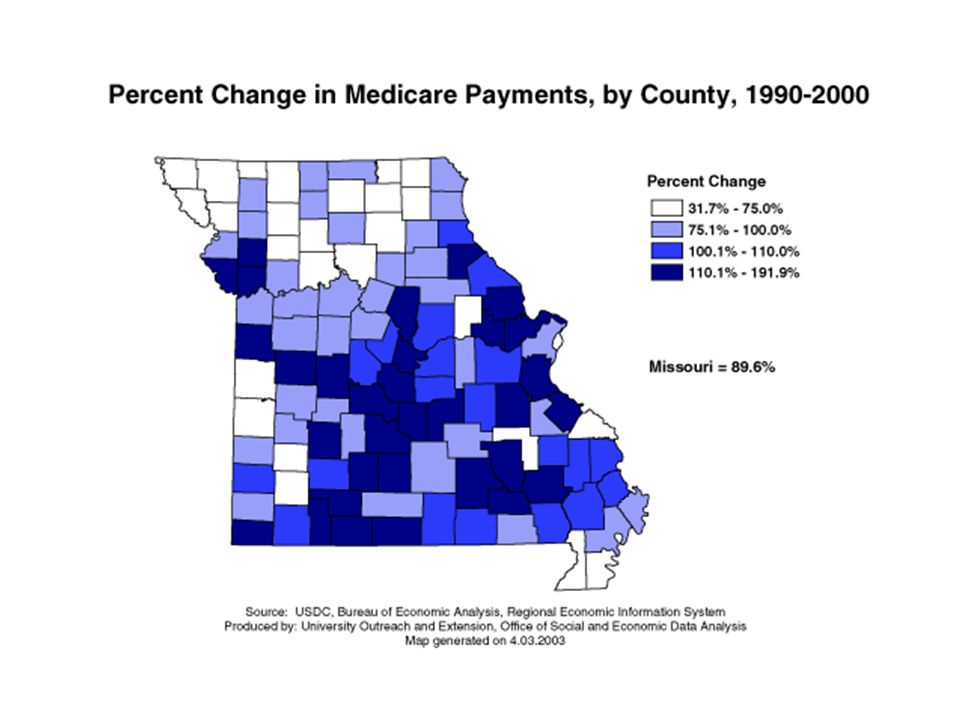
Percent Change in Medical Payments The adjoining map shows wide variation in amount of transfer medical payments from 1995-2000. The map shows that it is generally across rural north Missouri where transfer medical payments increased least, and in rural southern Missouri where the payments increased most. A major factor contributing to the smaller rate of increase in the amount of medical payments in rural north Missouri is the loss of entitled population. Recall that across rural north Missouri deaths significantly exceeded births. The next adjoining map displays the rate of increase specifically for Medicare payments from 1990 to 2000. The maps shows clearly that the lowest rate of increase is across rural north Missouri.

37
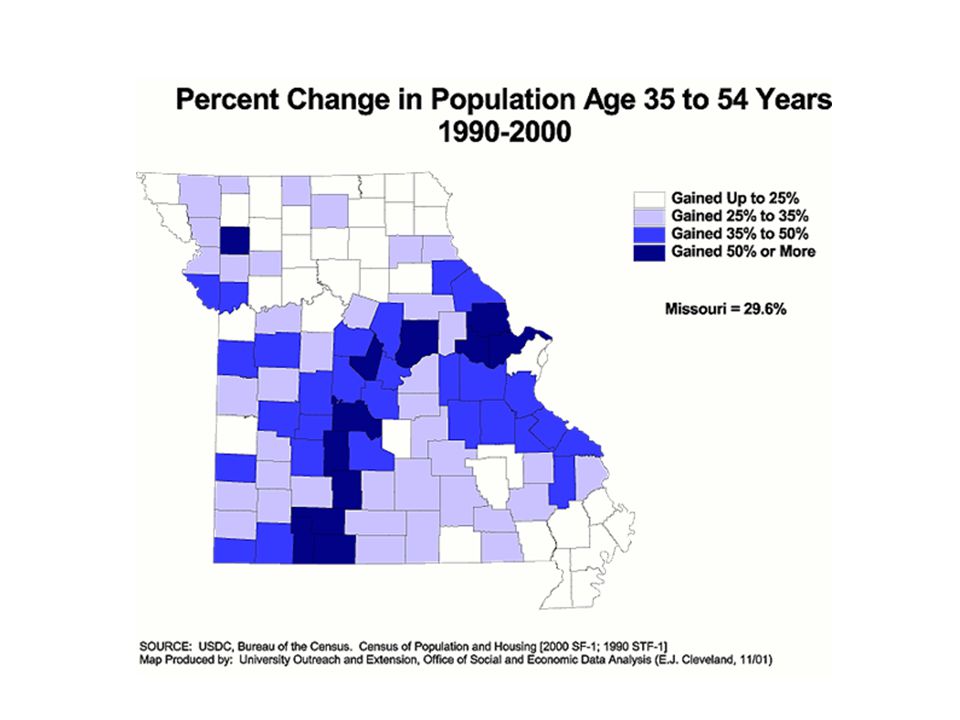
Percent Change in Population Age 25-54 The next map shows there are only 15 counties in which the 25-34 population increased during the 1990s. An adjoining map shows that all counties gained in population age 35-54 – the baby boom generation. The greatest gains (50 percent or more) occurred on a line from Columbia through the Lake of the Ozarks and on down to Branson. There were also very large increases throughout suburban St. Louis counties. Another adjoining map shows a pattern of growth of the 55-64 age cohort somewhat like the pattern for the 35-54 age cohort. A majority of the counties gaining more than 30 percent were on a line from Columbia through the Lake of the Ozarks and on to Branson. Both the Kansas City and St. Louis suburban counties also had significant increases in the 55-64 age group. There is evidence that some of the growth in the 55-64 age cohort is a consequence of migration from other states, especially the growth in the Southwest region.
 occurred on a line from Columbia through the Lake of the Ozarks and on down to Branson. There were also very large increases throughout suburban St. Louis counties. Another adjoining map shows a pattern of growth of the age cohort somewhat like the pattern for the age cohort. A majority of the counties gaining more than 30 percent were on a line from Columbia through the Lake of the Ozarks and on to Branson. Both the Kansas City and St. Louis suburban counties also had significant increases in the age group. There is evidence that some of the growth in the age cohort is a consequence of migration from other states, especially the growth in the Southwest region..")
42
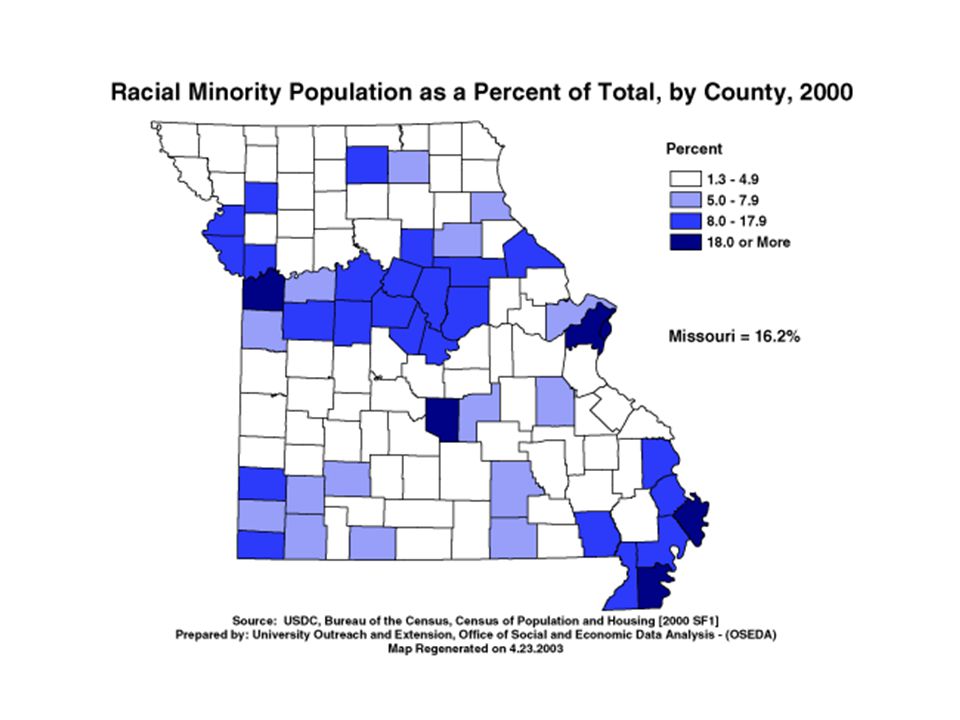
Changes in Racial Minority Populations The racial minority population of Missouri increased from 630,840 in 1990 to 847,128 in 2000 – an increase of 34.3 percent. In comparison, the Missouri population reporting themselves as white increased by 5.3 percent during the 1990s. Racial minorities accounted for 12.3 percent of Missouri’s population in 1990, but increased to 15.1 percent of the population in 2000. African Americans are the largest racial minority accounting for 11.2 percent of state total population in 2000. The African American population increased from 548,208 in 1990 to 629,391 in 2000 – an increase of 14.8 percent. Most of this increase in African American population occurred in Jackson County (Kansas City) and in St. Louis counties. The Missouri Asian population increased from 41,277 in 1990 to 64,773 in 2000 – an increase of 56.9 percent. For the first time in the 2000 Census persons were given the choice to report as multi- racial. 82,061 (1.5% of state population) reported themselves as multi-racial. The greatest concentrations of racial minorities are in St. Louis City and County and Jackson County (Kansas City) and along I-70 connecting the cities.
 and in St. Louis counties. The Missouri Asian population increased from 41,277 in 1990 to 64,773 in 2000 – an increase of 56.9 percent. For the first time in the 2000 Census persons were given the choice to report as multi- racial. 82,061 (1.5% of state population) reported themselves as multi-racial. The greatest concentrations of racial minorities are in St. Louis City and County and Jackson County (Kansas City) and along I-70 connecting the cities..")
43
Missouri’s Hispanic Population, 2000 Missouri’s Hispanic population doubled between 1990 and 2000 from 61,702 in 1990 to 118,592 in 2000 Where do Missouri Hispanics live? There are Hispanics living in all 115 Missouri counties The Hispanic population increased in 113 of 115 Missouri counties. 90,000 of Missouri’s 118,000 Hispanic population lives in a metropolitan county. The largest Hispanic community is in Kansas City – 35,160 in 2000 In 2000 the Hispanic population was: Greater than 50 in 104 of Missouri’s 115 counties Greater than 100 in 80 of Missouri’s 115 counties

44
Missouri Hispanic Population, 1990-2000 NOTE: * Newton is a metropolitan county but is included in the Top 8 agriculture producing counties ** The eight Missouri counties having the greatest agricultural commodity sales also had the greatest non-metro Hispanic population increases during the 1990s Source: USDC, Bureau of the Census, "Census of Population and Housing"

47
Hispanic Population Younger than Majority Missourians The adjoining chart shows that more than a third of Hispanics (Latinos) in 2000 were less than 18; more than half were less than 24. The adjoining map shows that more than 40 percent of the Latino population in more than half of Missouri counties is under age 18. Most of the Latinos who have come to Missouri in recent years have come to work in jobs where there was high demand. A majority were young adults. Until the last decade or two there were relatively few Latino communities in Missouri. Therefore, it is to be expected that there would be a proportionately small older Latino population. The graph shows that fewer than 10 percent of the Latino population in 2000 was age 55 and over

48
Missouri's Hispanic Population by Age Cohorts 1990-2000 SOURCE: USDC, Bureau of the Census, Census of Population and Housing [2000 SF1; 1990 STF1] Prepared by: University Outreach and Extension, Office of Social and Economic Data Analysis – (OSEDA) Chart Generated on 3.5.2002
![Missouri s Hispanic Population by Age Cohorts SOURCE: USDC, Bureau of the Census, Census of Population and Housing [2000 SF1; 1990 STF1] Prepared by: University Outreach and Extension, Office of Social and Economic Data Analysis – (OSEDA) Chart Generated on](http://images.slideplayer.com/15/4818928/slides/slide_48.jpg "Missouri s Hispanic Population by Age Cohorts SOURCE: USDC, Bureau of the Census, Census of Population and Housing [2000 SF1; 1990 STF1] Prepared by: University Outreach and Extension, Office of Social and Economic Data Analysis – (OSEDA) Chart Generated on")
50
Significant Increase in Hispanic School Enrollment The adjoining chart shows that enrollment of Hispanic children in Missouri schools increased from 6,000 in 1990 to more than 16,000 in 2000. That is much greater than the total 11 percent increase in Missouri schools during the 1990s. That occurred both because there was significant movement of Hispanic people to Missouri during the 1990s, and because a large proportion of the Hispanic population is in childbearing years. The second adjoining chart is an example of the dramatic increase in Hispanic school enrollment in one of several counties where a large increase in Hispanic population occurred in a short time. The example is McDonald County which increased from fewer than 50 in 1994 to more than 400 in 2000.

51
Missouri’s Hispanic School Enrollment by School Year SOURCE: Missouri Department of Elementary and Secondary Education, Core Data Prepared by: University Outreach and Extension, Office of Social and Economic Data Analysis – (OSEDA) Chart Generated on 3.5.2002
 Chart Generated on")
52
Hispanic School Enrollment in McDonald County by School Year SOURCE: Missouri Department of Elementary and Secondary Education, Core Data Prepared by: University Outreach and Extension, Office of Social and Economic Data Analysis – (OSEDA) Chart Generated on 3.5.2002
 Chart Generated on")
54
Percent of Missouri Children and Youth Below the Federal Poverty Guideline The adjoining map shows that 15 percent of Missouri children under 18 were living in households whose income was below the federal poverty line in 2000. That is a decline from 1990 when 17.7 percent of children were below the poverty line. The number dropped from 230,000 in 1990 to 212,000 in 2000 – a decline of 7.7 percent Counties range from as low as 4.9 percent of children below the poverty line in 2000 to as high as 43.2 percent. There were 24 counties in which more than 25 percent of children were living below the poverty line. Most of those counties are in the Southeast Region including the Bootheel. At the other extreme there were 13 counties in which fewer than 10 percent of children were below the poverty line.

55
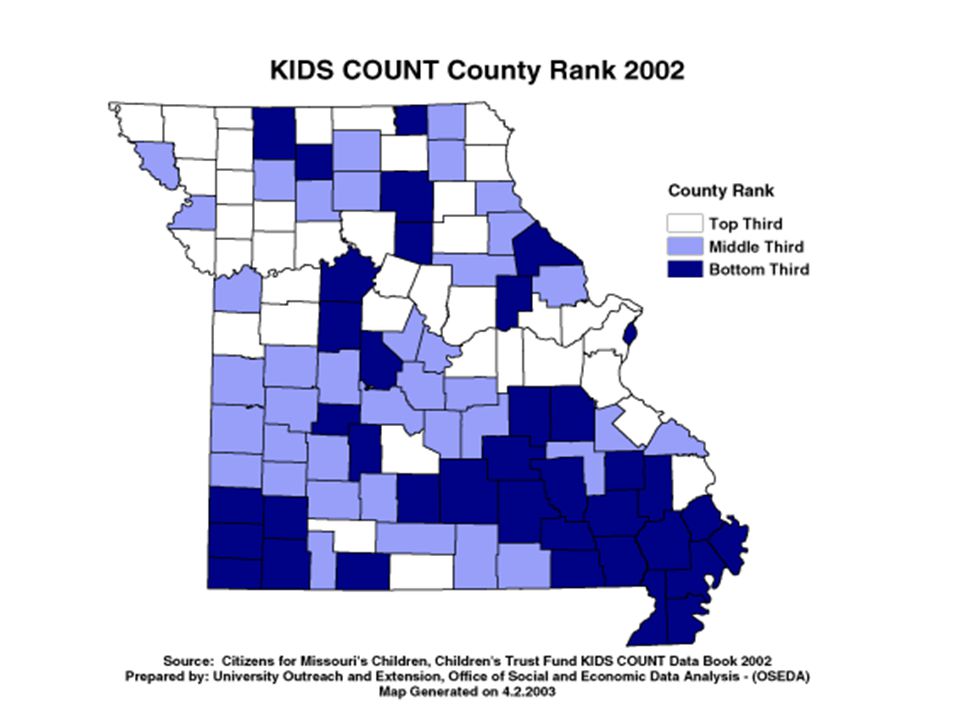
Kids Count 2002 Kids Count is an annual assessment of the relative well-being of children and youth in each of Missouri’s counties. It is a project sponsored by Citizens for Missouri’s Children and the Children’s Trust Fund. An annual report has been issued since 1993. The reports for each year including each individual county can be found on the OSEDA website. For the first time the 2002 the report is available on an interactive website which enables users to customize tables, graphs and download data. The adjoining chart shows the 10 outcome measures that are the basis for county ranking and assessment for 2002. Basically the same set of outcome measures has been used since 1995. As shown on the chart there is a base year (1997) and it is determined what change occurred on each of these measures between the base year and 2001. Seven of the outcome measures – those that are the most stable – are combined to produce a county rank within the state. Counties are ranked from “best” – rank #1 to “worst” – rank #115
 and it is determined what change occurred on each of these measures between the base year and Seven of the outcome measures – those that are the most stable – are combined to produce a county rank within the state. Counties are ranked from best – rank #1 to worst – rank #115.")
56
Students enrolled in free/reduced lunch 1997/2001 Births to mothers without h.s. diploma 1997/2001 Low birthweight infants 1992-96/1997-2001 Infant mortality (per 1,000 live births) 1992-96/1997-2001 Child deaths, ages 1-14 (per 100,000) 1992-96/1997-2001 Child abuse and neglect (per 1,000) 1997/2001 Out-of-home placement entries (per 1,000) 1997/2001 Annual high school dropouts 1997/2001 Births to teens, ages 15-19 (per 1,000) 1997/2001 Violent deaths, ages 15-19 (per 100,000) 1992-96/1997-2001 Source: Citizens for Missouri’s Children, Children’s Trust Fund, KIDS COUNT Data Book 2002 KIDS COUNT Outcome Measures
 / Child deaths, ages 1-14 (per 100,000) / Child abuse and neglect (per 1,000) 1997/2001 Out-of-home placement entries (per 1,000) 1997/2001 Annual high school dropouts 1997/2001 Births to teens, ages (per 1,000) 1997/2001 Violent deaths, ages (per 100,000) / Source: Citizens for Missouri’s Children, Children’s Trust Fund, KIDS COUNT Data Book 2002 KIDS COUNT Outcome Measures.")
57
Kids Count County Rankings The adjoining map shows those counties that ranked in the top third, those in the middle third and those in the bottom third. Although high ranking and low ranking counties are scattered, the 2002 map shows that a majority of the top third include suburban counties around Kansas City and St. Louis and generally extending from mid-Missouri to the northern state line. The majority of lower ranking counties are in south Missouri extending from west to east.

60
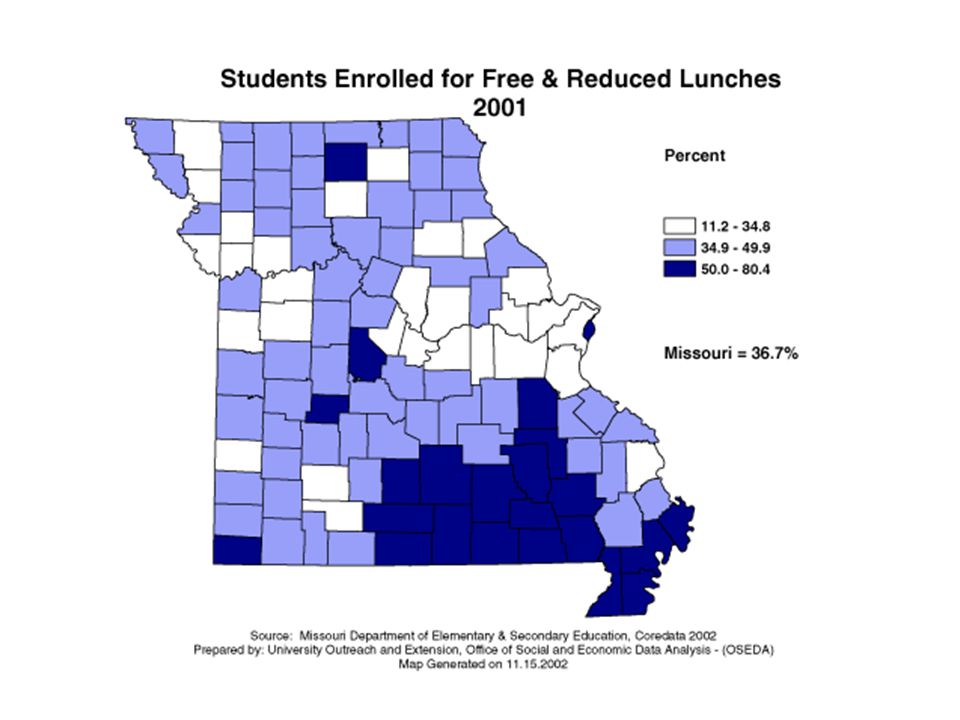
Free and Reduced Lunches by County Kids Count uses the percent of school-age children eligible for free or reduced price lunch as an annual measure of low income among children. That measure is used because national survey data are only generated every 3-4 years and the Census is only conducted once every 10 years. The adjoining map shows the greatest concentration of low-income children is found in the Southeast Region. In general, the smallest percentage is found across central Missouri from Kansas City to St. Louis. In the past two years – since 1999 – the number of children eligible for free or reduced lunch has been increasing. That is attributable to the downturn of the economy since 2000.

62
Percent of Births to Mothers with Fewer Than 12 Years of Education It has been found by the Department of Health that this factor is predictive of a higher percentage of children at risk. As may be observed from the map, counties with the highest percentage of births to less educated mothers are scattered about the state. The same is true of counties with a low percentage of births to less educated mothers. The percent of births to mothers without a high school diploma declined significantly from 1992-1995. However, after increasing modestly from 1995 to 2000 the number declined from 2000-2001

64
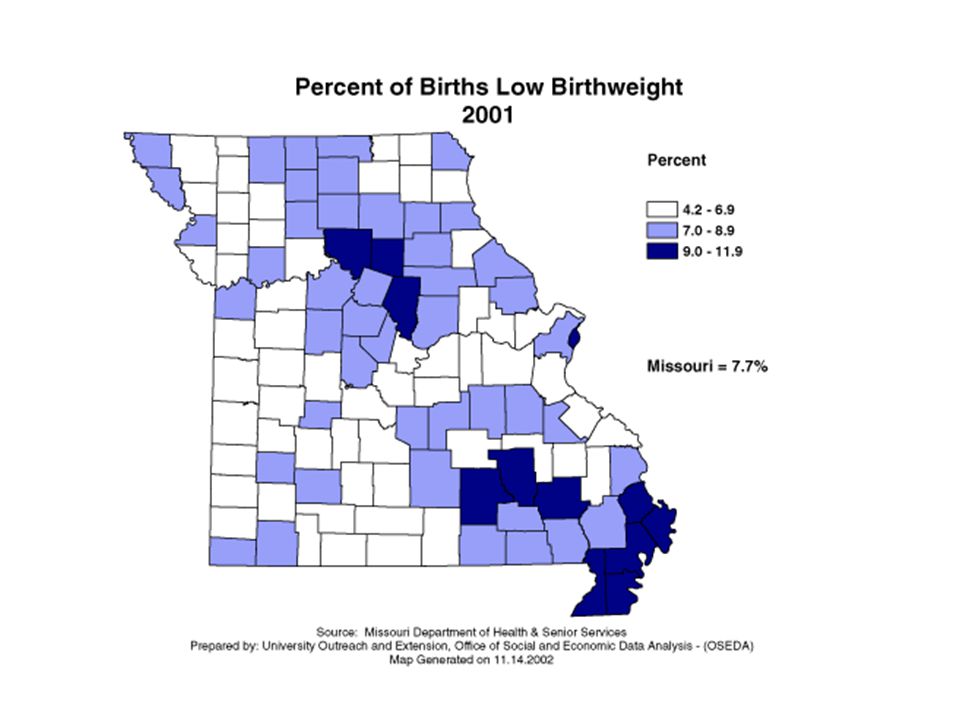
Percent of Low Birthweight Births Low birthweight infants are at greater risk. The number of low birthweight births has been increasing steadily from 1988 -1992 to 1997-2001. A five-year average is used to provide a more reliable assessment, especially for small population counties. Although the number of such births has continued to increase, the percent has remained right at 7.7 percent since the 1994-1998 period. The map shows there are 11 counties in which more than 9 percent of births were low birthweight. The map also shows a rate of less than 7 percent in a majority of counties.

66
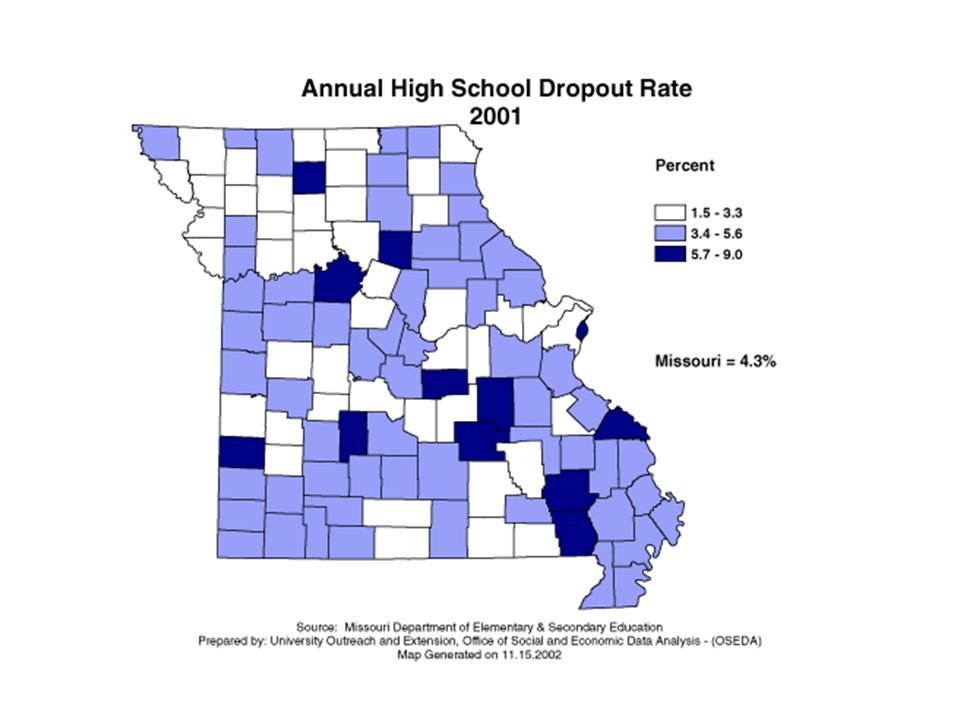
Annual High School Dropout Rate The annual high school dropout rate has been declining since 1993-94 when it reached 7.1 percent. By 2000-2001 the rate had declined to 4.3 percent, and high school completion in Missouri increased to 83.2 percent. The map shows 12 counties in which the dropout ranged between 5.7 and 9.0 percent. The map also shows that a majority of counties in the Northwest region had low dropout rates. Those low dropout rate counties include such more populated places such as Platte, Buchanan (St. Joe), Nodaway and Livingston counties. It is significant also that there are very low dropout rates in six small population rural counties surrounding West Plains in the South Central Region.
, Nodaway and Livingston counties. It is significant also that there are very low dropout rates in six small population rural counties surrounding West Plains in the South Central Region..")
68
Births to Teens 15-19 per 1,000 Females The percent of births to teens has been declining slowly but steadily from 1994 to 2001. Currently there are 46 births per 1,000 females age 15-19. That is down from 63 in 1992. The map shows counties having more than 60 births per 1,000 teenagers are scattered throughout the state, although there is a concentration in the Southeast Region. The Central and the Northeast Regions have clusters of seven to eight counties having low teenage birth rates.

70
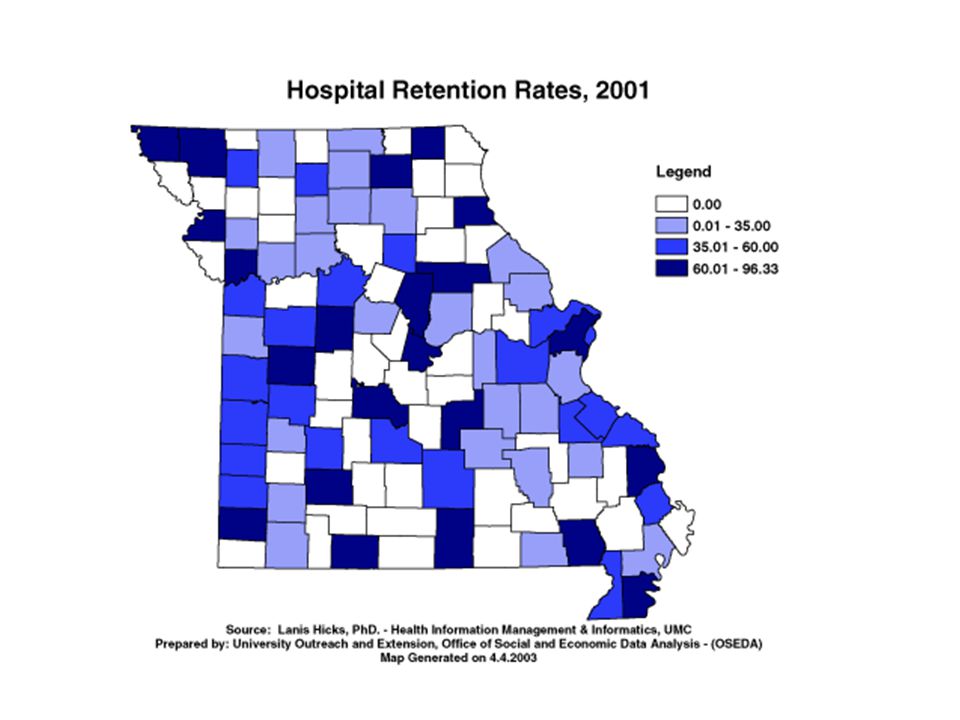
Hospital Retention Rates The Hospital Retention Rate is a measure of the extent to which residents of counties who are hospitalized in a year are admitted to their county hospital, if the county has a hospital. The adjoining map indicates those 44 counties, which do not have a hospital (shown in white on the map). The shading in the remaining 71 counties shows the extent to which hospitalized county residents were admitted to a hospital in their home county. Those 22 counties, which are shaded in the darkest blue, are the counties having the highest hospital retention rates – more than 60 percent of hospitalized residents were admitted in their home county. This category included larger population counties in places such as St. Louis County, Columbia, Jefferson City, Springfield, Kirksville, Hannibal, St. Joseph, Joplin, West Plains, etc. However, some small population county hospitals such as Atchison and Scotland also had high retention rates The next highest category shown is those counties in which the retention rate was between 35 and 60 percent. There are 21 counties included in this category. Included among those counties are Jackson (Kansas City), St. Louis City, St. Charles and Franklin. The lowest retention rate is counties that retained fewer than 35 percent of hospitalized residents. There were 28 counties in that category.
. The shading in the remaining 71 counties shows the extent to which hospitalized county residents were admitted to a hospital in their home county. Those 22 counties, which are shaded in the darkest blue, are the counties having the highest hospital retention rates – more than 60 percent of hospitalized residents were admitted in their home county. This category included larger population counties in places such as St. Louis County, Columbia, Jefferson City, Springfield, Kirksville, Hannibal, St. Joseph, Joplin, West Plains, etc. However, some small population county hospitals such as Atchison and Scotland also had high retention rates The next highest category shown is those counties in which the retention rate was between 35 and 60 percent. There are 21 counties included in this category. Included among those counties are Jackson (Kansas City), St. Louis City, St. Charles and Franklin. The lowest retention rate is counties that retained fewer than 35 percent of hospitalized residents. There were 28 counties in that category..")
72
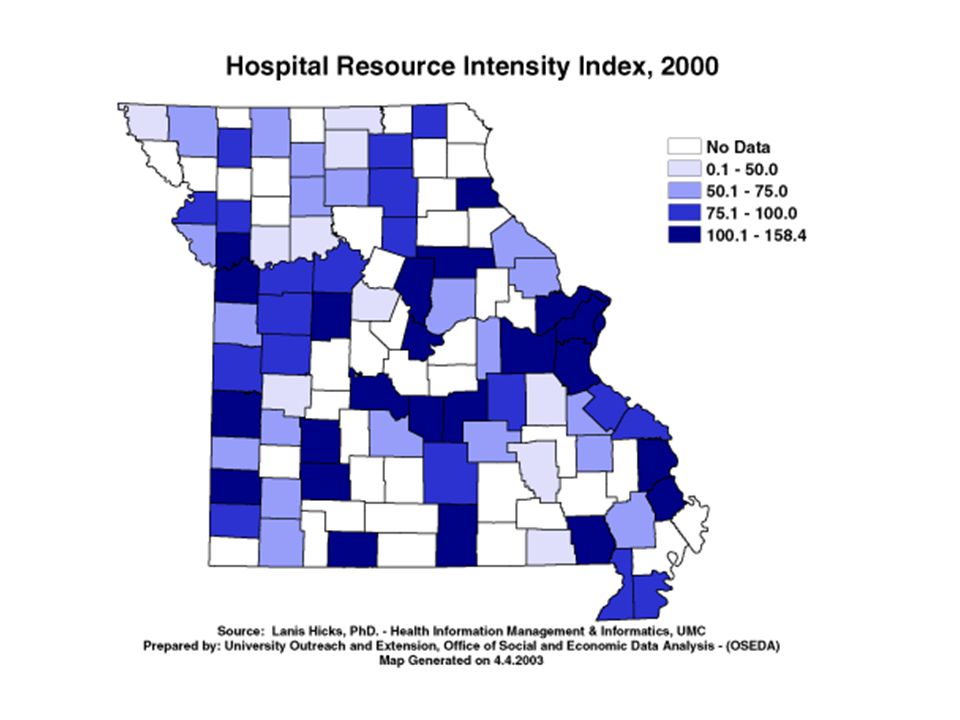
Hospital Resource Intensity Index 2000 Dr. Lanis Hicks of the UMC Department of Health Information Management and Informatics has constructed an index showing the extent of services offered by hospitals. She has been publishing this index for the last decade or more. The intensity index is displayed for each county having one or more hospitals on the adjoining map. The higher the index number the greater the extent of health care services offered, including the level of technical and diagnostic capabilities. The index numbers range from as low as 17.3 to a high of 158.4. The 24 counties having an index of greater than 100 are generally regional, tertiary care centers. Included in that range are not only counties like Jackson (Kansas City), St. Louis City, St Louis, Greene (Springfield), Boone (Columbia), but also regional health care centers such as Poplar Bluff, Cape Girardeau, Jefferson City, West Plains, Joplin, Hannibal, Kirksville, Sedalia, Mexico, Nevada, etc.
, St. Louis City, St Louis, Greene (Springfield), Boone (Columbia), but also regional health care centers such as Poplar Bluff, Cape Girardeau, Jefferson City, West Plains, Joplin, Hannibal, Kirksville, Sedalia, Mexico, Nevada, etc..")
74
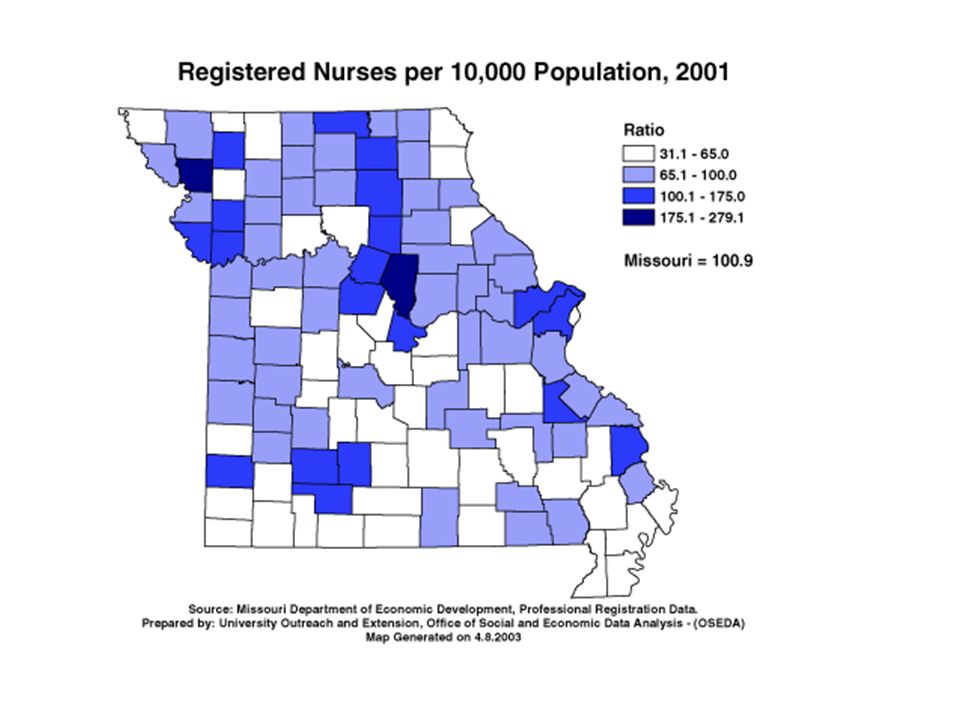
Registered Nurses per 10,000 Population In 2001 there were 56,789 registered nurses in Missouri – a ratio of 100.9 registered nurses per 10,000 population. The counties with the greatest number of nurses were St. Louis (14,242), Jackson (5,940), St. Charles (4,323), Greene (2,816) and Boone (2,409). More than 52 percent of Missouri registered nurses reside in those five metropolitan counties. The adjoining map shows there were 21 counties in which there were more than 100 nurses per 10,000 population. The map shows a higher density of registered nurses in the Kansas City and St. Louis metro areas and in the vicinity of Columbia, Springfield, Joplin and Kirksville. The map also shows there were 44 counties in which there were fewer than 65 nurses per 10,000 population. Those counties are concentrated in southern Missouri. Thirty-five of the 44 low-density counties are located south of the Missouri River.
, Jackson (5,940), St. Charles (4,323), Greene (2,816) and Boone (2,409). More than 52 percent of Missouri registered nurses reside in those five metropolitan counties. The adjoining map shows there were 21 counties in which there were more than 100 nurses per 10,000 population. The map shows a higher density of registered nurses in the Kansas City and St. Louis metro areas and in the vicinity of Columbia, Springfield, Joplin and Kirksville. The map also shows there were 44 counties in which there were fewer than 65 nurses per 10,000 population. Those counties are concentrated in southern Missouri. Thirty-five of the 44 low-density counties are located south of the Missouri River..")
76
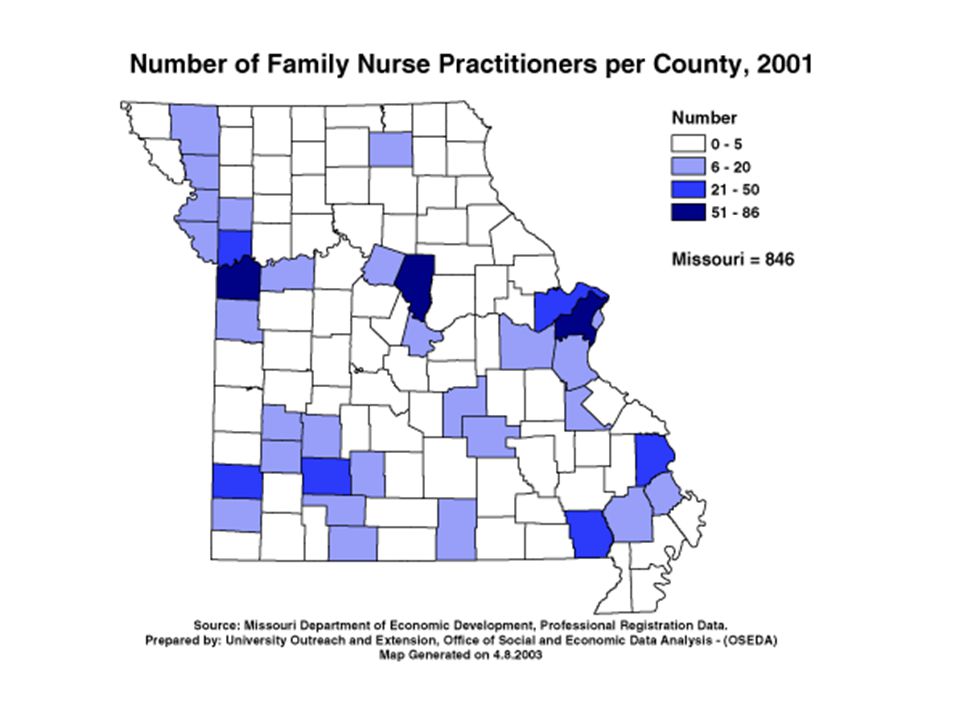
Number of Family Nurse Practitioners Per County Professional registration data indicate 846 Family Nurse Practitioners in 2001. The data report at least one nurse practitioner in 103 of the 115 counties. However, there were either one or two nurse practitioners in 42 of those counties. There were an additional 38 counties in which there were three, four or five. Most of the 35 counties in which there were more than six family nurse practitioners are located in the larger population areas or in regional health care centers such as Maryville, Cape Girardeau, Rolla, Poplar Bluff, West Plains, etc. The largest concentrations were in Boone, St. Louis, and Jackson counties with 86, 81 and 62 family nurse practitioners respectively.

78
Number of Physician Assistants Per County Professional Registration data report 248 Physician Assistants in Missouri in 2001. Physician Assistants were located in 43 of the 115 counties, but they were greatly concentrated in a few counties. Two-thirds of the physician assistants were located in five counties with the largest numbers in St. Louis (63), St. Louis City (45), Greene (25), Jackson (18) and Boone (14). The 31 counties in which there were one, two or three physician assistants were disproportionately concentrated in the Southwest Region.
, St. Louis City (45), Greene (25), Jackson (18) and Boone (14). The 31 counties in which there were one, two or three physician assistants were disproportionately concentrated in the Southwest Region..")
80
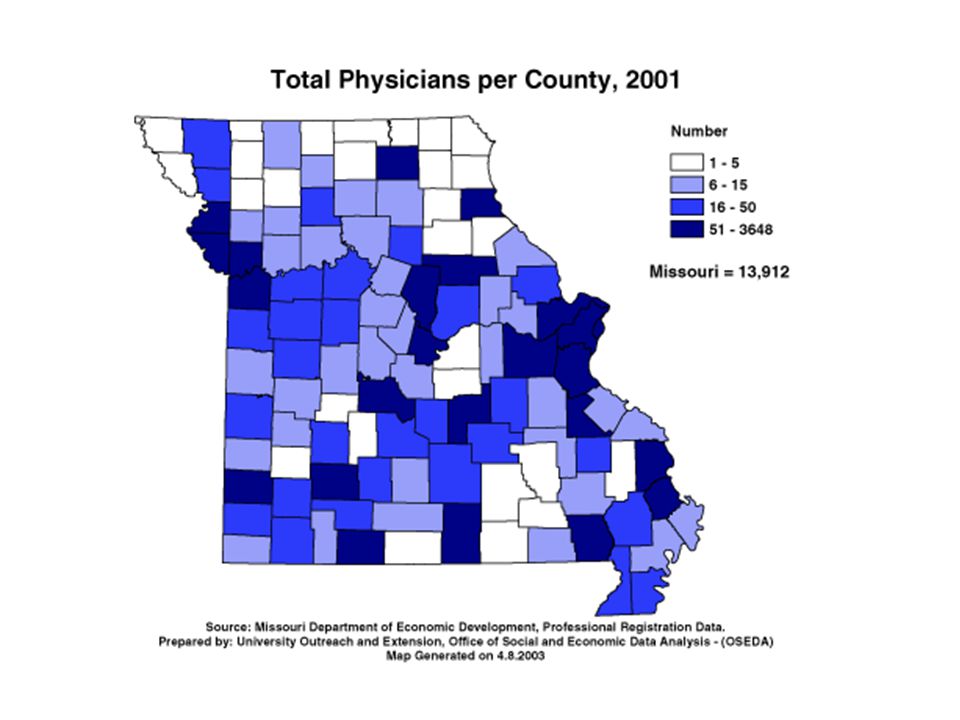
Total Physicians Per County There were 13,912 licensed physicians in Missouri in 2001. That category includes both Medical (12,259) and Osteopathic (1,653) doctors. The adjoining map shows that the number of physicians per county ranged from a low of one to a high of 3,648 (St. Louis County). The map shows there were 51 or more physicians in 24 counties. The counties with the greatest numbers are, in addition to St. Louis, St. Louis City (2,260), Jackson (2,200), Greene (851) and Boone (850). From those counties there is a relatively significant drop to Clay (423), St. Charles (366), Jasper (344) and Cape Girardeau (261). When combined there are 7,555 physicians in those eight counties – 54 percent of all physicians in Missouri. At the other extreme there were three counties with only one physician, and 25 counties with from two to five physicians. Seventeen of those counties are in rural north Missouri.
 and Osteopathic (1,653) doctors. The adjoining map shows that the number of physicians per county ranged from a low of one to a high of 3,648 (St. Louis County). The map shows there were 51 or more physicians in 24 counties. The counties with the greatest numbers are, in addition to St. Louis, St. Louis City (2,260), Jackson (2,200), Greene (851) and Boone (850). From those counties there is a relatively significant drop to Clay (423), St. Charles (366), Jasper (344) and Cape Girardeau (261). When combined there are 7,555 physicians in those eight counties – 54 percent of all physicians in Missouri. At the other extreme there were three counties with only one physician, and 25 counties with from two to five physicians. Seventeen of those counties are in rural north Missouri..")
82
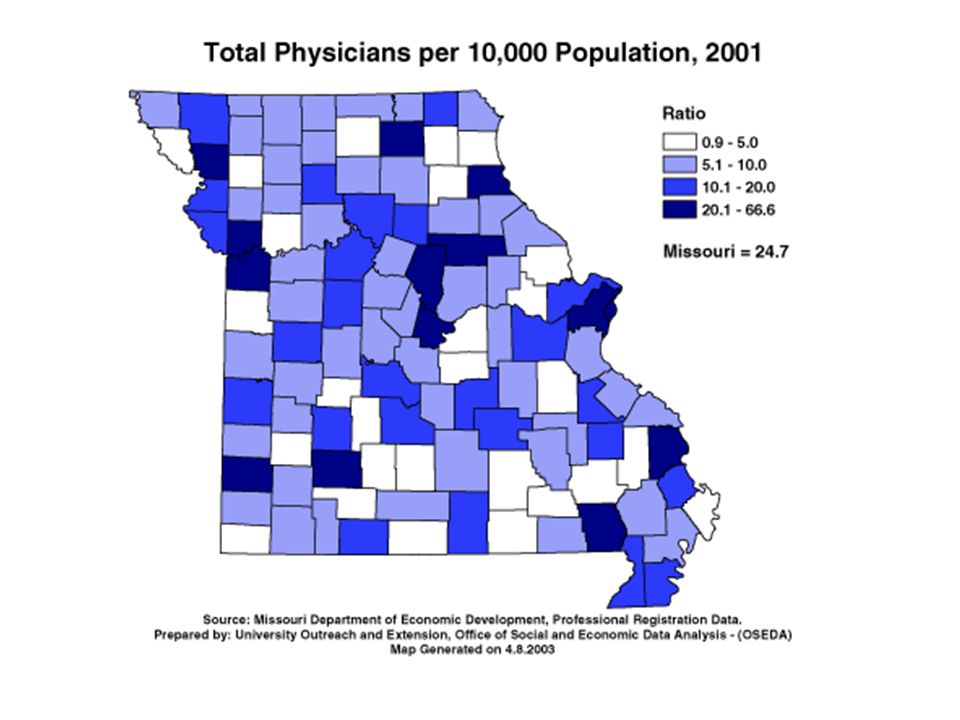
Physicians per 10,000 Population Another way of assessing the geographic distribution of physicians is to calculate a ratio for each county. That is calculated by dividing county population by 10,000. That number is then used to divide into the number of physicians in the county. The result is a ratio showing the number of physicians per 10,000 population. For example, in Boone County the population is 135,000 and there are 850 physicians. Doing that calculation shows 62.1 physicians per 10,000 population in Boone County. Calculating that ratio for each county provides a comparison of counties having the highest and lowest access to physicians. The adjoining map shows that there are 24.7 licensed physicians per 10,000 population in Missouri. The highest ratios are in St. Louis City (66.6), Boone County (62.1) and Adair County (50.4). There are 14 counties in which the ratio is above the state average. On the other hand, there are 25 counties in which there is a ratio of less than five physicians per 10,000 population. Those counties are mostly rural, but also include some suburban counties in which the population has grown rapidly but the physicians are largely concentrated in the adjoining large urban counties.
, Boone County (62.1) and Adair County (50.4). There are 14 counties in which the ratio is above the state average. On the other hand, there are 25 counties in which there is a ratio of less than five physicians per 10,000 population. Those counties are mostly rural, but also include some suburban counties in which the population has grown rapidly but the physicians are largely concentrated in the adjoining large urban counties..")
84
Dentists per 10,000 Population Professional Registration data report 2,306 licensed dentists in Missouri in 2001. All but seven counties had at least one dentist in 2001. There were 13 additional counties in which there was but one dentist. The map shows there were 4.1 dentists per 10,000 population in Missouri. Compared with other health care providers there is less concentration among dentists. For example, although there were only five counties in which there were more than 5.0 dentists per 10,000 population, there were 49 counties in which the ratio was between 2.5 and 5.0

86
Physical Therapists per 10,000 Population Registration data report 3,116 Physical Therapists in Missouri in 2001. All but 10 counties had a least one physical therapist. Physical therapists appear to be more widely distributed around the state than some other practitioners. There were 5.5 physical therapists per 10,000 population in the state, but there was no county in which there were than 11 PTs per 10,000. As the adjoining map shows, the counties having a ratio of 5.5 or greater are those that have an important concentration of health care services. They include not only Jackson, Boone, St. Louis, Kirksville and Springfield, but also regional centers such as Hannibal, Sedalia. Jefferson City, Cape Girardeau, West Plains, Poplar Bluff and Joplin.

Similar presentations


 Demographic Highlights TEXAS is: big. The population.>")


