Download presentation
Presentation is loading. Please wait.

1
Johann Mouton Centre for Research on Science and Technology, Stellenbosch University 13 February 2010

2
On size/magnitude How much (“knowledge ‘products’) do we produce AND how likely is it that we will be able either to maintain current production or even increase it? On shape What factors determine the shape, the ways in which knowledge is “distributed” in our higher education system and how likely is it that this will change over the next decade? On stratification Who (race and age) produces the bulk of our knowledge and is this likely to change significantly over the next decade?
 produces the bulk of our knowledge and is this likely to change significantly over the next decade .")
4
As far as research output in scientific journals is concerned, the HE sector is the dominant sector in the national system of innovation. In 2007, academics produced 86% of all ISI-papers with a South African address. In the same year, the sector also produced 1274 PhD’s and 7516 Masters graduates (of which 3442 were recognized by the Department of Education as “research Masters students). The higher education sector remains the sanctuary of basic research with 42% of all research in the sector classified as such in 2005/6 (the comparable proportion for research in government and science councils is slightly more than 25% with applied research and experimental development constituting the rest).
. The higher education sector remains the sanctuary of basic research with 42% of all research in the sector classified as such in 2005/6 (the comparable proportion for research in government and science councils is slightly more than 25% with applied research and experimental development constituting the rest)..")
6
R22k

7
Production of research Masters and Doctoral graduates

9
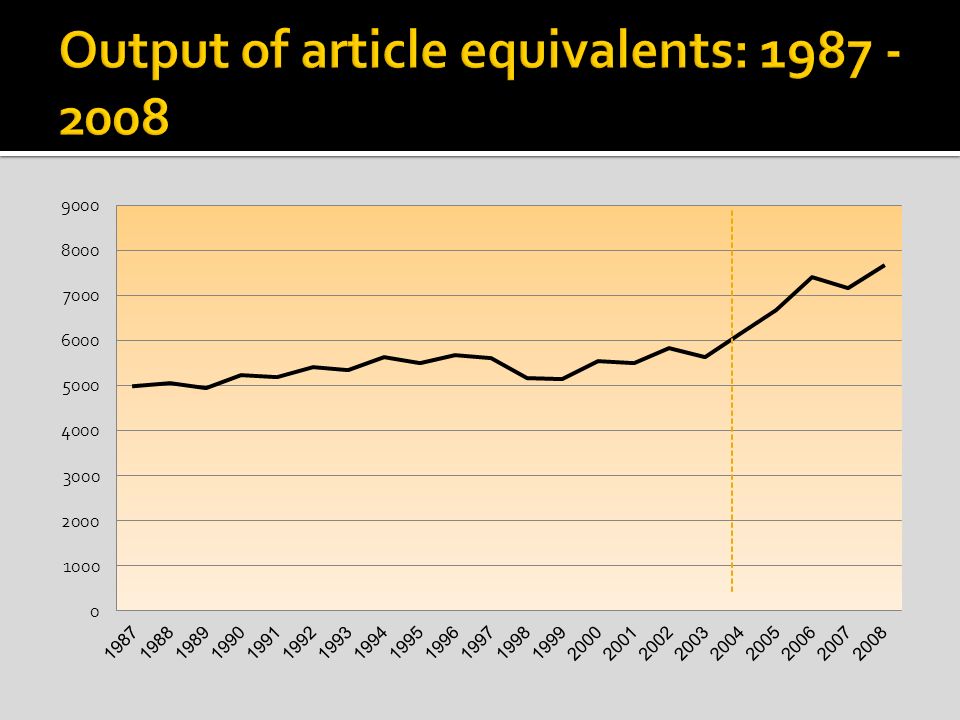
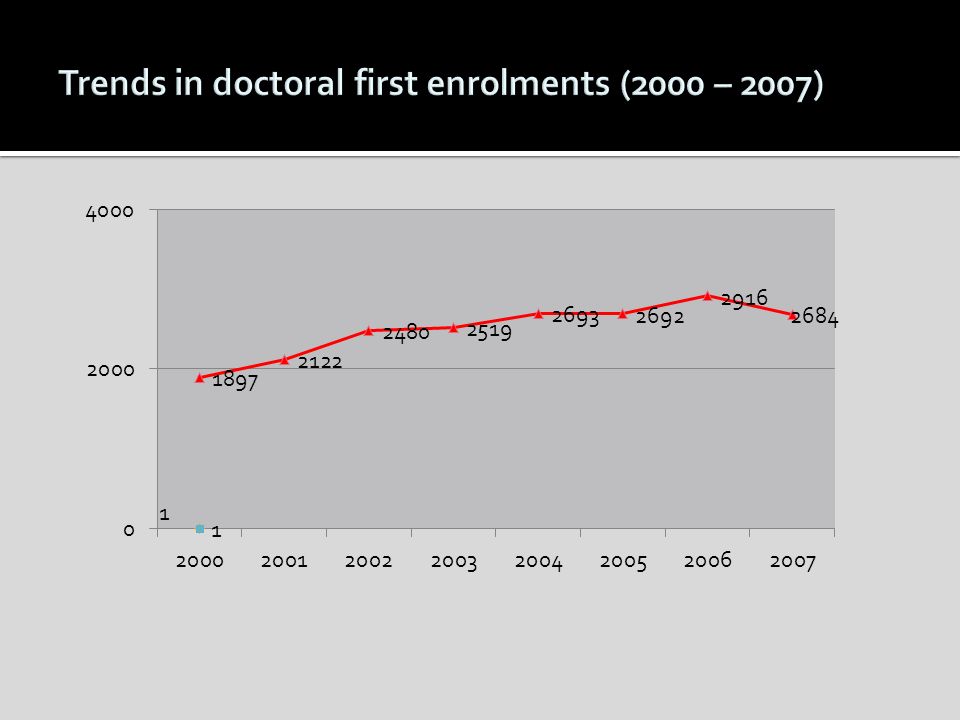
There is every indication that knowledge output (as measured in terms of article production) may have reached a plateau at around 7 500 article equivalents per year (which constitutes about 0.4% of total world science production as measured in WoS journals). Knowledge production as measured in terms of doctoral output has also flattened of and is now hovering at about 1200 PhD’s per year. Given the recent decline in first doctoral enrolments it is unlikely that we will be able to escalate our PhD production unless we adress a number of systemic constraints such as the size of the pipeline from Honnours onwards and the limited supervisory capacity in the system.

11
We define shape of knowledge production in three terms: How knowledge output is distributed across the 23 universities How knowledge output is distributed across different scientific fields by institution How knowledge outputs are distributed differently across scientific journals (specifically ISI- versus non-ISI) by institution
 by institution")
12
Rank University Average weighted output 2007 – 2008 Share of output (%) Cluster Cumulative percentage 1PRETORIA2180.414.2 1 [> 10%] 14.2 2CAPE TOWN1859.112.126.3 3STELLENBOSCH1745.711.437.7 4KWAZULU-NATAL1637.710.748.4 5WITWATERSRAND1555.310.158.5 6NORTH WEST1072.27.0 2 [3 – 10%] 65.5 7SOUTH AFRICA938.46.171.6 8FREE STATE849.65.577.1 9JOHANNESBURG821.85.482.5 10RHODES544.03.586.0 11NELSON MANDELA470.83.189.1 12WESTERN CAPE465.13.092.1 13TSHWANE UT250.71.6 3 [>0.5 <3%] 93.7 14LIMPOPO239.01.695.3 15FORT HARE152.91.096.3 16CAPE PENINSULA UT151.41.097.3 17ZULULAND134.90.998.2 18VENDA75.70.5 4 [0.5% and less] 98.7 19CENTRAL UT72.10.599.2 20DURBAN UT72.00.599.7 21VAAL UT36.20.299.9 22WALTER SISULU20.70.1100.0 23MANGOSUTHU1.50.0
![Rank University Average weighted output 2007 – 2008 Share of output (%) Cluster Cumulative percentage 1PRETORIA [> 10%] CAPE TOWN STELLENBOSCH KWAZULU-NATAL WITWATERSRAND NORTH WEST [3 – 10%] SOUTH AFRICA FREE STATE JOHANNESBURG RHODES NELSON MANDELA WESTERN CAPE TSHWANE UT [>0.5 <3%] LIMPOPO FORT HARE CAPE PENINSULA UT ZULULAND VENDA [0.5% and less] CENTRAL UT DURBAN UT VAAL UT WALTER SISULU MANGOSUTHU1.50.0](http://images.slideplayer.com/25/8167986/slides/slide_12.jpg "Rank University Average weighted output 2007 – 2008 Share of output (%) Cluster Cumulative percentage 1PRETORIA [> 10%] CAPE TOWN STELLENBOSCH KWAZULU-NATAL WITWATERSRAND NORTH WEST [3 – 10%] SOUTH AFRICA FREE STATE JOHANNESBURG RHODES NELSON MANDELA WESTERN CAPE TSHWANE UT [>0.5 <3%] LIMPOPO FORT HARE CAPE PENINSULA UT ZULULAND VENDA [0.5% and less] CENTRAL UT DURBAN UT VAAL UT WALTER SISULU MANGOSUTHU1.50.0")
13
Rank University Average weighted output 2007 – 2008 Average normed output for 2007 – 2008 Transformed to base of 100 Quar tile clusters 1STELLENBOSCH 1745.7163.5 100.02 1 2CAPE TOWN 1859.1162.8 94.23 3RHODES 544.0138.8 82.29 4WITWATERSRAND 1555.3126.4 71.59 5PRETORIA 2180.4107.1 63.50 6JOHANNESBURG 821.898.4 62.58 2 7NELSON MANDELA 470.895.6 59.85 8KWAZULU-NATAL 1637.787.3 55.58 9NORTH WEST 1072.294.5 54.76 10FREE STATE 849.693.1 49.86 11WESTERN CAPE 465.172.0 43.60 12TSHWANE UT 250.762.3 39.81 3 13SOUTH AFRICA 938.461.1 36.61 14CENTRAL UT 72.164.8 34.94 15CAPE PENINSULA UT 151.444.6 29.23 16ZULULAND 134.946.1 24.94 17FORT HARE 152.938.9 23.11 18VAAL UT 36.225.5 16.46 4 19VENDA 75.721.6 14.77 20DURBAN UT 72.025.0 13.52 21LIMPOPO 239.025.3 13.09 22WALTER SISULU 20.75.3 3.35 23MANGOSUTHU 1.52.4 1.56

14
Rank University First cluster (Normed output) Second cluster (Share of knowledgebase) 1STELLENBOSCH11 2CAPE TOWN11 3WITWATERSRAND11 4PRETORIA11 5RHODES12 6KWAZULU-NATAL21 7JOHANNESBURG22 8NELSON MANDELA22 9NORTH WEST22 10FREE STATE22 11WESTERN CAPE22 12SOUTH AFRICA32 13TSHWANE UT33 14CAPE PENINSULA UT33 15ZULULAND33 16FORT HARE33 17CENTRAL UT34 18LIMPOPO43 19VAAL UT44 20VENDA44 21DURBAN UT44 22WALTER SISULU44 23MANGOSUTHU44
 Second cluster (Share of knowledgebase) 1STELLENBOSCH11 2CAPE TOWN11 3WITWATERSRAND11 4PRETORIA11 5RHODES12 6KWAZULU-NATAL21 7JOHANNESBURG22 8NELSON MANDELA22 9NORTH WEST22 10FREE STATE22 11WESTERN CAPE22 12SOUTH AFRICA32 13TSHWANE UT33 14CAPE PENINSULA UT33 15ZULULAND33 16FORT HARE33 17CENTRAL UT34 18LIMPOPO43 19VAAL UT44 20VENDA44 21DURBAN UT44 22WALTER SISULU44 23MANGOSUTHU44")
15
University Engineering& Applied Sciences Natural sciences Agriculture Health Sciences Social & Economic Sciences Humanities UFS0.0%25.3%16.7%18.6%13.7%25.7% NWU4.0%25.9%0.0%11.7%58.4% UCT4.8%38.5%0.0%31.5%14.4%10.8% UP7.6%23.7%16.8%17.5%13.3%21.1% UNISA1.2%10.5%0.0%3.2%29.5%55.6% UKZN4.7%29.0%12.6%22.0%17.5%14.1% SU6.0%16.9%11.1%24.0%17.0%25.0% NMMU47.0%0.0%7.0%25.0%21.0% WITS7.6%31.7%0.0%33.1%16.1%11.5% UWC0.0%19.0%0.0%13.0%31.0%37.0% UFH0.0%37.0%15.0%6.0%19.0%23.0% DUT16.4%40.2%0.0%21.7%15.0%6.7% TUT22.4%33.5%10.4%19.1%0.4%10.6% TOTAL7%36%20%16%21%

16
University %ISI-articles (non-SA journals) %ISI-articles (SA-journals) %non-ISI SA -journals %IBSS-journals Total article equivalents recorded UCT67.2%12.3%15.0%1.4%17204 DUT64.8%10.7%20.2%4.3%347 WITS56.9%12.9%26.5%3.6%16352 UKZN53.8%13.9%30.5%1.8%12804 TUT46.3%12.1%30.7%10.9%486 UFH42.6%14.7%37.6%5.2%639 SU40.4%9.6%50.0%N/A13740 UP39.1%14.5%44.9%1.4%14967 UFS34.0%13.8%56.7%1.1%6304 RHODES33.8%15.0%51.2%N/A3103 UWC33.0%9.0%52.0%6.0%1588 NWU32.4%7.0%57.7%2.8%5542 UNISA13.0%4.0%80.0%3.0%6878 NMMU12.5%39.7%45.4%2.5%2527
 %ISI-articles (SA-journals) %non-ISI SA -journals %IBSS-journals Total article equivalents recorded UCT67.2%12.3%15.0%1.4%17204 DUT64.8%10.7%20.2%4.3%347 WITS56.9%12.9%26.5%3.6%16352 UKZN53.8%13.9%30.5%1.8%12804 TUT46.3%12.1%30.7%10.9%486 UFH42.6%14.7%37.6%5.2%639 SU40.4%9.6%50.0%N/A13740 UP39.1%14.5%44.9%1.4%14967 UFS34.0%13.8%56.7%1.1%6304 RHODES33.8%15.0%51.2%N/A3103 UWC33.0%9.0%52.0%6.0%1588 NWU32.4%7.0%57.7%2.8%5542 UNISA13.0%4.0%80.0%3.0%6878 NMMU12.5%39.7%45.4%2.5%2527")
17
Institution 1990- 1992 1996- 1998 2002- 2004 2005- 2007TotalCol %Acc. % Pretoria 322286482510182515.0 UCT 212232291417124411.526.5 Stellenbosch 223207282381118310.937.4 UKZN 1851942253049869.346.7 Wits 22819924333211079.055.7 NWU 881022211257038.063.7 UNISA 29423518125112857.771.4 UJ 1381631182367787.879.2 UFS 1591322062028176.485.6 Rhodes 5771124903983.489.0

18
Broad field Sub-fields with largest number of headcount in broad field Headcount As % of broad total Top 3 sub- fields as % of grand total (1274) Nat & Agric Sciences Biological sciences8925% Chemical sciences7320% Engineering, Materials & Tech Electrical & Electronic Engineering2830% Mechanical Engineering1718% Health SciencesClinical & Public Health8867% Social Sciences Education14232%11% [1] Economic & Management Sciences13631%11% [2] Humanities Religion10642%8% [3] Language & Linguistics7831% Distribution of doctoral graduates by scientific field and discipline (2007)
![Broad field Sub-fields with largest number of headcount in broad field Headcount As % of broad total Top 3 sub- fields as % of grand total (1274) Nat & Agric Sciences Biological sciences8925% Chemical sciences7320% Engineering, Materials & Tech Electrical & Electronic Engineering2830% Mechanical Engineering1718% Health SciencesClinical & Public Health8867% Social Sciences Education14232%11% [1] Economic & Management Sciences13631%11% [2] Humanities Religion10642%8% [3] Language & Linguistics7831% Distribution of doctoral graduates by scientific field and discipline (2007)](http://images.slideplayer.com/25/8167986/slides/slide_18.jpg "Broad field Sub-fields with largest number of headcount in broad field Headcount As % of broad total Top 3 sub- fields as % of grand total (1274) Nat & Agric Sciences Biological sciences8925% Chemical sciences7320% Engineering, Materials & Tech Electrical & Electronic Engineering2830% Mechanical Engineering1718% Health SciencesClinical & Public Health8867% Social Sciences Education14232%11% [1] Economic & Management Sciences13631%11% [2] Humanities Religion10642%8% [3] Language & Linguistics7831% Distribution of doctoral graduates by scientific field and discipline (2007)")
20
University % Black share of article equivalents (1990 or earliest) % Black share of article equivalents (most recent year) DUT17.6%66.4% UFH15.1%51.9% UWC27.0%35.0% UKZN22.8%35.3% TUT9.3%30.7% Rhodes5.4%17.8% UCT5.7%15.1% NMMU0.1%10.1% SU1.0%10.0% UNISA2.9%9.2% WITS3.1%7.3% UP0.0%5.7% UFS0.0%4.9% NWU0.2%3.2%
 % Black share of article equivalents (most recent year) DUT17.6%66.4% UFH15.1%51.9% UWC27.0%35.0% UKZN22.8%35.3% TUT9.3%30.7% Rhodes5.4%17.8% UCT5.7%15.1% NMMU0.1%10.1% SU1.0%10.0% UNISA2.9%9.2% WITS3.1%7.3% UP0.0%5.7% UFS0.0%4.9% NWU0.2%3.2%")
21
University <40 years (1990) 50+ years (1990) <30 years (most recent year) 50+ years (most recent year) WITS38.3%23.9%7.8%64.6% NWU36.6%25.5%12.7%57.8% UNISA34.3%25.8%15.2%52.6% UCT34.8%26.3%17.8%50.3% UFS36.5%30.6%20.4%49.2% UP38.1%23.4%23.2%49.1% UKZN2.5%83.3%16.1%48.3% Rhodes34.4%17.3%11.9%44.5% UFH22.4%42.3%19.5%42.1% NMMU49.6%18.6%18.9%40.8% TUT7.5%65.0%17.7%38.5% SU32.0%34.0%26.0%38.0% UWC50.0%14.0%19.0%38.0% DUT64.3%7.1%0.0%27.5%
 50+ years (1990) <30 years (most recent year) 50+ years (most recent year) WITS38.3%23.9%7.8%64.6% NWU36.6%25.5%12.7%57.8% UNISA34.3%25.8%15.2%52.6% UCT34.8%26.3%17.8%50.3% UFS36.5%30.6%20.4%49.2% UP38.1%23.4%23.2%49.1% UKZN2.5%83.3%16.1%48.3% Rhodes34.4%17.3%11.9%44.5% UFH22.4%42.3%19.5%42.1% NMMU49.6%18.6%18.9%40.8% TUT7.5%65.0%17.7%38.5% SU32.0%34.0%26.0%38.0% UWC50.0%14.0%19.0%38.0% DUT64.3%7.1%0.0%27.5%")
22
The overall size of the university knowledgebase (i.t.o. article and doctoral output) is unlikely to increase The very skewed shape i.t.o. institutional contribution to the knowledgebase and normed productivity of universities reveals “four” clusters that are unlikely to change fundamentally Unless we significantly broaden the human capital base to include many more black (and to a lesser extent female) academics who publish and regenerate the workforce, it is more than likely that both the volume of output and overall productivity of institutions will decline
 is unlikely to increase The very skewed shape i.t.o. institutional contribution to the knowledgebase and normed productivity of universities reveals four clusters that are unlikely to change fundamentally Unless we significantly broaden the human capital base to include many more black (and to a lesser extent female) academics who publish and regenerate the workforce, it is more than likely that both the volume of output and overall productivity of institutions will decline.")
Similar presentations