Download presentation
Presentation is loading. Please wait.

1
Likely Effects Of Climate Change on Runoff from Limpopo Basin - Botswana By Prof. B. P. Parida Dept. of Environmental Science University of Botswana

2
Background Much of Southern Africa below Latitude 20 o S is basically Semi-Arid This includes BOTSWANA where Annual Rainfall ~ 250 – 500 mm Evaporation ~ 2000 mm Topography ~ Flat and Deep Sandy Soil (These together limit the effectiveness of Rainfall)
")
3
Sources of Water Rivers and Streams : Average runoff is very low~0.6 mm for the whole country > All endogenous rivers originating in Botswana are ephemeral with an average of 10 – 70 days of flow in a year. Other Sources : Desalination, Water carriers to tap international rivers – Very Expensive Groundwater :

4
Location of Boreholes in Botswana

5
Sources..(Groundwater..contd) WellfieldExtraction Rate in M m 3 Recharge Rate in M m 3 Jwaneng N.102 Orapa50.2 Palla (Source: BNWMP, 1991) 122.4
 WellfieldExtraction Rate in M m 3 Recharge Rate in M m 3 Jwaneng N.102 Orapa50.2 Palla (Source: BNWMP, 1991) 122.4")
6
Water Supply.. Clearly Botswana is one amongst the water stressed countries of the world (where water use is more than 20% of their renewable water supply) Botswana is highly dependent on its natural resource base : mining, livestock, wild-life based tourism, textiles, soda ash and agriculture
 Botswana is highly dependent on its natural resource base : mining, livestock, wild-life based tourism, textiles, soda ash and agriculture.")
7
In Summary: Water is the single most important constraint to the development of Botswana

8
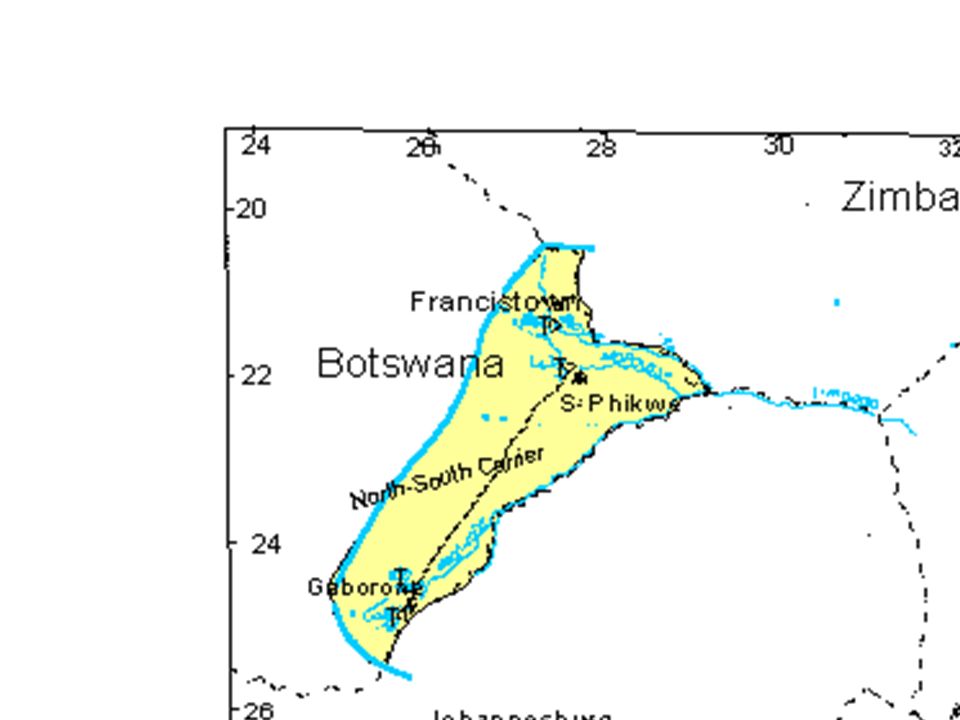
The Limpopo Basin The major source of water in the eastern Botswana and it is important because of its strategic value to Botswana, South Africa Zimbabwe and Mozambique. Drains from a catchment area of about 80 000 km 2 (~1/8 area of Botswana) Approximately carry about 10 mm of surface water annually.
 Approximately carry about 10 mm of surface water annually..")
10
The Limpopo Basin The catchment serves as the main source for Gaborone & rapid and ongoing expansion of southeastern Botswana. In Botswana alone.. 4 dams viz: Gaborone, Bokaa, Letsibogo and Shashe have been built with a total capacity of 350 M m 3 (against projected demand of about 325 M m 3 by 2020)
.")
11
Indicative Studies Reveal that: A rise of 0.02 to 0.05 o C per decade in Africa in the present century (IPCC) ( greatest over the interior of semi-arid margins of Sahara and Central Southern Africa.) Limpopo basin is likely to experience between 5 to 15% decrease in rainfall, 5 to 20% increase in Evaporation, and 25 to 35 % decrease in streamflow. (Desanker and Magadza, 2001).
..")
12
Main objective To quantify the effect of climate change on the flow regime of Limpopo basin – hence develop flow scenarios. to find by what percentage the runoff will either increase or decrease in the coming years? what will be the trend in flow over the coming decades in this century?

13
Philosophy: Rainfall ~ Runoff is a complex paradigm as it represents the catchment ’ s response which is a function of land use So, any adaptation strategy that needs to be developed to overcome the effects of climate change, would primarily centre around a well structured catchment management strategy along with strategies for water use management.

14
PROPOSED METHODOLOGY Use past climatic and flow information (monthly rainfall, PE, and flow data over the past 20-30 years including data on landuse) to carry out water balance, hence compute the annual yield. Use the past data as above to develop an ANN model which can be used for flow predictions. Use the generated climatic scenario to develop flow scenario for the Limpopo.

15
CONCEPT OF MULTI-CELL WATER BALANCE : P = AET + OF + ΔSM + ΔGWS +GWR + Interception

16
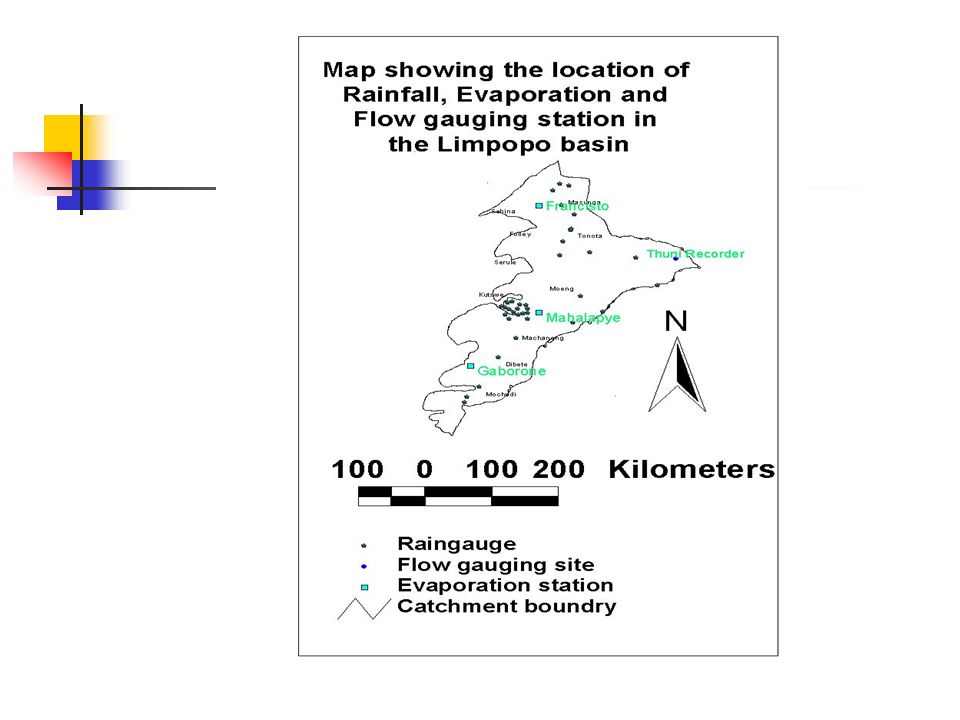
Data Collection: Rainfall Data: Monthly data at 37 stations (1971 – 1998) Evaporation Data: Monthly data at 4 stations (1971 – 1998) Flow Data : Monthly data at 1 station (1978 – 1998) Soil Data : Field Capacity of major soil types in the basin as per the soil atlas.
 Evaporation Data: Monthly data at 4 stations (1971 – 1998) Flow Data : Monthly data at 1 station (1978 – 1998) Soil Data : Field Capacity of major soil types in the basin as per the soil atlas.")
19
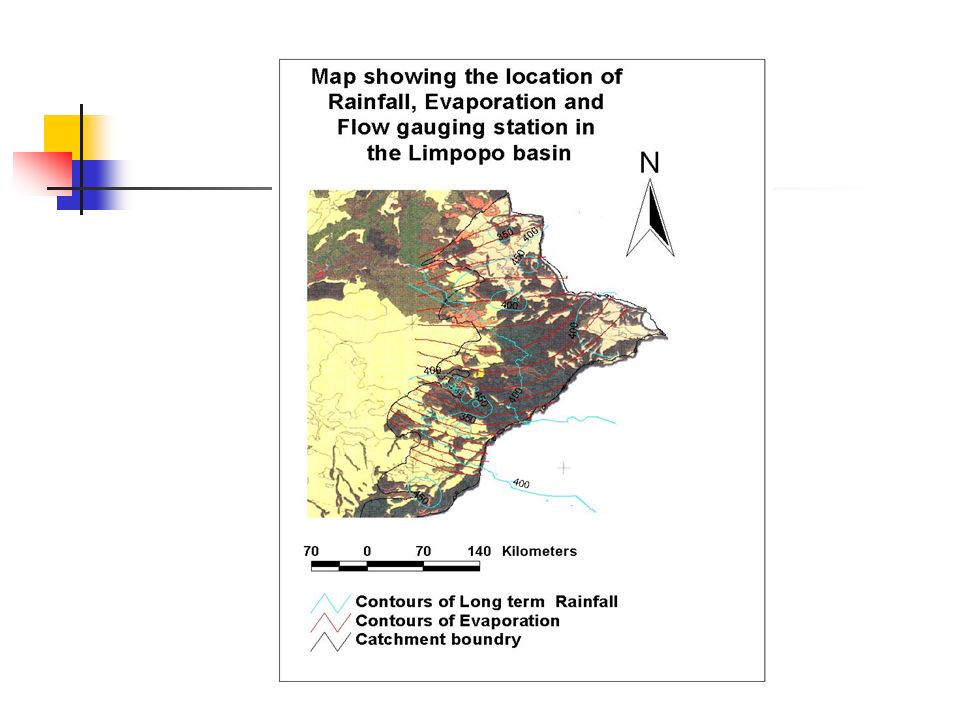
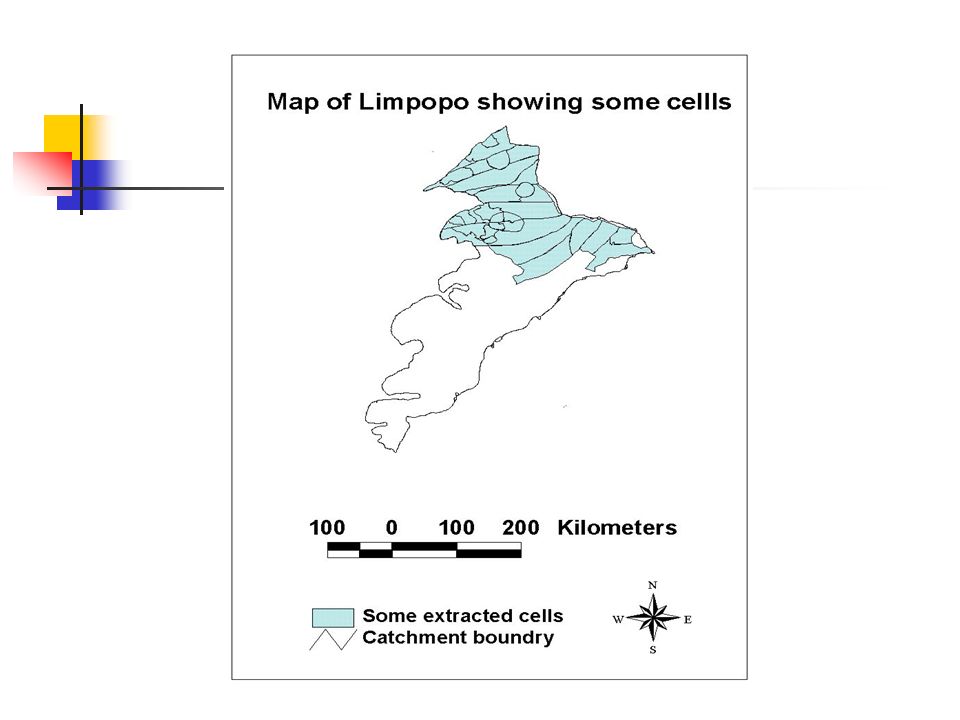
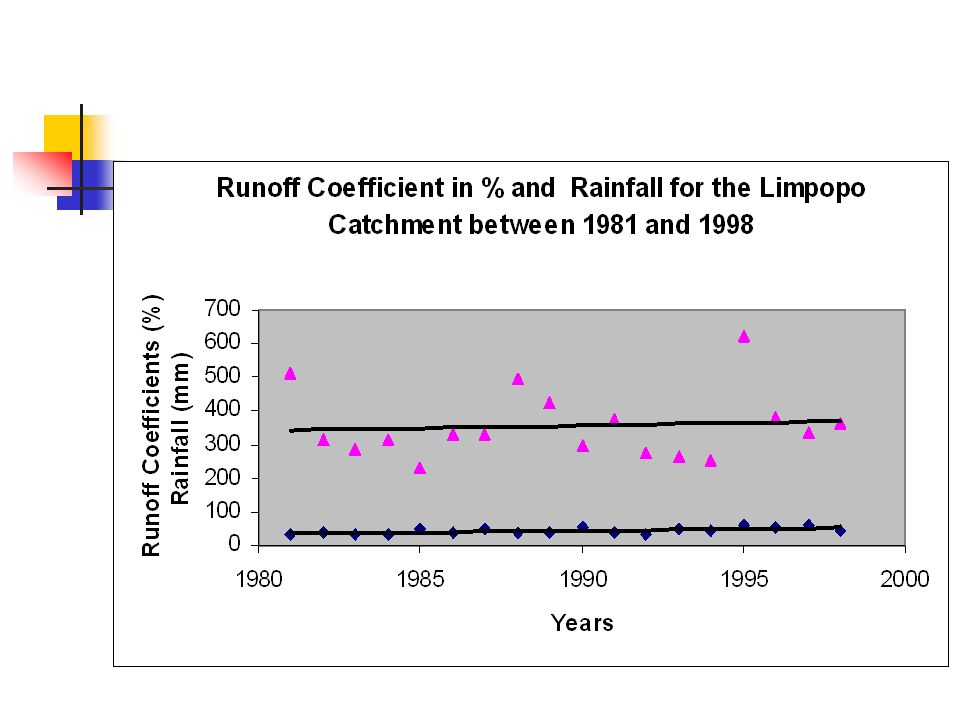
Procedure for Multi-cell Water Balance: Long term average rainfall values and evaporation values are superimposed on the soil map and the catchment is then divided into 75 cells – each cell basically representing uniform rainfall, evaporation and soil type. For each cell and for a given year runoff is computed. (Thornthwaite and Mather, 1957) For each year total runoff from the catchment is computed at the outlet by adding up flows from the 75 cells. Total runoff / Total rainfall = Runoff coeff.
 For each year total runoff from the catchment is computed at the outlet by adding up flows from the 75 cells. Total runoff / Total rainfall = Runoff coeff..")
21
A TYPICAL WATER BALANCE COMPUTATION TABLE ( Field Capacity = 125 mm ) JANFEBMARAPRMAYJUNJULAUGSEPOCTNOVDECTOTAL P103332112320012 6812269 484 PE139808692685262791181411201351172 P-PE-36-47-65-80-36-52-62-67-106-732-66 APWL-102-149-214-294-330-382-444-511-617-6900-66 SM5537221296321012573 ΔSM-18 -15-10-3 125-52 AET121513622353313 69120121 DEFICIT182950703349596610572014565 SURPLUS000000000012362 TARO31168421000012362 RO158421100006131 123 DET168421000006231
 JANFEBMARAPRMAYJUNJULAUGSEPOCTNOVDECTOTAL P PE P-PE APWL SM ΔSM AET DEFICIT SURPLUS TARO RO DET")
26
CONCEPTUALISATION OF ARTIFICIAL NEURAL NETWORK BASED ON A BIOLOGICAL NEURON

27
HOW DOES THE ANN WORK ??

28
A MULTI-LAYERED FEED FORWARD NEURAL NETWORK WITH ONE HIDDEN LAYER

29
Conclusion Using scenario of monthly rainfall and evaporation values from the GCM / RCM models (AF 07), scenarios on likely runoff from the Limpopo basin by the above two techniques will be created.
, scenarios on likely runoff from the Limpopo basin by the above two techniques will be created.")
30
Co-operation needed: Monthly rainfall and evaporation data scenarios for the Limpopo basin in the next 30 – 50 years will be necessary (GCM /RCM / Empirical / Other climate Model). Formulation of appropriate catchment management strategies as possible adaptation strategy.

Similar presentations


>")


>")

 Water Resources (from IPCC WG-2, Chapter 3) Water Resources Primary Source: IPCC WG-2 Chapter 3 – Freshwater.>")


