Download presentation
Presentation is loading. Please wait.

1
Nathan Marsili NWS Northern Indiana 2014 GLOM Workshop

2
PHASE 1 300 MB 700 MB FEBRUARY 1/1200Z

3
300 MB 700 MB FEBRUARY 2/1200Z 300 MB 700 MB

4
*A 2-phased winter storm impacted area Feb1-Feb2. *These different storm phases led to two distinct areas of warning or near-warning criteria accumulations:

5
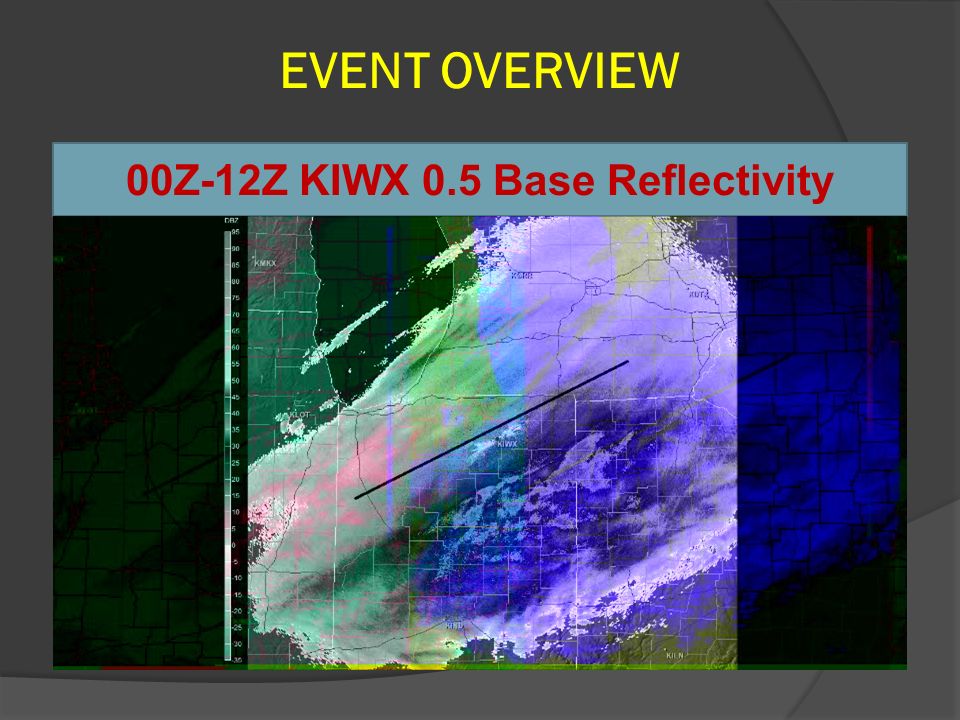
00Z-12Z KIWX 0.5 Base Reflectivity

7
Narrow band of heavy snow

8
NAM QPF VALID FEB02 06-12Z 12Z FEB1 NAM 9-hr QPF 06Z-12Z (F18-F24) 00Z FEB2 NAM 6-hr QPF 06Z-12Z (F06-F12)
 00Z FEB2 NAM 6-hr QPF 06Z-12Z (F06-F12)")
9
-Forecasters struggled with phase 2 of system – large run to run variability in southward progression of mid/upper level frontal zone. -Precip type issues also complicated phase 2 of snowfall forecast across southeast portions of forecast area. -Forecast thinking: Small window of time with profiles conducive for snow and presence of mid/upper level frontogenesis would limit snowfall amounts to less than 2 inches across the southeast. -Upstream sheared waves in southwest flow aloft critical in determining placement of mid level baroclinic zone. -What were some of the important factors leading to the banding toward the end of the event across the southeast portions of forecast area?

10
-Wetzel and Martin (2001) developed a qualitative forecast approach assessing 5 basic ingredients to heavy snowfall forecasting: 1.Forcing for ascent 2.Instability 3.Moisture 4.Efficiency (snow growth) 5.Thermal profiles (top-down considerations) PVQ set to 0 if: 1)Q-vector divergence OR 2)EPV positive PVF set to 0 if: 1)F-vector divergence OR 2)EPV positive
 developed a qualitative forecast approach assessing 5 basic ingredients to heavy snowfall forecasting: 1.Forcing for ascent 2.Instability 3.Moisture 4.Efficiency (snow growth) 5.Thermal profiles (top-down considerations) PVQ set to 0 if: 1)Q-vector divergence OR 2)EPV positive PVF set to 0 if: 1)F-vector divergence OR 2)EPV positive")
11
Pros: -Quick way to assess potential areas for further investigation. -Flexibility for number of different situations. Cons: -Does not distinguish between types of instability. -Not useful when model forecasts are poor. -Qualitative in nature. -Heavy/banded snow can occur in higher stability regions. -Not a substitute for more in-depth analysis. -Magnitude of PVQ/PVF difficult to interpret (model resolution dependence).
..")
12
-Ingredients method utilized for Feb 2 case, calculating PVQ and PVF. -Slight modification made to PVF for current case to include F-vector divergence instead of frontogenesis to better capture model vertical motion due to frontogenesis. -Calculations of PVF and PVQ integrated for 50 mb increments from 850- 500 mb and plotted on plan-view. (only layers of mean RH >= 80% plotted).
..")
13
PVF F06 Valid 06Z PVF F09 Valid 09Z PVQ F06 Valid 06Z PVQ F09 Valid 09Z

14
PVQ F09 Valid 09Z PVF+PVQ F09 Valid 09Z PVQ F09 Valid 09Z

15
00Z NAM Omega (contours), Q-Vector convg (color-filled) F09/Valid 09Z
, Q-Vector convg (color-filled) F09/Valid 09Z")
16
00Z FEB2 NAM F009/V09Z 550-500 mb negative EPVg (color-filled) 550 Q-vector convergence (dashed yellow)
 550 Q-vector convergence (dashed yellow)")
17
00Z NAM F009/V09Z 550-500 mb PVQ

18
00Z FEB2 NAM Qs vector and Qs convg. F09/Valid 09z 00Z FEB2 NAM Qn vector and Qn convg F09/Valid 09z

19
Martin 1999 Martin (1999) linked Qs convergence to the development of thermal ridging in occluded/TROWAL portion of cyclone. Qs vectors pointing with cold air to the left represent counter-clockwise turning of thickness pattern, and with cold air to the right represents clockwise turning of pattern. Qs convergence associated with larger scale synoptic forcing through 1) vorticity adv. and 2) shearing deformation
 vorticity adv. and 2) shearing deformation.")
20
00Z FEB2 NAM 600-500 mb Qs convg 550 mb temps F06/V06Z F09/V09Z F12/V12Z

21
-Lack of consistent F vector full wind frontogenesis signal to heavier snow bands. (poor model resolution of full wind field?) -Strong upper level Qs and Qn convergence signals from the 00Z NAM in approximate area of heavier snow bands. -Geostrophic frontogenesis (Qn) appeared to correlate well to orientation of the heavier snow band (flow characterized by large deformation mag) -Rotational frontogenesis (Qs) may have served important role in prolonging presence of stronger mid/upper level baroclinicity by changing orientation of mid/upper level baroclinic zone. -Thermal ridge development/rotational frontogenesis increased temporal overlap between upper forcing and favorable frozen P-type thermal profiles. -Synoptic scale processes (Qs) appear to have maximized mesoscale response.
 -Strong upper level Qs and Qn convergence signals from the 00Z NAM in approximate area of heavier snow bands. -Geostrophic frontogenesis (Qn) appeared to correlate well to orientation of the heavier snow band (flow characterized by large deformation mag) -Rotational frontogenesis (Qs) may have served important role in prolonging presence of stronger mid/upper level baroclinicity by changing orientation of mid/upper level baroclinic zone. -Thermal ridge development/rotational frontogenesis increased temporal overlap between upper forcing and favorable frozen P-type thermal profiles. -Synoptic scale processes (Qs) appear to have maximized mesoscale response..")
22
00Z FEB1 NAM 700-500 mb vorticity, 600 mb wind speed F33, Valid 09Z/FEB1

23
00Z FEB2 NAM 700-500 mb vorticity, 600 mb wind speed F09, Valid 09Z/FEB1

24
00Z FEB1 NAM 550 mb temp/deform. F33/Valid 09Z 00Z FEB2 NAM 550 mb temp/deform. F09/Valid 09Z

25
0.5 KIWX Base Reflectivity 06Z 06Z FEB2 NAM 600 mb F-vector dvg F00/Valid 06Z

26
0.5 KIWX Base Reflectivity 09Z 06Z FEB2 NAM 600 mb F-vector dvg F03/Valid 09Z

27
CSI ASSESSMENT -Uniform southwesterly geostrophic flow. -Deep saturated/near-saturated conditions. -Strong vertical wind shear/weak stability. -Observed bands spatial and temporal scales fit slantwise conceptual model. -Orientation parallel to thermal wind. -Favorable location, south of jet streak. -Large scale ascent.

28
CSI ASSESSMENT Weismueller/Zubrick 1998 00Z NAM KFWA fcst sounding F09/Valid 09z

29
CSI ASSESSMENT 00Z NAM KFWA Forecast Sounding (F09/Valid 09Z)
")
30
A A’ 0856Z 0.5 KIWX Base Reflectivity

31
AA’ 06Z NAM EPVg (color-filled), omega (green), theta-e (white) F003/V09Z
, omega (green), theta-e (white) F003/V09Z")
32
EPVg Calculations for 2/2/14 Banded Case -Large run to run model variations in distribution from 36 to 6 hours before heavy snow. -Some utility in the 6 to 12 hours preceding heaviest snow (especially < 6 hours). -Provided some indication to the potential of heavy banded snow, but not very helpful in banding location more than 6 hours before heavy snow. -Models slow to latch onto rotational frontogenesis aspect of event, and thus inconsistent depiction of frontal instability. -Small model initialization errors with mid/upper level wind field will hurt reliability of interpretation.
. -Provided some indication to the potential of heavy banded snow, but not very helpful in banding location more than 6 hours before heavy snow. -Models slow to latch onto rotational frontogenesis aspect of event, and thus inconsistent depiction of frontal instability. -Small model initialization errors with mid/upper level wind field will hurt reliability of interpretation..")
33
00Z FEB1 NAM 550:500 Negative EPV F33/V09Z 12Z FEB1 NAM 550:500 Negative EPV F21/V09Z 00Z FEB2 NAM 550:500 Negative EPV F09/V09Z

34
-Mesoscale/synoptic forcing mechanisms not well modeled 18 to 36 hours in advance of heavy snow band. -Ingredients plots did provided some indication of banding potential. -“Smaller” scale synoptic forcing acted to reinforce/focus mesoscale banding. -Q-vector partition indicated that synoptic scale forcing likely played large role in rotational frontogenesis, extended duration mid/level forcing from previous forecast thinking. -Strong indications of slantwise ascent/CSI. -QG analysis from later runs of NAM appeared to align well with mesoscale band. -Event serves an important reminder of the synoptic/mesoscale link.

Similar presentations


 MSC 243 Lecture #8, 10/22/09.>")


 Dan Miller Science and Operations Officer NWS/WFO.>")


