Download presentation
Presentation is loading. Please wait.

1
Surface Ocean Circulation and Geostrophy Fig. CO7 S

2
Ocean currents Moving seawater Surface ocean currents –Transfer heat from warmer to cooler areas –Similar to pattern of major wind belts because wind-driven –Affect coastal climates

3
Ocean currents and climate August temperatures P ZONAL ISOTHERMS

4
Basically zonal P

5
Measuring surface currents Fig. 7.2 S

6
Surface currents Frictional drag between wind and ocean Wind plus other factors such as –Distribution of continents –Gravity –Friction –Coriolis effect cause GyresGyres or large circular loops of moving water

7
Ekman spiral Surface currents move at angle to wind Ekman spiral describes speed and direction of seawater flow at different depths Each successive layer moves increasingly to right (N hemisphere) Fig. 7.5 P

8
Ekman transport Average movement of seawater under influence of wind 90 o to right of wind in Northern hemisphere 90 o to left of wind in Southern hemisphere Fig. 7.6 P

9
Geostrophic flow Ekman transport piles up water within subtropical gyres Surface water flows downhill (gravity) and Also to the right (Coriolis effect) Balance of downhill and to the right causes geostrophic flow around the “hill” Fig. 7.7 P

10
Western intensification Top of hill of water displaced toward west due to Earth’s rotation Western boundary currents intensified –Faster –Narrower –Deeper P

11
Eastern Boundary Currents Eastern side of ocean basins Tend to have the opposite properties of Western Currents Cold Slow Shallow Wide

12
P

13
orange arrows = wind yellow arrows = water P

14
Ocean gyres Fig. 7.3 Subtropical gyres Subtropical gyres Centered about 30 o N or S Centered about 30 o N or S Equatorial current Equatorial current Western Boundary currents Western Boundary currents Northern or Southern Boundary currents Northern or Southern Boundary currents Eastern Boundary currents Eastern Boundary currents P

15
Atlantic Ocean circulation North Atlantic Subtropical Gyre North Equatorial Current Gulf Stream North Atlantic Current Canary Current South Equatorial Current Atlantic Equatorial Counter Current P

16
Climate effects of North Atlantic currents Gulf Stream warms East coast of U.S. and Northern Europe North Atlantic and Norwegian Currents warm northwestern Europe Labrador Current cools eastern Canada Canary Current cools North Africa coast

17
Atlantic Ocean circulation South Atlantic Subtropical Gyre South Atlantic Subtropical Gyre Brazil Current Brazil Current Antarctic Circumpolar Current Antarctic Circumpolar Current Benguela Current Benguela Current South Equatorial Current South Equatorial Current Fig. 7.14 P

18
Other surface currents Equatorial Countercurrents Subpolar gyres Fig. 7.4 P

19
One Sverdrup = 1,000,000 cubic meters/sec =1,000,000 tonnes/sec Wellborn road to Texas Ave to University to George Bush Drive to the height of the O&M Building in 2.75 minutes Peak flood flow of the Mississippi River is 0.03 Sv. P Harald Sverdrup 1888-1957

20
> 2 knots < 2 knots PP

21
S

22
Coastal upwelling Ekman transport moves surface seawater offshore (upwelling) Fig. 7.11a P
 Fig. 7.11a P")
23
07_12a-c S

24
Figure 7.10 Equatorial upwelling

25
Other surface currents Equatorial Countercurrents Subpolar gyres Fig. 7.4 P

26
Low concentrations except in equatorial Pacific and high latitudes at the surface P

27
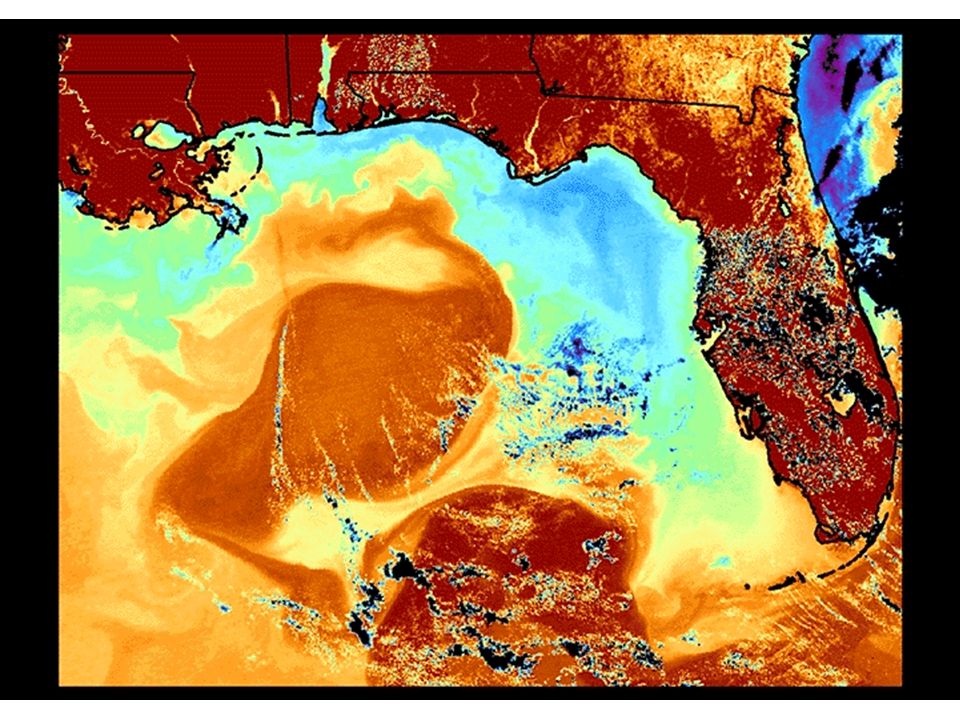
Satellite view of surface chlorophyll - purple areas are low values red and yellow areas are high - Note the large surface area with low chlorophyll Purple areas are permanently stratified PP

28
Antarctic circulation Fig. 7.14 Antarctic Circumpolar Current (West Wind Drift) Antarctic Circumpolar Current (West Wind Drift) Encircles Earth Encircles Earth Transports more water than any other current Transports more water than any other current East Wind Drift East Wind Drift Antarctic Divergence Antarctic Divergence Antarctic Convergence Antarctic Convergence
 Antarctic Circumpolar Current (West Wind Drift) Encircles Earth Encircles Earth Transports more water than any other current Transports more water than any other current East Wind Drift East Wind Drift Antarctic Divergence Antarctic Divergence Antarctic Convergence Antarctic Convergence.")
29
S

30
Rings, or eddies, are important because they transfer heat, salt, plants and animals across strong boundaries. P

31
Fig. 7.16 Best studied Best studied Meanders or loops Meanders or loops Warm-core rings Warm-core rings Cold-core rings Cold-core rings Unique biological populations Unique biological populations Gulf Stream P

32
Cold-core Rings S

33
S

34
P

36
North Atlantic Gyre South Atlantic Gyre PP

37
S

38
One sverdrup = 1,000,000 cubic meters/sec Wellborn road to Texas Ave to University to George Bush Drive to the height of the O&M Building in 2.75 minutes Peak flood flow of the Mississippi River is 0.03 Sv. Peak flood flowof the Mississippi River is.03 sv. P

39
Numbers are sverdrups (millions of cubic meters per sec) and the flow on the eastern boundary must equal that on the west, therefore, slower broader flow on the east means narrower, faster flow in the west. S

40
S

41
S

Similar presentations


>")

