Download presentation
Presentation is loading. Please wait.

1
abcd AGEING POPULATION - Burden or Benefit? Demographic Trends Adrian Gallop Edinburgh 21 January 2002

2
AGEING IN THE UNITED KINGDOM WHERE ARE WE NOW AND HOW DID WE GET HERE?

3
Ageing population The main reasons for the ageing population structure of the UK population are: Baby booms, followed by Falling fertility rates Falling mortality rates

4
2000-based national population projections United Kingdom 2000 Small cohorts born during WWI Large cohorts born immediately after WWIVery small cohorts at start of WWIIPost WWII baby boom 1960’s baby boom Lowest fertility rate skip

5
Total fertility rate, United Kingdom, 1951–2000

6
Average achieved family size by age and year of birth of women United Kingdom, 1940-1975

7
* CFS for cohorts born 28 years earlier Period and cohort measures

8
* CFS for cohorts born 28 years earlier Projecting fertility

9
Expectation of life at birth according to death rates experienced in given years United Kingdom, 1911-1998

10
Proportion of persons surviving to successive ages, according to death rates experienced or projected England and Wales, 1851-2031

11
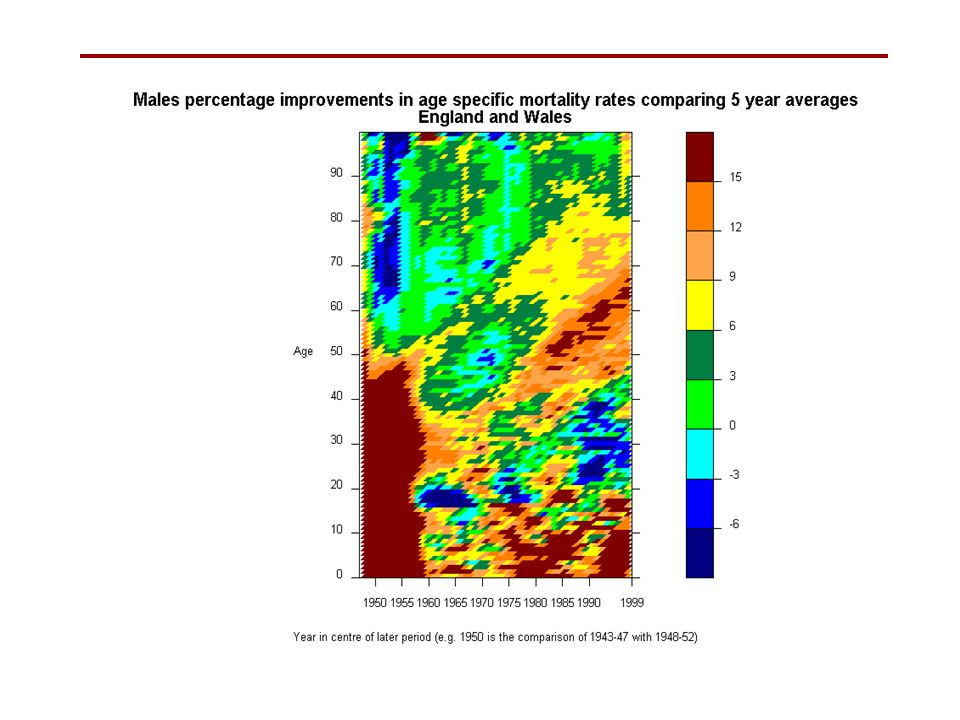
Effective annual rates of improvement in mortality between successive English Life Tables Males

12
Effective annual rates of improvement in mortality between successive English Life Tables Females

15
Changes in mortality 1980-95 ASMRs for under 15s halved for M & F Little reduction for males 15-44 (c10%) Slowdown for females 15-44 (c20%) Greater reduction for males aged 45-74 (c30%) than females (c20%) Similar reductions for males and females aged 75 and over (c20%)
 Slowdown for females (c20%) Greater reduction for males aged (c30%) than females (c20%) Similar reductions for males and females aged 75 and over (c20%)")
16
Life expectancy at birth by social class – males (E&W)
")
17
Life expectancy at age 65 by social class – males (E&W)
")
18
AGEING IN THE UNITED KINGDOM WHERE ARE WE GOING? Population projections for the UK

19
Expectation of life at birth, United Kingdom, 1981-2040

20
Expectation of life at birth according to mortality rates assumed for selected years

21
* CFS for cohorts born 28 years earlier Projecting fertility

22
Projecting migration Total net migration, United Kingdom

24
2000-based population projections United Kingdom 2000

25
2000-based population projections United Kingdom 2005

26
2000-based population projections United Kingdom 2010

27
2000-based population projections United Kingdom 2015

28
2000-based population projections United Kingdom 2020

29
2000-based population projections United Kingdom 2025

30
2000-based population projections United Kingdom 2030

31
2000-based population projections United Kingdom 2035

32
2000-based population projections United Kingdom 2040

33
2000-based population projections United Kingdom 2045

34
2000-based population projections United Kingdom 2050

35
2000-based population projections United Kingdom 2055

36
2000-based population projections United Kingdom 2060

37
2000-based population projections United Kingdom 2065

38
2000-based population projections United Kingdom 2070

39
Actual and projected population by broad age group, United Kingdom, 1900-2070

40
Actual and projected age distribution, United Kingdom, 1981-2070

41
Population under 16 and over pension age, United Kingdom, 1981-2025

42
Actual and projected dependency ratios, United Kingdom, 1971-2051

43
Actual and projected components of elderly dependency ratio United Kingdom, 1971-2051

44
COMPARISON OF TRENDS IN UK TO THOSE IN OTHER COUNTRIES

45
Source: United Nations Expectation of life at birth for males, 1950-2010

46
Source: United Nations Expectation of life at birth for females, 1950-2010

47
Expectation of life at age 60 EU countries For males, UK lay 8 th equal with 18.8 years highest 20.3 years - Greece lowest 17.8 years - Ireland For females, UK lay 12 th with 22.5 years highest 25.1 years - France lowest 21.5 years - Ireland

48
Source: United Nations Percentage increase in numbers aged 65 & over, 1990-2050

49
Source: United Nations Total period fertility rates in Europe, 1960-2010

50
Source: United Nations Number of pensioners per 1000 “workers”, 1970-2050

51
Source: United Nations Number of pensioners and children per 1000 “workers”, 1950-2050

52
SUMMARY

53
Actual and projected population estimates and dependency ratios, United Kingdom, 1901-2050

54
DEMOGRAPHIC AGEING falling fertility increasing expectation of life baby boomer bulge in some countries increasing elderly population increasing numbers of very elderly deteriorating dependency ratios in long term ageing working population in many countries

Similar presentations


 Department of Demography University of Colombo & Senior Research Fellow NCAS Sri Lanka>")
 Mr Elliott SSOT.>")


 in a given year.>")

